Update on New England Winter Storm

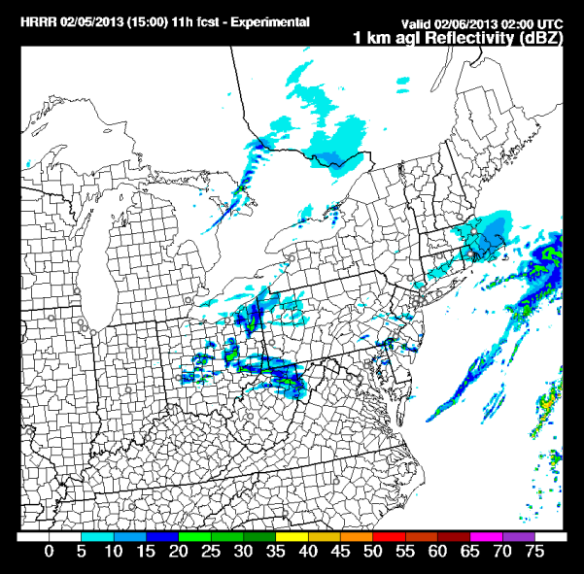
A winter storm with the potential for embedded blizzard conditions is now moving up the Atlantic coast of the United States. Very heavy snow is likely over most of New England today and tomorrow. Thousands of flights out of Boston, New York, and other airports in the northeastern U.S. have either been canceled or delayed as a result of this potentially historic storm.

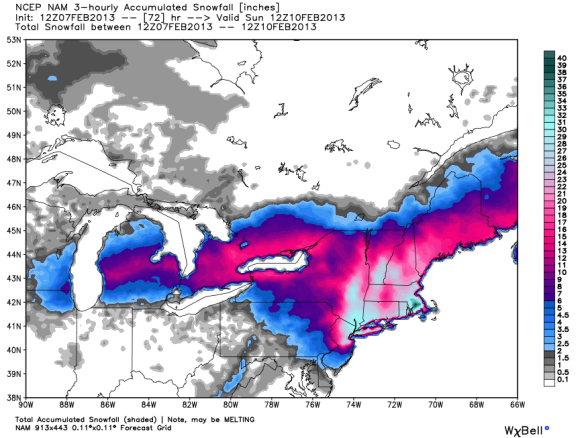
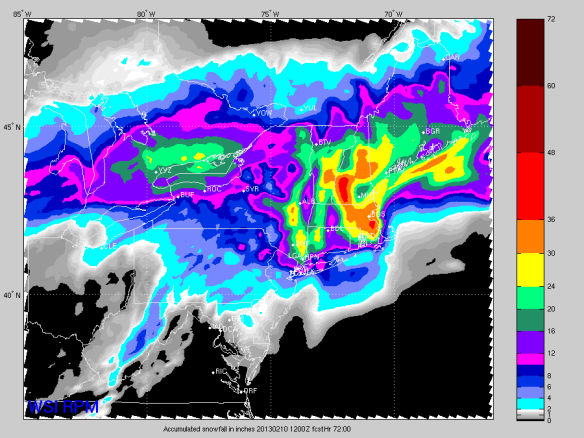
This afternoon’s WRF model run gives most of Massachusetts, Connecticut, and Rhode Island 15-30″ of snow through 7am Sunday:

feb8-12kmwrf12zsunday

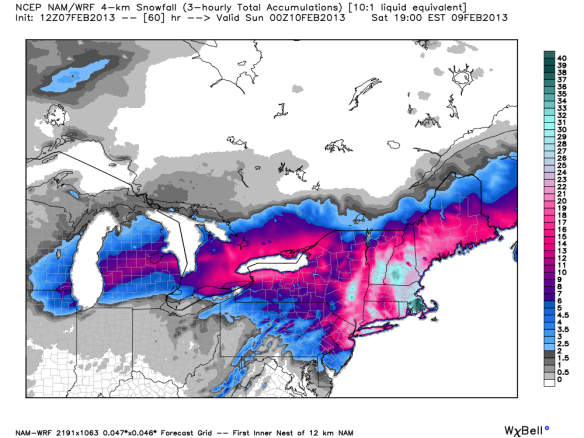
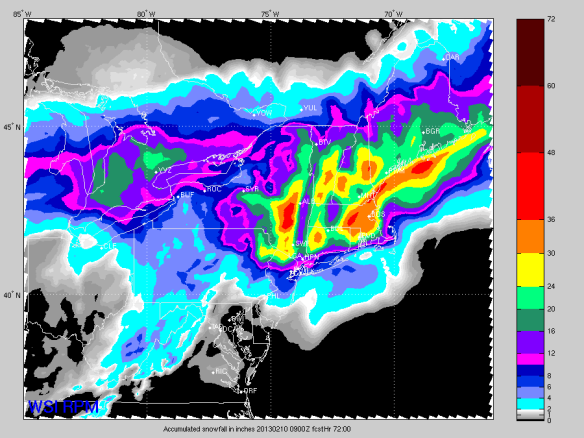
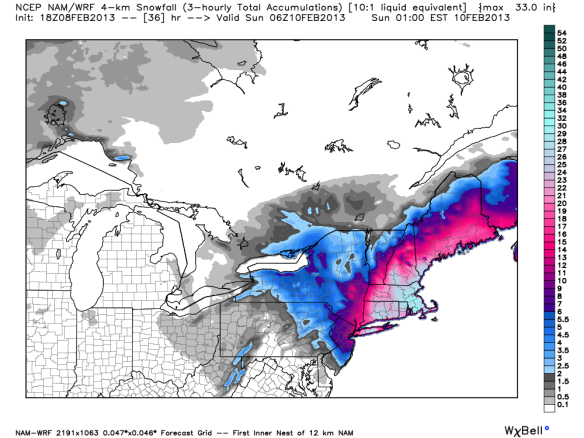
This afternoon’s higher-resolution WRF model gives 2’+ of snow to the Boston area by 1am Sunday:

feb8-4kmwrf6zsunday

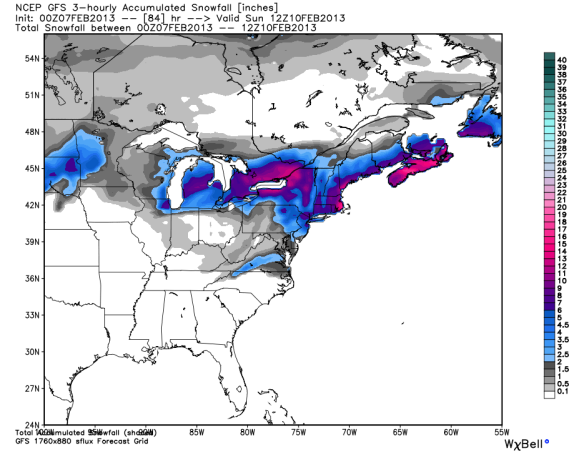
This morning’s GFS model is more conservative with snowfall totals through 7am Sunday but still gives most of New England 10-20″ of snow:

feb8-gfs12sunday

Precisioncast, our in-house model, paints 2’+ of snow through the the weekend in and around Boston:

feb8-pcsnow

Blizzard Warnings, Winter Storm Warnings, and Winter Weather Advisories cover all of New England and parts of the Mid-Atlantic:

feb8-wwalerts

Why is so much attention being given to this winter storm? The simple answer is it will likely be historic. 27.5″ is the most amount of snow Boston has seen from a single storm (February 16-18, 2003). Many near Boston will likely see 2’+ of snow for the entire event. Compare that to our snowiest winter on record in Cincinnati (January 1978):

feb8-winterstormperspective

Travel is highly discouraged or temporarily against the law in parts of Massachusetts, Connecticut, and Rhode Island. This storm will make headlines!

Big Snow Coming To New England, But How Much?

The top story on the national news this weekend will be a nor’easter pounding New England and the Mid-Atlantic with heavy snow. Models have been reasonably consistent on giving the Boston area at least a foot of snow from Friday through Sunday, but some models are more aggressive than others.

So what’s the latest thinking on how much snow Massachusetts, Connecticut, Maine, New York, New Hampshire, and Vermont are going to get? Let’s start with the snowfall forecast from this morning’s NAM model (through 7am Sunday morning):

feb7-12znamsnow12zsun

The NAM model says most will get 10-20″ of snow, and some (in the shades of white and dark green) will see 30-40″ of storm total snowfall accumulation. A higher-resolution of this morning’s NAM model run shows similar amounts of snow, but with some higher totals in New Hampshire:

feb7-12z4kmnamsnow00zsun

Next up is last night’s GFS model snowfall forecast (through 7am Sunday):

feb7-00zgfsnam12zsun

The GFS is clearly not as aggressive with snowfall totals; it gives most of New England 2-10″ of snow with 10-20″ for eastern Massachusetts and downwind of Lake Ontario and Erie. What does last night’s ECMWF think for snowfall amounts Friday through Sunday? Here’s your answer:

feb7-00zecmwfsnow12zsun

Essentially, the ECMWF model is a blend of the latest GFS and the NAM model runs; the ECMWF gives most of New England 2-10″ of snow and the Boston area 20-30″ of snow.

WSI’s RPM model from 7am this morning gives most of New England 5-15″ of snow and areas close to the coast 2’+:

feb7-12zrpmsnow

The 4am run of the RPM model looks similar, but different enough to give New England forecasters something to think about:

feb7-9zrpmsnow

It is worth noting the the NAM, GFS, and ECMWF maps above assume a 10:1 snow-to-liquid ratio. In other words, the snowfall charts are made with the assumption that 0.1″ of liquid output from the models is equal to 1.5″ of snow in the same spot. This is a low-end approximation for this scenario. Models suggest snow-to-liquid ratios will be closer 15:1 or even 20:1 in spots Friday, Saturday, and early Sunday. This means that the snowfall maps above may be underdoing the amount of snow in spots this weekend.

Analogs (comparing this system to others in the past) suggests most of New England is likely going to get 12-24″ of snow. One of the strongest analogs to this upcoming event is the February 12, 1983 blizzard…which turned New York City into this: http://youtu.be/U9LiWVXpqg4

I don’t envy meteorologists making localized snowfall forecasts for the Mid-Atlantic and New England. This will be a tough forecast. This storm has the potential to be historic not only for snow amounts but also for it’s minimum pressure (how deep the center of low pressure gets). I wish forecasters along the East Coast the best of luck with this one!

Why Was It So Cloudy Today? The Temperature Aloft Is To Blame…

Yesterday evening in the weather center, it became very clear that stratus clouds moving in from the north were moving our way, and those clouds were going to be tough to shake today. Why did the forecast need to be adjusted from thinking earlier this week? The answer comes from an understanding in how the temperature changes going away from the ground.

In meteorology, we learn what is going on in the upper-levels of the atmosphere by launching weather balloons across the county. One of those balloons was launched this morning at the National Weather Service forecast office in Wilmington. Meteorologists see wind, temperature, and dewpoint trends from the ground to the upper-levels of the atmosphere on a diagram called a Skew-T. This is the Skew-T from Wilmington from 7am this morning:

feb6-12zilnsounding

Unless you’re a weather aficionado, you may not be able to make sense of much of much on this diagram. The black line at the bottom of the plot represents the ground and the top of the plot represents the upper-levels of the atmosphere. The red line is the temperature, the green line is the dewpoint, and the black lines in a row on the right side of the plot represent the wind direction and speed. Let’s simplify it…and just look at the temperature in Wilmington at the ground and aloft around 7am this morning:

feb6-inversion

In the graph above, you can see the temperature rise and fall between the ground and 18,000 feet above the ground. Usually, the temperature decreases going away from the ground. In this morning’s case, we see temperatures decrease rising from the ground to 5,000 feet up. Between 10,000 and 15,000 feet above the ground, the temperature increases. In meteorology, this is called a temperature inversion:

feb6-inversion2

A temperature inversion is another way of saying there is a layer of stable air above the ground. When clouds are trapped below this layer of stable air, they are often slow (and in some cases, very slow) to mix with drier air in the atmosphere, including above the temperature inversion:

feb6-inversion3

As of 3:45pm, this temperature inversion is holding tough, and clouds persist in and around Cincinnati, while ample sun is found over most of central and eastern Kentucky:

feb6-345pmsat

These temperature inversions make forecasting the weather tricky. A difference of 1-3° in  the temperature at any given point above the ground can make the difference between quick clearing and slow clearing. Little to no clearing is forecast through mid-evening.

Flurries Tonight, Longer Range Forecast Looks Warmer With Rain

Two disturbances will push through the Ohio Valley between now and midnight; the first will move through over the next couple of hours, and the second will move through later this evening. A satellite and radar snapshot as of 3:55pm shows these two pieces of upper-level energy approaching the Cincinnati area:

feb5-355pmsatrad

The latest HRRR model’s forecast radar product has flurries favored northeast of the Tri-State around 9pm tonight:

feb5-9pmrefl

Only flurries are forecast in the Tri-State this evening; little to no accumulation is forecast in and around the Tri-State. The latest run of Precisioncast gives no Tri-State community accumulating snow through tomorrow morning:

feb5-adonissnow

The latest run of Microcast gives us little to no accumulation through tomorrow morning:

feb5-mcsnow

Fog and dense fog will be a concern tomorrow morning. Visibilities in spots may be under a 1/2 or even 1/4 of a mile. Once the fog dissipates, ample sunshine is forecast Wednesday. Clouds will increase tomorrow night and Thursday, and a line of showers will sweep through Thursday night and early Friday. The best chance for rain in the next week will be late Sunday and Monday.

While rain will come and go in the week ahead, near or above average temperatures are forecast through the weekend. This morning’s ECMWF model has warm air surging into the Ohio Valley ahead of Thursday night’s cold front:

feb5-ec8amthur

We should make it into the 50s Thursday afternoon. Some colder air will swing into the Ohio Valley Friday and Saturday (highs will be 40-45° each day), but warmth returns to the Tri-State by Sunday night and early Monday:

feb5-ec6zmon

Temperatures will likely each into the 50s both Sunday and Monday afternoon. The latest ECMWF and GFS models bring another shot of cold air into the Tri-State by Tuesday or Wednesday next week.