A Sycamore Story: Putting A Weather Station On The Roof

Since I returned back home to Cincinnati in late 2011, I’ve been connected with Sycamore Community Schools in a lot of ways: through teachers, through friends, and by getting involved in district activities. Sycamore is a district with award-winning education, and Sycamore is working on some new initiatives to make sure students are better prepared for the workforce.

Before a weather station and camera network was created at Local 12, I spoke at a STEM (science, technology, engineering, and mathematics) meeting with Sycamore staff in 2012. I discussed the value of having a weather station at a school. First, the data collected by the weather station can be used in the classroom to teach math, science, technology, and computer programming. The data can also be shared with the National Weather Service and media to show current weather conditions; these data are especially important during active and severe weather.

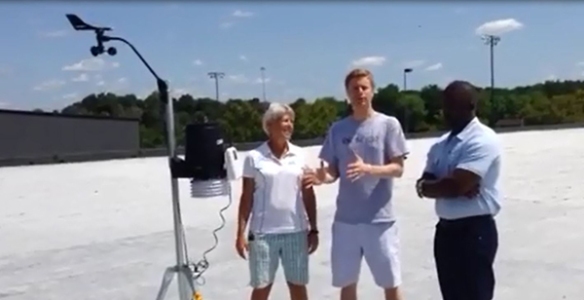
Sycamore recent initiatives opened up an opportunity to put a weather station at Sycamore High School. With the backing of the district, the weather station arrived at the high school last week, and the installation began on Wednesday:

aug7-weatherstation

Mr. Chad Husting, a science teacher at the high school, Ashwin Corattiyil, the Dean of Students at the high school, and I set up the weather station on Wednesday. Mr. Husting was nothing short of MacGyver connecting the pieces together. He even came in Friday to secure the station’s pole and tripod!

The weather station is away from wind blocks and obstructions and also away from where animals and people can influence the measurements with it:

aug7-roofshot1

The wind speed and direction are measured at the top of the weather station, and rainfall and temperature measurement are taken in the black and white-colored units, respectively.

It is important that the station is positioned away from walls, buildings, and trees that can block the wind. That makes the roof a great spot!

aug7-roofshot3

Note the cinder blocks holding the weather station down. Derrick Richardson (assistant principal), Ms. Haverkos (high school science teacher), two custodians, Ashwin, and I put those there to make sure the station was secure (they did most of the work)!

aug7-weatherstation2

The weather station has a wireless connection to a console in the building. From the console, the data are uploaded to the Internet and to various sources:

aug7-wxstationconsole

While at the school, students will be able to see the data on the console, but the data will also flow to several places online, including:

http://www.weatherlink.com/user/sycamorehs
http://www.wunderground.com/personal-weather-station/dashboard?ID=KOHCINCI139
http://mesowest.utah.edu/cgi-bin/droman/meso_base_dyn.cgi?stn=E7726 (coming by mid-August)

This is an exciting time for Sycamore not just because I see a weather station on the roof but because students, staff, and the community benefit from having that data. Science teachers at Sycamore High School, including the ones listed above, seem to be very excited about this new teaching tool, and I’m hopeful that the success of this weather station is so big that it spreads to other schools throughout the district.

Ironically, Sycamore High School is across the street from a neighborhood heavily damaged by an F4 tornado back on April 9, 1999. Those who have lived in Blue Ash, Montgomery, and Symmes Township for years know that a simple weather station is more than just education; it’s safety.

All I Really Need To Know I Learned From My High School Physics Teacher

Meet Mr. G. Some call him Mr. Gutekunst. Some (not me) call him Mike.

aug2-mrg

Regardless of what you call him, he was my physics teacher junior year of high school. I have seen him twice since I graduated. One of the best luxuries of working in your hometown – especially as a public figure – is that you can connect with people from your past fairly easily. The picture above shows we have both managed to keep our youthful look after many, many years.

I learned a lot from Mr. G. He basically set a foundation of science that I use daily as a meteorologist. Sure, all sciences – biology, chemistry, and others – are connected to meteorology, but physics is one of the most important.

While a love for science can connect two people, I remember Mr. G most for what he taught me about life. It is cliché, but what he taught on the last day of class was revolutionary and an appropriate foreshadowing for the reality of life.

I had lunch with Mr. G this past Thursday. We spent over two hours discussing our lives. We discussed everything from our families to our journey.

This blog post is not about a lunch reunion that many of us frequently have. I recognize many of us catch up with friends and colleagues, and that this meeting over lunch doesn’t seem unique.

I share this lunch meeting story because Mr. G discussed a message about life from which we could all learn.

When I was a junior in high school, Mr. G shared the “Mr. G Story” on our last day of class. With me being in his first ever class, he was in his early 20s giving his students – just a few years younger – some valuable lessons on life. Being a Purdue University physics and engineering major, a lot of his story was about keeping the pace going, fighting the urge to stop, and finding time to enjoy what makes you happy.

Part of our lunch conversation on Thursday was about the gist of the Mr. G Story, which had become grayer and fuzzier in my mind with time. I asked Mr. G to share the gist with me, and he deferred answering my question until he could look at his notes. He told me his story had changed some over time, but the overall principles were still the same. The gist of the Mr. G Story is to answer key questions about your life, and – yes – you must answer them:

1) What do you enjoy doing most?  When are you most satisfied in your life?

2) What are your best attributes, according to you?

3) How did you get to this point in your life?  Do you like where you’re going?

4) What do you want your life to stand for?  What do you want your name to mean?

5) If money was no object, what would you do with your life?

6) What will constitute you being a success in your life?  How will you know when you’ve succeeded?

7) Will your intended career path pay you a salary that lets you live the lifestyle you prefer? (put simply – will you make enough money to be happy?)

These seem like simple questions, but if you revisit them a time or two, you realize they aren’t as simple as they seem. Even if one of these questions seems simple, the next one may not be so simple. Some of these questions make you question what you are doing with the limited number of days you have on Earth.

Some could look at me, a meteorologist working at a great station in my hometown, and say I was successful. There are, however, so many things in my life that are incomplete or could use a change. I know I’ve made my mother proud, and I believe my late father would be proud of what I have done with my life. Both of them either say or would say my life is not about them though; it’s about me being in charge of my own life.

Question 6 hits me the hardest. How do you know when you are a success? What do you do once you’ve achieved success? What’s next?

I hope these questions have meaning to you, and I hope you revisit some of them before you close this webpage, end your day, or end your week. The answers to these questions can take a lifetime. If a man inspired me to contact him and have lunch years after I left his classroom, the questions he poses to all his students can be asked of all of us.

Ask yourself the tough questions. I’ve already printed the questions above and placed them over my desk at home. When a tough decision comes, I’ll be asking myself these questions until I know the answers.

Why Josh Knight Will Be Missed

You might know him as a a meteorologist. You might know him as a feature reporter covering local events and businesses. You might know him as both. Regardless of how you know him, he will be missed.

jul11-josh

Josh is exactly the person you see on-air. That’s not always the case in the TV business, but it definitely is with Josh. You see his bright, bubbly personality on television, and that’s the way he is when the red light on the camera goes off.

I often joked with him off camera that he is every ray of sunshine on a cloudy day. When something “less than optimal” came his way, he found a way to make it positive. That thing that would make most of us say “I really have to do this?” became “This is a great learning experience” to him. He always found a way to make put a bright spin on a bad situation…or at least try to bend it positive.

While his positive bias has served him well, Josh is also a very good meteorologist. When I say very good meteorologist, I mean it. An Ohio Valley forecast is always a challenge. When my shifts followed his, I rarely made changes. He would often say – either through notes or in person – that his confidence in certain weather situations wasn’t high; despite what he says, his forecast is ahead of the curve. He takes the time to look through lots of model data and make reasonable decisions that made the most sense. Where I struggle in pattern recognition and specifics, he excels. When my confidence to break away from computer guidance is weak, his is strong. When I bend away from guidance, he bends more. His confidence makes me more confident. He did this without bragging or boasting; he did it without even knowing it.

Josh is moving to WJLA in Washington D.C., closer to his hometown. As a guy who works in his hometown, there is no place like home, and it’s great to be home. I am happy for him because he will use his talents to the fullest there. WJLA is a station I respect and many in D.C. respect, and they are adding a great meteorologist to their team. His problem solving and critical thinking skills are top notch, and he will be a great asset to WJLA.

I hope you join Josh one last time on Good Morning Cincinnati from 8am to 9am and from 11am to 12pm.

My Take On Upcoming SPC Severe Weather Risk Changes

For years (really decades), the Storm Prediction Center has issued severe weather risks for the contiguous United States using “slight,” “moderate,” and “high” risk categories. Areas of the country that are most likely to see severe weather are typically placed under a “slight” risk for severe storms at least several times a year, a “moderate” risk up to a couple of times per year, and a “high” risk once every year or two when a major severe weather outbreak is expected.

But all of this is about to change. The 3-categories currently used to classify severe weather will soon expand to 5-categories.

In this interview, Greg Carbin with the Storm Prediction Center says “in the modern era, with the Internet, anybody can look at these [severe threat] graphics. So it’s our responsibility to convey that risk information in a way that’s a little easier to understand for the lay person as opposed to the expert. […] What we are hoping to do with these categories is convey that risk with meaningful words, colors, and numbers.”

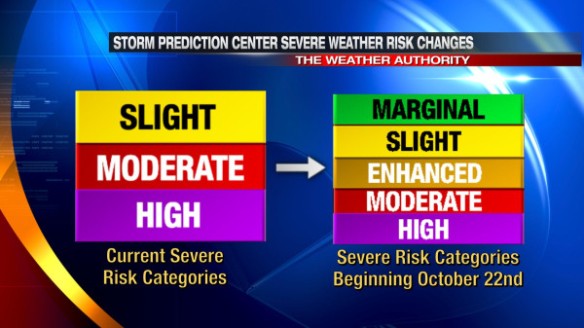
What does this change look like? Here’s a breakdown of what the severe weather risk categories are now and what they will be beginning October 22nd:

aug17-spc-oldnewcategories

In simple terms, the “moderate” and “high” risk categories really won’t be changing this fall, and the current “slight” risk category will be broken down into 3 different categories (marginal, slight, and enhanced). Technically, the “marginal” risk will be a new category just under the current “slight” risk category.

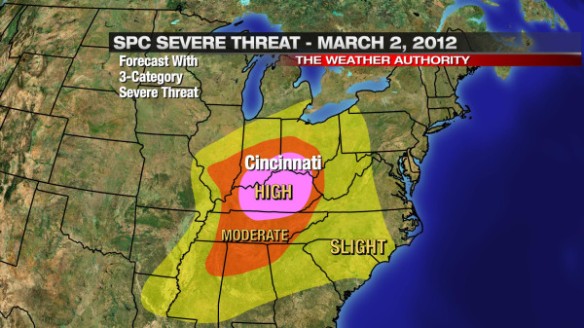
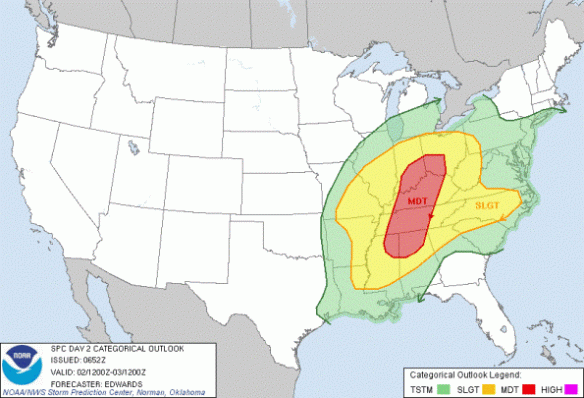
Higher-end risks will still be higher-end risks. Late in the morning of March 2nd, 2012, the Ohio Valley was covered with a “moderate” to “high” risk for severe weather:

aug17-spc-march2old

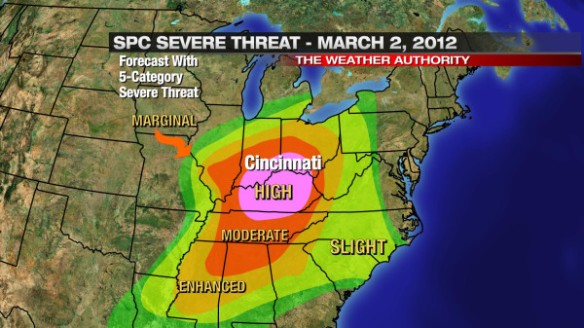
Had this same severe weather outlook been issued using the 5-category severe weather outlook coming this fall, the risk for severe weather in the heart of Ohio Valley would have been the same:

aug17-spc-march2new

The risk for severe weather would have been labeled differently for the northern Indiana, northern Ohio, and parts of the Tennessee Valley.

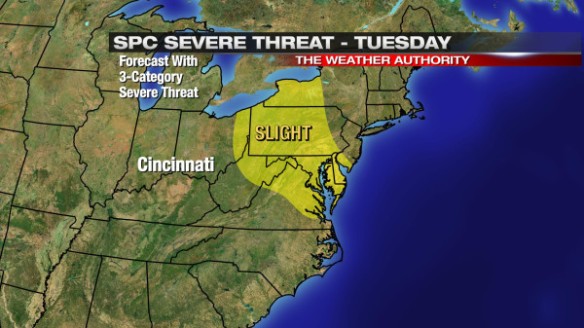
The changes from SPC were really made to break down lower-end severe weather threats more. Last Tuesday morning, a “slight” risk for severe storms was issued for much of New England:

aug17-spc-tuesdayold

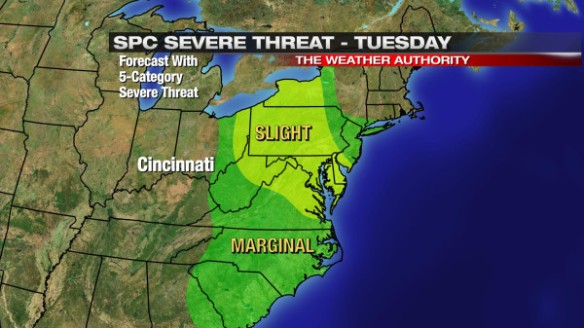
Had this same outlook been issued using 5 severe weather categories, a “marginal” risk for severe storms would have surrounded the “slight” risk from central New England through the Carolinas:

aug17-spc-tuesdaynew

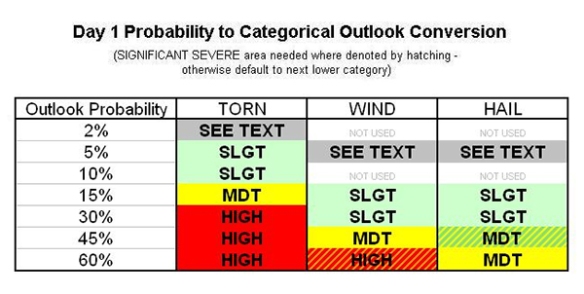
If you’re confused with all of the changes, you’re not alone. If you’re confused by the current outlook categories, I understand that, too. Here’s the probability table (based on a severe weather report occurring within 25 miles of a point) used by SPC forecasters to draw the severe weather threat for the current day:

aug17-spc-currentday1
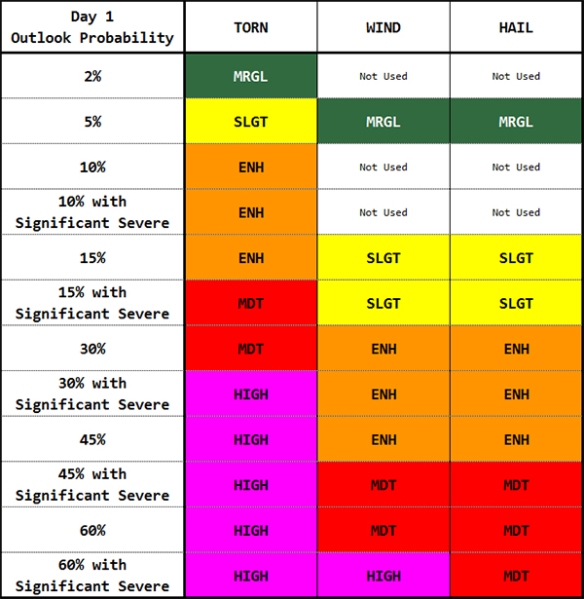
If you think that’s messy, here’s the probability table SPC forecasters will use to issue severe weather outlooks beginning October 22nd:

aug17-spc-futureday1

There are different tables for days 2 and 3 of the forecast. Making these forecasts is a challenge given model uncertainties and forecast time constraints. Creating these outlooks is not an easy job.

Why are the outlooks changing? I’m not entirely sure, and I don’t think the public does either.

I’m not so sure a change is needed here. More importantly, I’m not so sure the general public is familiar with and/or understands the current outlook categories and knows what the outlook categories mean. Changing what people don’t know by heart will likely come with a sense of confusion and questions about why there was a change.

Ultimately, this change should benefit the public, but I don’t think it will. Introducing new categories does not necessarily mean better understanding. As the tables above show, there is a lot that goes into placing a part of the country under a “slight,” “moderate,” or “high” risk. The public doesn’t understand the math behind each of these risks, but the subjective reasoning behind these risks isn’t common knowledge either. What does a “slight” risk really mean for my family? Honestly, meteorologists may disagree on what it takes for the Storm Prediction Center to issue a “slight” risk for severe weather in a given part of the country. If the lines are blurred or slightly blurred in the meteorological community, how will the public understand?

I don’t know of a meteorologist that knows the probability tables above like the back of his or her hand. I also don’t know of a meteorologist that had a complaint about the current SPC severe weather outlooks. There was no outcry to make a change from the meteorological community (at least not one that I knew of).

So why was there a change? The devil is in the details.

Over the years, there have been a lot of severe weather events that have occurred outside or barely inside of “slight” risk areas. A great example of this is the Evansville/Newburgh/Henderson F3 tornado of November 6, 2005. That area was in a 2% tornado risk area (not high enough alone to warrant a SPC “slight” risk) at 6:59pm on the evening of November 5, 2005. At 2am on November 6, 2005, the F3 tornado began near Henderson, Kentucky and continued through Evansville and Newburgh, Indiana. The tornado killed 25 and injured dozens. Outside of Tornado Warnings issued by NWS Paducah, there was really no suggestion from SPC that a deadly tornado would happen that night. This was a big “oops” moment from the Storm Prediction Center. If the severe hail and wind threat were non-existent, this 2% tornado area would have been in a “marginal” risk for severe storms given the new outlook categories coming this fall, and perhaps some would have paid attention to this tornado risk. Placing areas in a “marginal” severe risk may cause more to take the risk for severe weather seriously, but it may also lead to more “false alarms.” How many “marginal” SPC risks with no damage will it take before people ignore them and/or higher severe weather threats?

The names of the categories also bother me. A “marginal” risk downplays the severe weather risk when the potential is there – be it small – for something significant to happen. Also, how is an “enhanced” risk higher than a “slight” risk for severe storms? More importantly, what are the differences in the risk, and do the category names clearly suggest a difference in the severe weather threat? Did the SPC ask the opinion of social scientists to ensure their category naming convention would resonate with the public?

Discussing the severe weather risk categories with the people of Cincinnati on Fountain Square last week made me realize that people want information as simplified as possible when it comes to storms. Many I spoke with didn’t understand the need for SPC to change the categories. Many didn’t understand what “slight,” “moderate,” and “high” risks for severe weather really meant. Many don’t want to try and understand 5 different severe weather categories. Many just want to know how bad the weather is going to be on any given day or how it will impact their daily routine. These conversations reminded me that simple is better when it comes to discussing weather.

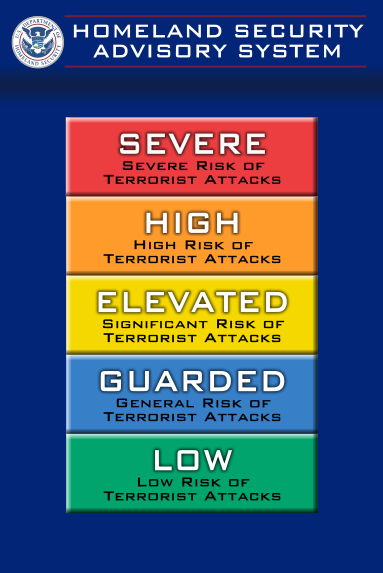
When I think of SPC expanding the severe weather threat categories to five, I think of the Homeland Security Advisory System, which was discontinued in 2011:

HSAS

People never knew what the categories meant, and Secretary of Homeland Security Janet Napolitano said the scale provided “little practical information” when she phased out the scale in 2011. Let’s hope the SPC’s 5-category scale finds more success the DHS’ scale which was uninformative, nondescript, and unhelpful.

Why Tornado Warnings Should Be Issued For Every Tornado

One of the tenets of meteorology is debate. Computer forecast models are consistently at odds with each other about the timing of intensity of weather systems. There are disagreements between meteorologists about the differences between what a mostly sunny, partly cloudy, and partly sunny day looks like. Some weather-related topics, like climate change, are politically charged and constantly challenged.

Of all of the debates I’ve heard, the one that surprises me the most involves when and how the National Weather Service should issue Tornado Warnings. A Tornado Warning is issued when spotters see a tornado, funnel cloud, or rotating wall cloud or when weather radar suggests (or in some cases, confirms) rotation in a thunderstorm is strong enough to produce a tornado. Based on the limitations of technology and the density of the spotter network, many Tornado Warnings do not verify. Radar is a tool designed to track rotation, but radar does not always match what a spotter in the field sees. Some spotter reports are unreliable or misleading, occasionally prompting warnings that did not need to be issued. Even with these considerations, however, the threat of a tornado should not be ignored for any reason. Whether weak or strong, all tornadoes are dangerous.

While there are certain situations and environments which will undoubtedly support and create tornadic thunderstorms, most tornadoes form in far less supportive environments. Most weak tornadoes last on the order of minutes, and larger, upper-level circulations in a tornadic thunderstorm usually don’t last much longer. Many of these weak tornadoes form from thunderstorms in a larger complex of storms. Meteorologists often call these MCSs or QLCSs (mesoscale convective systems or quasi-linear convective systems, respectively). Areas of rotation in a complex of thunderstorms can be hard to see due to the number of storms and given that most tornadoes in a QLCS are short-lived (on the order of minutes).

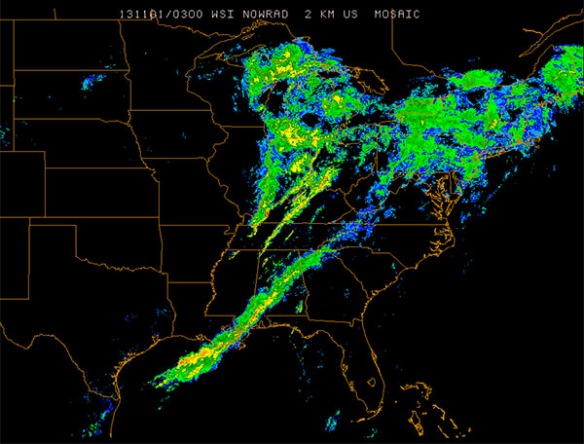
Consider the scenario we had on Halloween night of 2013. Here’s a radar snapshot late in the evening on October 31, 2013:
jun22-qlcs

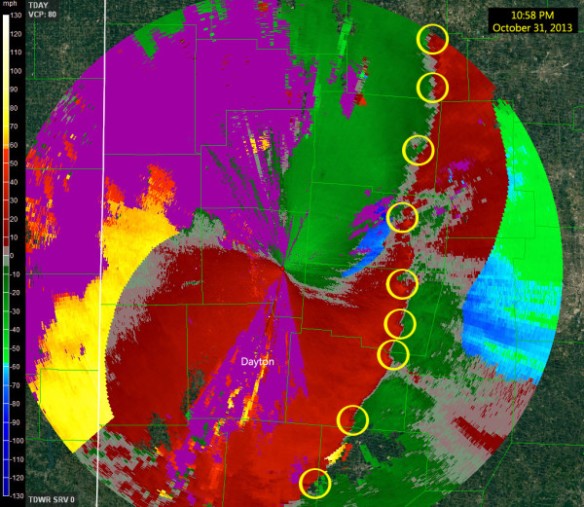
While it is very clear in this imagery that lines of showers and storms look strong and well-defined, using radar imagery some multiple radars is not very helpful for detecting rotation in thunderstorms. Using radial velocity data from a single radar site will be far more helpful for assessing how winds are moving relative to the radar. A snapshot of radial velocity data from the Terminal Doppler Weather Radar near the Dayton International Airport at 10:58pm on October 31, 2013 shows several areas where winds were moving towards and away from the radar in close proximity (circled):
jun22-tdwr

There was adequate support for severe storms and tornadoes (especially weak ones) that night. While instability was not strong, the jet stream, upper-level flow, and upper-level support was. Knowing that that this entire area was in an area where severe storms are possible, which areas of rotation circled in the image require a Tornado Warning? Some couplets (zones of rotation) are stronger than others, but you’d have a lot of false alarms if you issued on every couplet.

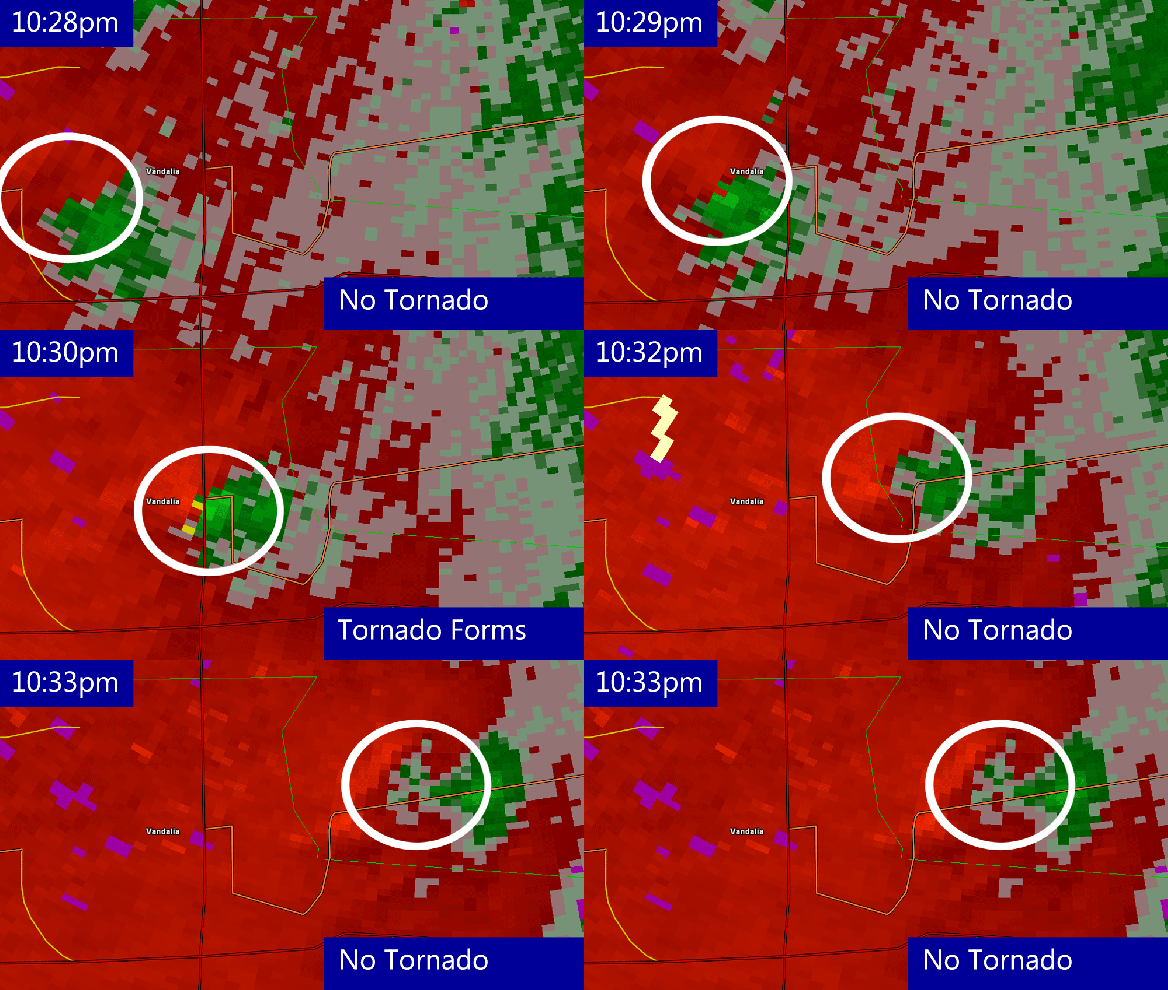
One tornado confirmed that night in the Ohio Valley occurred near Vandalia, Ohio. Even with a radial velocity scan produced by the radar every minute, the rotation the vicinity of the tornado is suddenly strong then suddenly weak in less than 5 minutes:
jun22-vandaliator

Even with high-resolution radar data, it is difficult to warn this community that a tornado is coming. It takes time for the National Weather Service to issue a Tornado Warning. It takes time for the media to break into programming to explain why a Tornado Warning was issued, show which communities are affected, and track the storm. It takes time for people to react and take cover. In this case, by the time all of this happened, the tornado had already dissipated.

While the tornado confirmed near Vandalia, Ohio on the evening of October 31, 2013 did not kill anyone, it injured 8 people. Unfortunately, many Ohio Valley tornadoes have killed people.

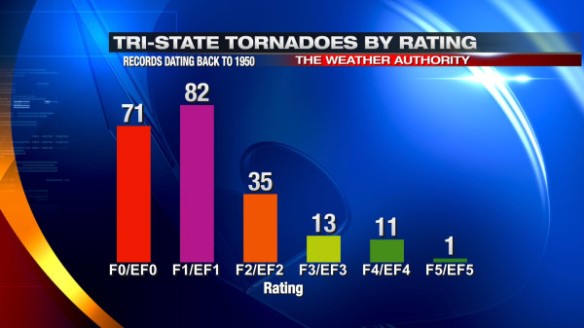
Historically, most tornadoes in the Tri-State since 1950 have been weak, receiving an F0, F1, EF0, or EF1 rating. For the sake of simplicity, I’ll classify “Tri-State tornadoes” as tornadoes since 1950 where any part of the tornado path is in the Tri-State. I’ll also count injuries, deaths, and damage caused by the entire tornado in my calculations even if part or most of these totals occurred outside of the Tri-State; odds are these “boosted” totals will be from stronger, longer-track tornadoes. Most tornadoes that have occurred in the Tri-State, however, began and ended in the Tri-State, so I will allow for this approximation.

The graph below shows that stronger tornadoes in the Tri-State have occurred less often than weaker tornadoes:
jun22-torratings

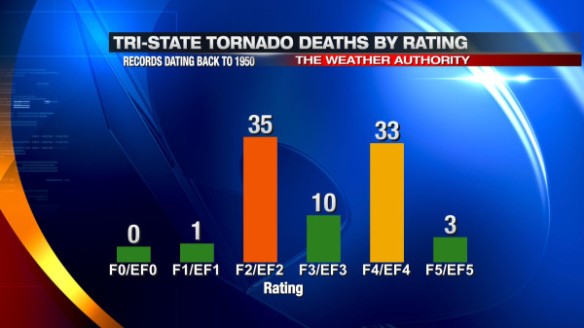
This is no great surprise; stronger tornadoes almost always require strong shear, instability, lift, and moisture. But do Tri-State tornadoes with a higher rating kill more people? Historical records suggest “yes,” but to a point:
jun22-tordeaths

It is important to note that weak tornadoes (tornadoes with an F0, F1, EF0, or EF1 rating) have only killed one person in the Tri-State since 1950, while strong tornadoes (with an F2+ or EF2+ rating) account for roughly 99% of all Tri-State tornado deaths.

I won’t go into great detail about it here, but I believe the spikes in F2/EF2 and F4/EF4 fatalities are more about what, when, and where the tornadoes hit and less about the strength of the tornado.  The time of day, the time of year, population density in the path of the storm, and other factors likely contribute to the “spikes.” The F-scale and EF-scale are two different rating scales, and lumping and EF- and F-scale rated tornadoes into bins may also affect how the graph looks. The point I am highlighting is that stronger tornadoes tend to be killer tornadoes.

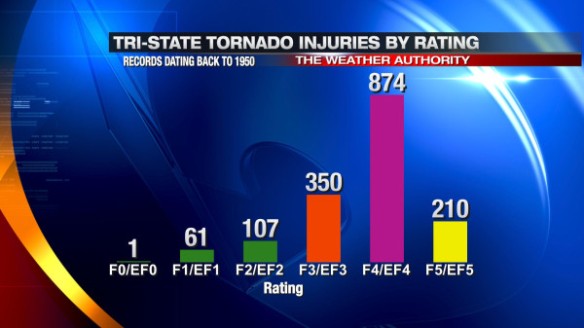
Injuries are more common than deaths with tornadoes, and – locally – more injuries have occurred with stronger tornadoes than with weaker ones:
jun22-torinjuries

There has only been one Tri-State tornado given an F5 or EF5 rating since 1950: the Boone County/Sayler Park tornado on April 3, 1974; this is likely the reason for a large drop in the injury count from F4/EF4 to F5/EF5 tornadoes.

So why issue Tornado Warnings for weaker tornadoes if they kill and injure fewer than F2/EF2+ rated tornadoes? If this were the case, fewer Tornado Warnings issued would lead to a lower false alarm rate, and fewer people would ignore Tornado Warnings. Why not just worry about the big tornadoes and ignore the small ones?

There are two big reasons. Here is the first:

jun22-nwsmission

The Mission of the National Weather Service is to protect “life and property.” While protecting lives is of utmost importance, the Mission Statement also includes the words “and property.” The warnings that come from the National Weather Service and the tracking and alerting that broadcast meteorologists do is all in an effort to protect you and what you own. Regardless of whether they work for the NWS, in the media, academia, or the the private sector, meteorologists – as a whole – are committed to the NWS’ mission.

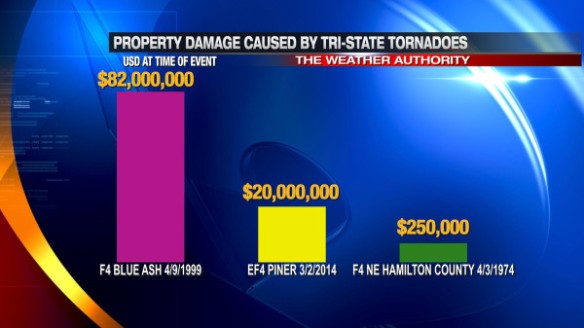
Some of the strongest tornadoes that have ever occurred in the Tri-State caused thousands if not millions of dollars in damage:
jun22-tordamages

Even weak tornadoes can cause hundreds of thousands of dollars in damage. An F1 tornado in Dearborn County in the early morning hours of April 9, 1999 caused an estimated $250,000 (in USD at the time) worth of damage. Should we – the weather community – inform viewers when there’s an imminent threat of a tornado, regardless of whether it will injure people, kill people, or cause damage? Absolutely. People deserve the right to know what is coming for their them. Should the National Weather Service not issue a Flash Flood Warning if it will only cause homes to be damaged but not kill anyone? Should a broadcast meteorologist only cover a winter storm if it has the potential to be life threatening? Should meteorologist in the private sector only create a product or service that prevents injuries but doesn’t work to prevent deaths? The answer to all of these question is a resounding “NO.”

The second – and just as important – point is that discerning weak from strong tornadoes isn’t easily done in real-time. Despite incredible improvements in technology in the last 50 years, there will always be limitations to what a radar and spotter network can give a meteorologist. Radar doesn’t scan at the ground, and there will always be cases where a radar sees strong circulation but there is no tornado. Spotters are important for being the “ground truth” in the field, but spotters are not everywhere. Spotters can report a tornado and/or describe it, and radar can – in some cases – confirm a damaging tornado in progress. This, unfortunately, is where radar and spotters reach their maximum effectiveness.

Spotters and radar can’t rate a tornado. The EF-scale is based off of damage. In order for a tornado to get an EF rating, a National Weather Service survey team must survey the damage. Books and binders worth of documentation are often brought to the scene damage site so that the National Weather Service can compare what they see to a specific set of guidelines and give the tornado a rating. These surveys can take hours or even days.

As time goes on, we will learn more about how tornadoes form, how they dissipate, their environments, how to track them, and how to detect them with more accuracy. We will not, however, gain the ability to rate tornadoes on the EF scale in real-time. In other words, trying to rate a tornado as it cuts through a community is not worth our time. If we can’t definitively predict the rating of a tornado in real-time, why should we attempt to gauge which tornadoes will kill or injure people and which ones won’t? This is a dangerous game with no winners.

Tornado Warnings were created to warn those in the path that a tornado is imminent. Whether a tornado is radar indicated or confirmed by a spotter in the field, the threat for a tornado is real when a Tornado Warning is in effect. Some tornadoes will cause damage; others will kill and injure people. A meteorologist’s job is to warn, prepare, and educate. Daring to guess which storms will play nice and which ones won’t is best left to those who create the weather instead of forecasting it.

A Personal Reflection Of The April 9, 1999 Tornadoes

It was the loudest thunderstorm I’ve ever heard in my life.

There was a cadence of thunder. Lightning resembled a strobe light. The lightning and thunder was so intense that you couldn’t sleep through it if you tried. It didn’t last a minute; it lasted 10 minutes. It wasn’t constant thunder and lightning; it was loud, bright, and constant. Based on the thunder and lightning alone, you knew something was wrong. And there was.

I woke up the next morning really not remembering what had happened hours ago. Sun was coming through the window, and the storms had moved out by 7am when I woke up. Sycamore Schools had been called off, and I remember hearing it on my alarm radio. Family members called asking if we were okay. There were tree branches down in my area, but there was nothing suspicious going on outside. I remember wondering who had moved our gas grill to the other side of the deck that morning; no human moved it.
It was clear once the TV was on that there was extensive damage on the other side of Blue Ash. It was likely a tornado based on the severity of the damage, but it was not confirmed at that point.

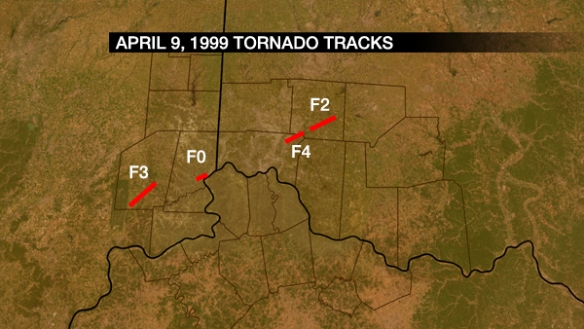
There 5 tornadoes in the Tri-State in the early morning hours of April 9, 1999. The map below shows 4 of them; an F1 tornado near Addyston is not shown:

apr9-tornadotracks

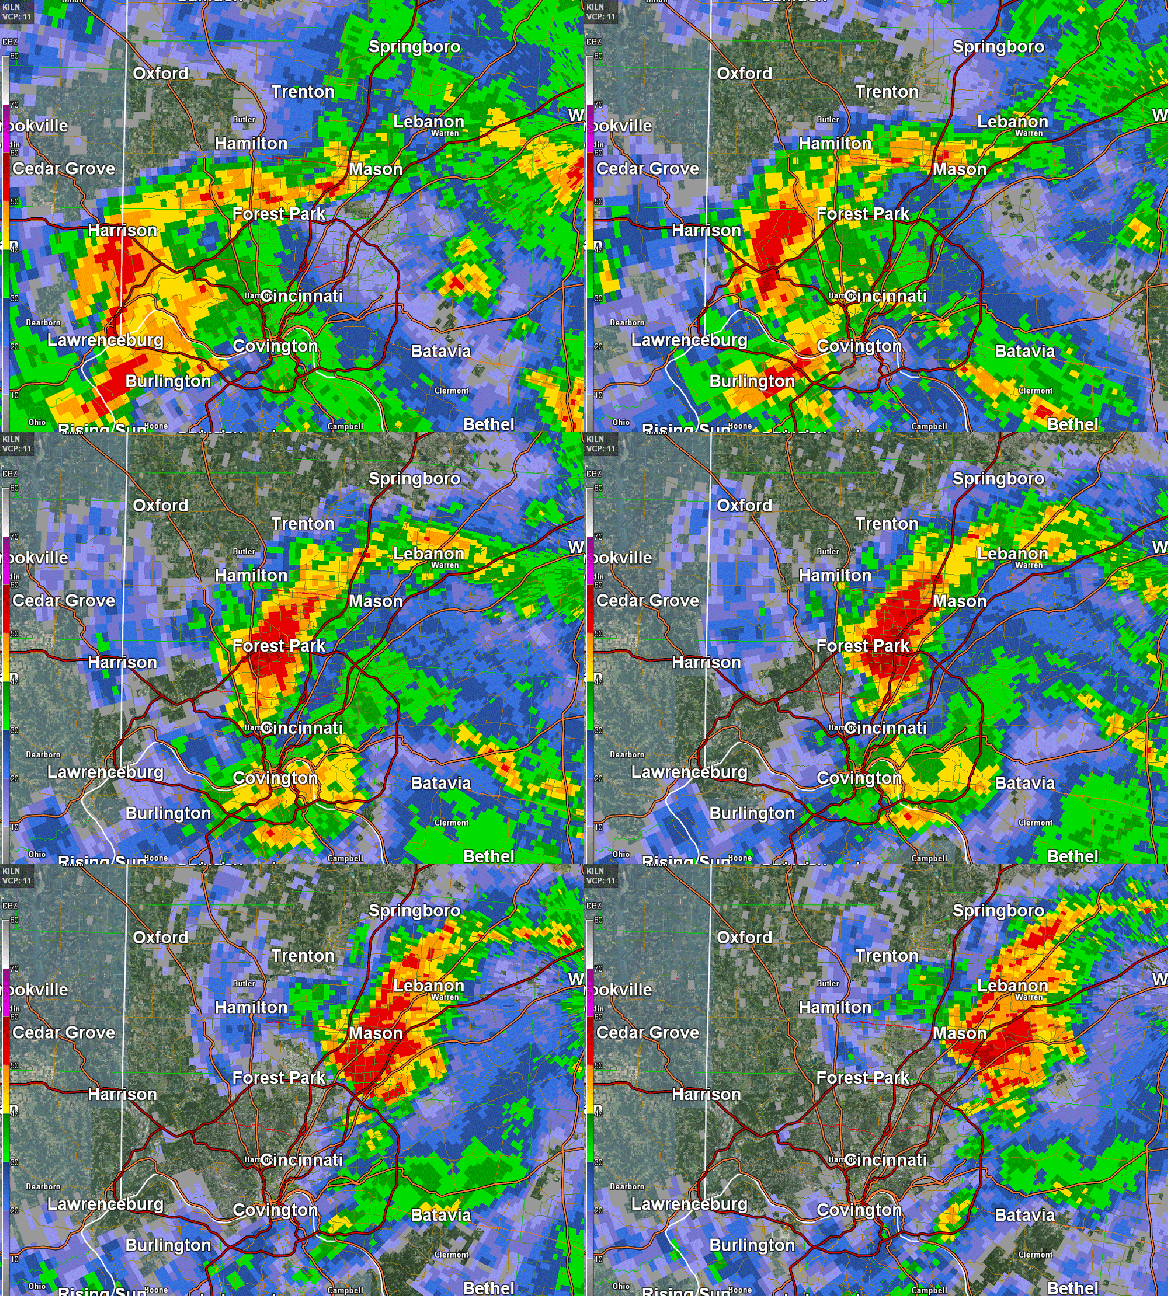
A pair of thunderstorms were out to make trouble that night. One storm created two tornadoes in southeastern Indiana. Another caused damage in northeastern Hamilton County and southern Warren County. While the southern storm started strong, the northern storm would win out and cause the most damage that morning:

april9

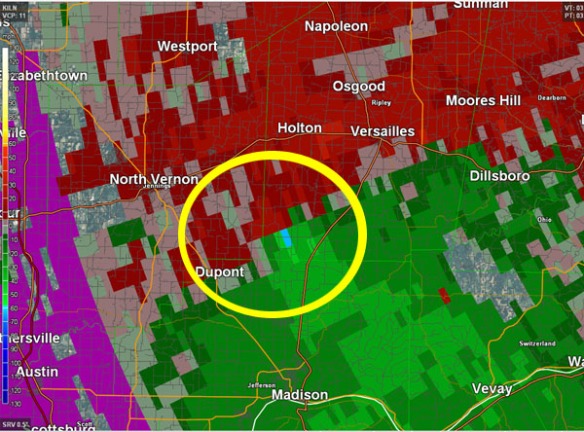
The first tornado of the night was an F3 in Ripley County, touching down near the Big Oaks Refuge and dissipating before it moved in Dearborn County. The storm relative velocity product showed strong inbound and outbound motion (in green/blue and red, respectively) in southern Ripley County just before 4am on April 9, 1999; the storm-relative velocity product is essentially the raw radar velocity product with the motion of the storm subtracted out.

apr9-ripley

While this tornado was significant and killed 3 people, a much larger, powerful tornado would develop less than one hour later from a separate thunderstorm.

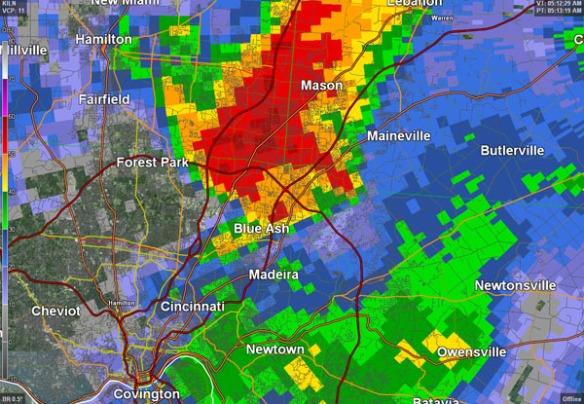
The 5:12am radar scan that night from the National Weather Service in Wilmington showed the classic “hook echo” forming just west of I-71:

apr9-refl

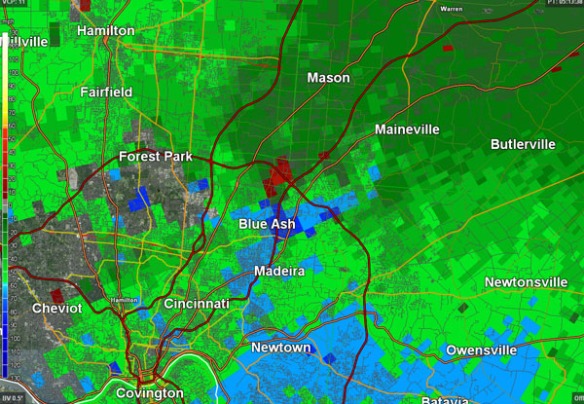
The radar velocity scan showed intense rotation near Blue Ash at that same time. Blue colors in the image below show strong winds moving towards the radar, and red colors show winds moving away from the radar; the tornado is very close to where these colors meet:

apr9-velocity

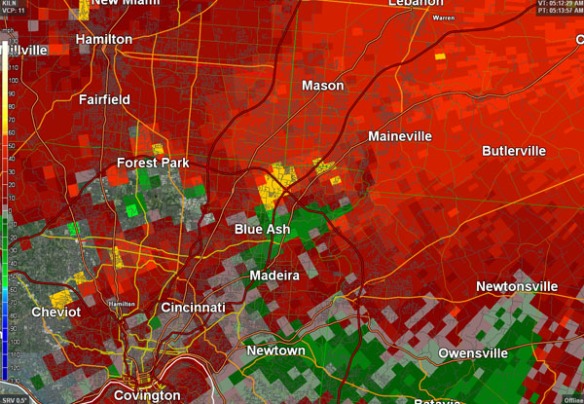
The storm-relative velocity scan at 5:12am below shows the rotation as well:

apr-srm

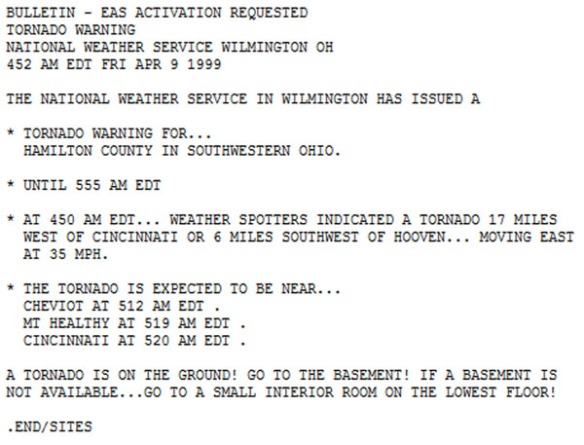
4 people were killed and 65 were injured as a result of the Blue Ash/Montgomery/Symmes Township tornado on April 9, 1999. More likely would have been killed or injured from this tornado had it not been for reports of a tornado and damage from trained weather spotters in Ripley and Dearborn County. This report was received by the National Weather Service at a critical, warning decision making time. The Tornado Warning issued for Hamilton County in the early morning hours of April 9, 1999 acknowledges a report of a tornado in southeastern Indiana minutes before Hamilton County was put under the warning.

apr9-warning

These spotters saved lives that night.

There have only been 11 tornadoes in the Tri-State since 1950 to be classified as a violent tornado (given a rating of F4, F5, EF4, or EF5). The tornado that hit Blue Ash, Montgomery, and Symmes Township was one them. These communities had roughly 30 minutes of warning lead time to take cover, but this warning occurred on a night where the severe weather threat was not excessively high. Two Tornado Watch boxes were issued for the Tri-State that night, but there was no imminent threat of a tornado during the late local news. Most went to bed hours before the hours not expecting a tornado to crash into their house. The Internet was not used like it is today, and NOAA Weather Radios were not used as often. After seeing the damage firsthand, it is surprising that more weren’t killed or injured.

The event was also a game changer for how storms were covered by local TV stations. While tornado coverage was there, it revitalized the sense of urgency that storms bring. The loss of life that morning changed TV severe weather policies and how storms were tracked and covered.

With the tornadoes from April 9, 1999 included in the count, April is the most common month for tornadoes in the Tri-State (41 in total since 1950).

April 9, 1999 reminds us that tornadoes can and do strike how and when they want. They don’t wait until the sun comes up, and they don’t discriminate. Nighttime tornadoes are dangerous, and they are among the deadliest types of tornadoes because they cause damage when people are most vulnerable. Lessons were learned that morning 15 years ago; my hope is that we are better prepared for the next round of storms.

Reflections On Recent Tornadoes And Lessons Learned

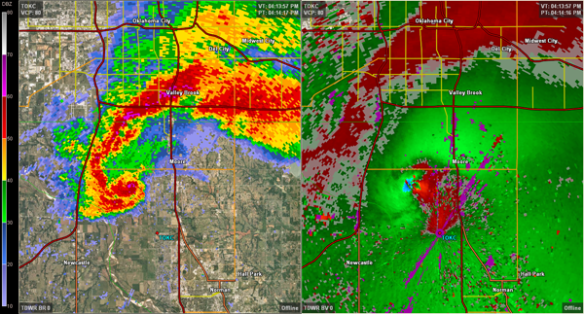
For the last two weeks, it seems there has been an endless stream of stories about storm damage and tornadoes in Oklahoma. First, tornadoes cut through central and northeastern Oklahoma on May 19th. Second, it was the EF5 tornado that hit Moore, Oklahoma on May 20th; a debris ball and intense rotation could be seen on radar long before the storm hit Moore:

okc

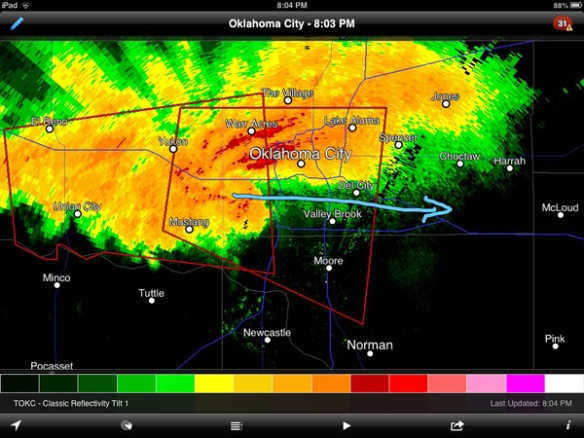
Third, there was a large tornadic, supercell thunderstorm approaching Oklahoma City on May 31st. Several tornadoes were confirmed from this cyclic thunderstorm, and 80+ mph rear-flank downdraft winds blasted southern Oklahoma City and northern Moore:

okc2

The May 20th tornado killed 24 people, and the death toll has not been solidified for the May 31st storms.

While it is horrible to hear of any tornado-related deaths, deaths in EF-5 tornadoes are common. Given span of the debris field, the timing of the day, the length and width of the tornado (17 miles, and a maximum of 1.3 miles, respectively), and the path of the tornado (through a medium to large-sized city), the death toll in and around Moore easily could have been much higher. Advanced warning from the media and the National Weather Service likely saved dozens of lives.

Preliminary assessments from the National Weather Service in Norman, Oklahoma suggest the tornadoes that hit Oklahoma City and surrounding areas on May 31st were weaker overall but were still deadly. Many of the deaths that day could have easily been prevented.

Tragically, legendary Tim Samaras, his son Paul Samaras, and longtime chase partner Carl Young were killed in the EF-3 tornado that hit El Reno, Oklahoma on Friday. More information on the death of these three storm chasers from 7NEWS in Denver is here: http://bit.ly/11xAcZ4

Mike Bettes, a meteorologist at The Weather Channel, and his crew were injured when their car was damaged by one of the tornadoes on May 31st. More information (including a photo of the damaged car) from the AP via WPTV-TV is here: http://bit.ly/ZmKWx1

Personally, I was more surprised to hear of these storm chaser/meteorologist injuries and deaths on May 31st more than the injuries and deaths in the Moore tornado on May 20th. When a major tornado hits a city with 55,000+ residents, there will almost certainly be injuries and deaths. Some who take shelter but not underground will get killed and/or injured when a tornado is that strong.

While it is important to tend to injuries and remember the lives of those who are killed in storms, there are few if any reasons why a storm chaser or meteorologist should be killed by a tornado. Storm chasers – especially those who are meteorologists – should know the level of danger in and especially around thunderstorms. If they don’t know the danger, they should keep more than enough distance or they shouldn’t be chasing at all. Those with limited or no training or experience should not go chasing potentially violent tornadoes, just as those with limited or no medical training should not be in charge of large-scale safety operations. The “Particularly Dangerous Situation” Tornado Watch in effect before tornadoes hit the Oklahoma City area on May 31st made it very clear that intense tornadoes were possible that afternoon and evening: http://1.usa.gov/11bxp7S. Reports of multi-vortex tornadoes in the area should have been a clear sign that tornadoes may dissipate and develop quickly, including overhead and away from where they were looking. Reports on Twitter Friday night suggested that at least one OKC meteorologist told people to drive away from the projected path of the tornadoes and that roads were clogged by these evacuees and storm chasers. People caught in traffic and not able to escape with a tornado approaching a recipe for disaster.

May 31st serves as a reminder that dangerous storms are dangerous. Experience and training may help someone get closer to a storm or know how to escape if needed, but there will always be cases where experience and training won’t help or save you. Unfortunately, storms can some and sometimes claim lives, including those who think they can outwit them.

This cat and mouse game has to stop. When meteorologists and storms chasers are getting injured and killed, we need to reconsider storm chasing policies and behavior. The risk of getting killed and watching our friends, loved ones, and colleagues get killed is not worth the risk of sampling the winds in or getting a picture of a tornado. Storms aren’t going to change the way they do what they do; it is up to us to make a change.

Remembering The April 3, 1974 Super Outbreak

Unless you’ve recently moved to the Tri-State, the words “March 2nd” probably trigger thoughts of tornadoes and severe weather. If you’re a long-time resident of the Tri-State, you’ll likely remember where you were on April 3, 1974. Often coined the “Super Outbreak,” April 3, 1974 was the date of the one of the biggest tornado outbreaks on record in this country and in the Cincinnati area.

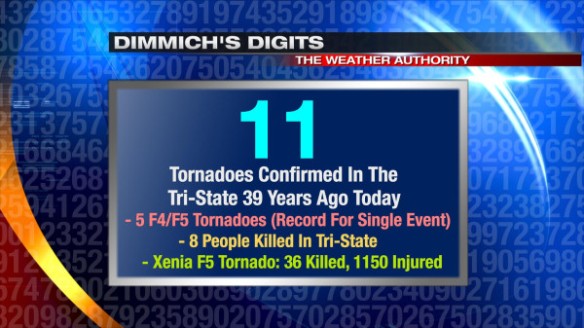
11 tornadoes affected the Tri-State that day, killing 8 and injuring dozens. While it no longer stands as the deadliest severe weather day in the Tri-State on record (10 Tri-State deaths are blamed on the March 2nd, 2012 tornadoes), 5 violent (F4/F5) tornadoes occurred in Tri-State on April 3, 1974 (the most for a single event):

apr3-digits

Note that one of the strongest tornadoes that day was also the deadliest, killing 36 and injuring over 1,150 people in Greene and Clark County, Ohio.

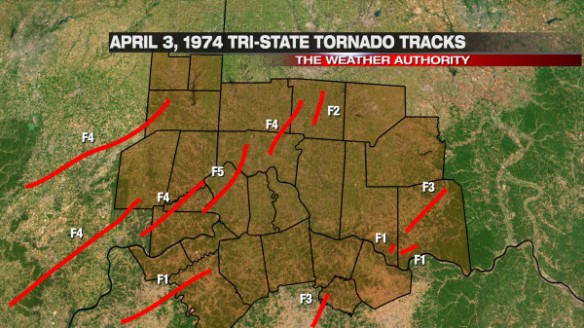
Locally, April 3, 1974 is often remembered for the Sayler Park tornado…a rare F5 that killed 3 people in Hamilton County. This is the only F5 or EF5 tornadoe confirmed in the Tri-State since official records began in 1950. While the Sayler Park tornado was the deadliest tornado in the Tri-State that day, there were numerous other strong tornadoes in the Tri-State on April 3, 1974:

apr3-tornadotracks

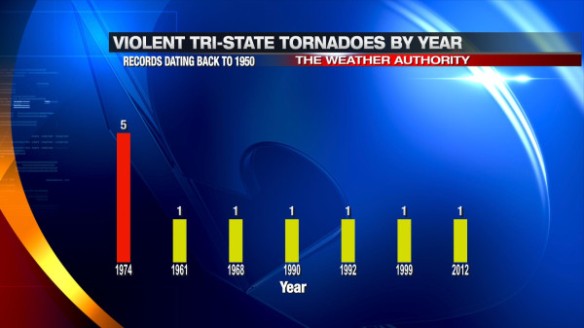
Violent (F4/F5/EF4/EF5) tornadoes are rare in the Tri-State. The April 3, 1974 Super Outbreak is the only severe weather event since 1950 to produce more than 1 violent tornado:

apr3-violentbyyear

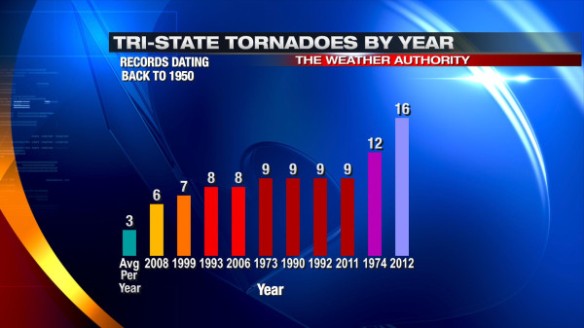
Until the March 2, 2012 outbreak, the outbreak of April 3, 1974 held the record for the most tornadoes locally in a single day. Outside of April 3rd, only one other tornado was confirmed in the Tri-State in 1974. 1974 currently takes 2nd place on the list for the most number of tornadoes in the Tri-State and in a single year:

apr3-torbyyear

What are your memories of the April 3, 1974 Super Outbreak? Were you in Cincinnati? Did you see any of the tornadoes that day? Please leave your memories in the comment section of this blog or on social media (“Meteorologist Scott Dimmich” on Facebook, @ScottDimmich on Twitter, and as “Scott Dimmich” on Google+).

Remembering The March 2, 2012 Tornado Outbreak

I remember the Blue Ash/Montgomery/Symmes Township tornado on April 9, 1999. I was in Blue Ash that night, and it was the loudest thunderstorm I had ever heard in my life. My home was not hit, but nearby friends’ homes were. In the days after that tornado, I helped clear debris, collect belongings, and provided a shoulder to cry on if needed. The damage was intense, but localized; you can still see evidence from the tornado if you look carefully at the trees across the street from Sycamore High School. That tornado is a big reason why I am a meteorologist today.

Before returning to Cincinnati, I tracked numerous severe thunderstorms and tornadoes in the Ohio Valley. I had been in numerous Storm Prediction Center “moderate” or “high” risks before. While last winter was abnormally warm, it wasn’t unusually stormy. Rain would come and go, and there was little to no snow. At the time, I remember meteorologists in this area joking about how boring the weather pattern was.

On the Monday before Friday, March 2nd, 2012, I was working the morning shift, and I noted the risk for strong and severe storms on Friday. Before March 2nd, there were other severe weather threats to our south and west. With a slight risk of severe weather (as forecast by the Storm Prediction Center) in place, an EF4 tornado hit Harrisburg, Illinois in the middle of the night on February 4th. News of this violent tornado in late February was – frankly – bit surprising given NWS and SPC forecasts; it also had me on edge regarding the forecast for March 2nd. Where forecast models handling everything correctly? As the week went on, the threat for severe weather on Friday increased in the Ohio Valley, but I remember forecast models keeping a focus for severe weather centered over southwestern Indiana, western Kentucky, and Illinois…in areas that had been hit hard by storms earlier in the week.

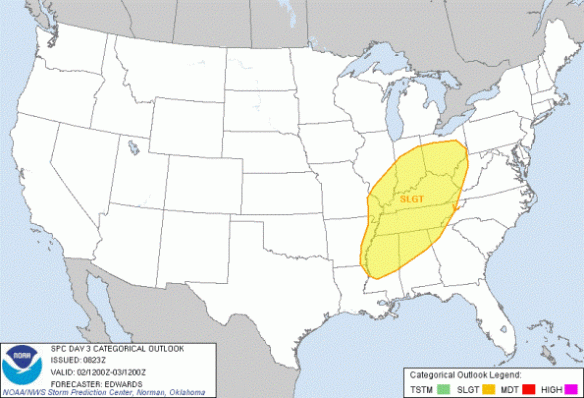
On the February 29th, 2012, the Storm Prediction Center had the entire Tri-State in a slight risk for severe storms and mentioning a threat for tornadoes:

day3

In the early morning hours of March 1, 2012, the Storm Prediction Center upgraded the Tri-State to a moderate risk and mentioned a threat for “long track” and “strong” tornadoes:

day2

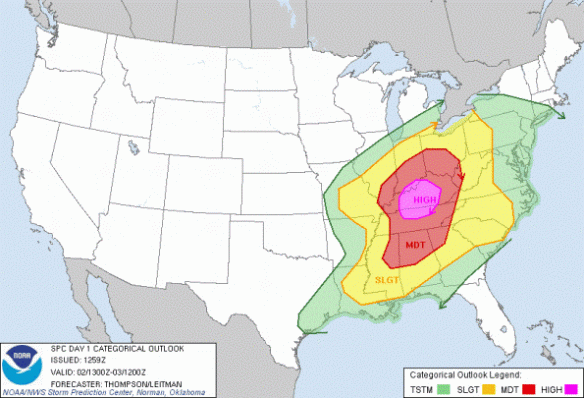
The Ohio Valley remained under a moderate risk until 7:58am eastern time on March 2. At 7:59am, parts of the Ohio Valley were placed in a rare Storm Prediction Center high risk, but the Tri-State was not included yet:

day1-1

I remember setting my alarm for 7:45am on March 2nd just to see if the Storm Prediction Center would put us in a high risk. They didn’t at 7:59am, so I went back to bed for a couple of hours.

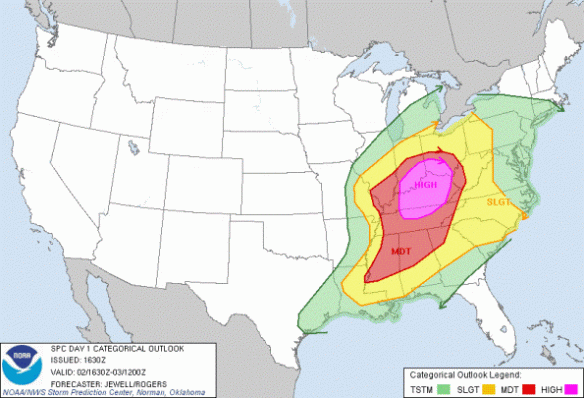
By 10:30am, I was back awake, and watched as the Storm Prediction Center put the Tri-State in a “high risk”, suggesting that long-track and potentially violent tornadoes were imminent:

day1-2

I was into work shortly thereafter. Until about 1:00pm in the afternoon, it was a “waiting game.” No supercells had popped up in our area, but we knew the powerkeg was about to blow. High-resolution models suggested rotating storms and supercells were going to explode in the afternoon, but they disagreed on exactly where. Between and 1 and 2pm, Tim Hedrick and I watched as three different supercells blew up in southwestern Indiana over the span of two counties in less than 15 minutes. When Tim says, “I’ve never seen supercells go up on radar that quick near here. Ever.” you believe him. In 20 minutes, Dubois and Perry County Indiana went from having just cumulus clouds to tornadoes.

A lot of the suspense about what was going to happen and where was resolved by 2:30pm in the afternoon; supercells in southern Indiana were producing damage, and there were numerous indications from spotters that the damage was extensive and the tornadoes were strong or violent. As a meteorologist, I knew there was a chance for this to happen, but until it had been confirmed, the magnitude of this event didn’t really hit me.

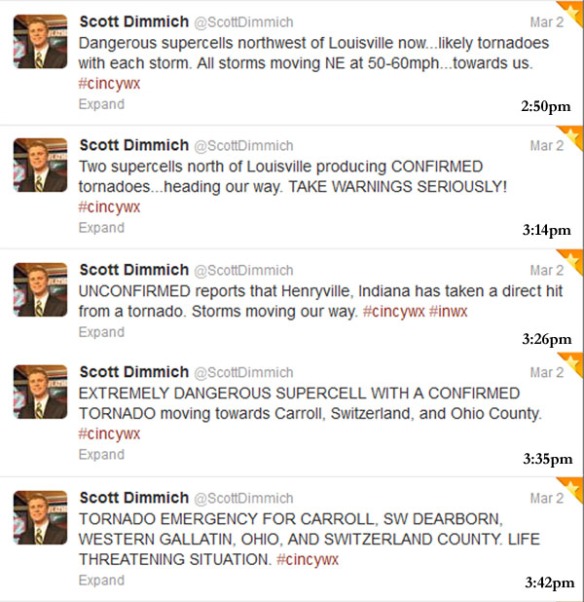
Between 2:30 and 3:30pm, we were just waiting for the worst. My tweets from to 2:30pm to 3:45pm became more and more urgent:

twitter3212

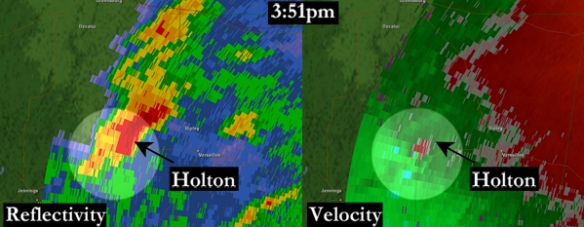
There were reports of tornadoes with the two supercells rolling up I-71, but the focus had to be turned to Ripley County suddenly as a supercell in Jennings County, Indiana pushed east. This cell would produce a EF-3 tornado and kill two in Holton:

TCVGholtonZandV2

Thankfully, the storm that produced a tornado in Ripley County would quickly die, but this event was just beginning for northern Kentucky and southwestern Ohio. While reports of tornadoes and funnel clouds came in from Carroll, Gallatin, and Owen County, the rotation in the northernmost supercell tightened quickly. The first, second, and only Tornado Emergencies ever issued by the National Weather Service in Wilmington were issued for this cell. Looking back at our severe weather coverage, I noticed my hand and the warning printout I was holding were shaking as I announced the first Tornado Emergency on the air. A family friend of mine several weeks later called me out on my hand shaking. She told me that was her first indication from me that this was going to be bad event.

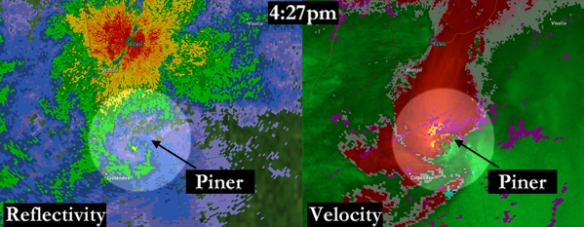
By the time the storm was in southern Boone and Campbell County, damage was already being done; some of the debris from the violent EF-4 tornado in Piner/Crittenden could be seen on the FAA Doppler radar in southern Kenton County just before 4:30pm:

pinertdwrZandV-ZandVshaded

At first, the debris ball (shown at the end of the hook echo in the left side of the above image) wasn’t apparent. Data were only available from the FAA radar every 6 minutes on March 2, 2012, so word of the debris ball first came from the National Weather Service in Wilmington (who could see the radar data every minute). This debris ball on radar was the second sign to me (once storms were in the viewing area) that this would likely be a deadly and historic event. In the over 20 years I’ve lived in Cincinnati, I had never heard of or seen a debris ball on a local radar.

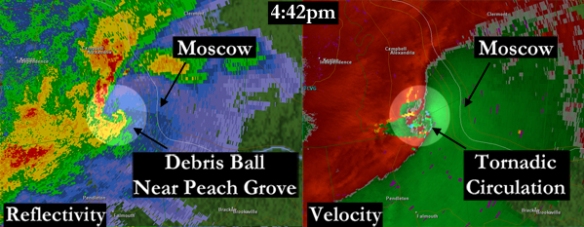
A second debris ball showed up on the FAA Doppler radar in southern Campbell County as the northernmost supercell hit Peach Grove, Kentucky:

peachgrovetcvgZandVwithmoscow

This storm went on to hit Moscow and Hamersville, Ohio, producing EF-3 damage and killing 3. Initially, this report of damage in Moscow was delayed; I remember it was at least 20 minutes between Moscow was hit and when we first heard about the damage.

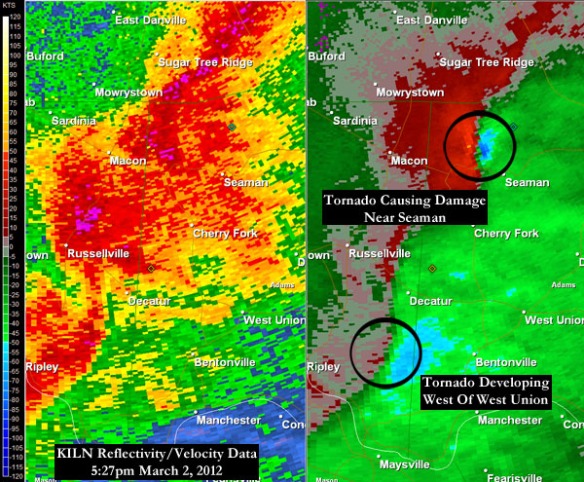
After the tornado had caused damage in Moscow, fatigue began to become a factor. We had been on the air for more than two hours and reports of damage were coming in every couple of minutes. There was no time to be tired, though. 4 more tornadoes would occur after the damage in Moscow, including an EF-1 in Seaman, Ohio and two tornadoes near West Union. The rotation from each supercell in Adams County could easily be seen from NWS Wilmington’s radar just before 5:30pm:

mar1-seamanwestuniontor

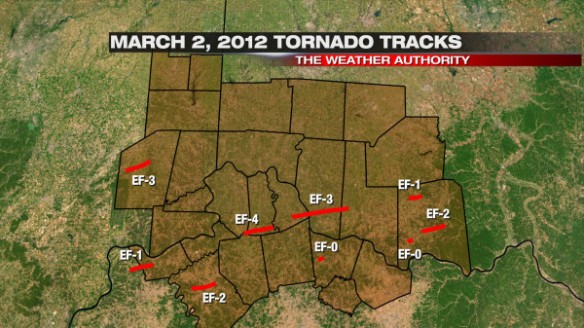
By sunset, 9 tornadoes had raked across the Tri-State, and 3 of them were major tornadoes (given a EF-3 or greater rating):

mar1-tortracks

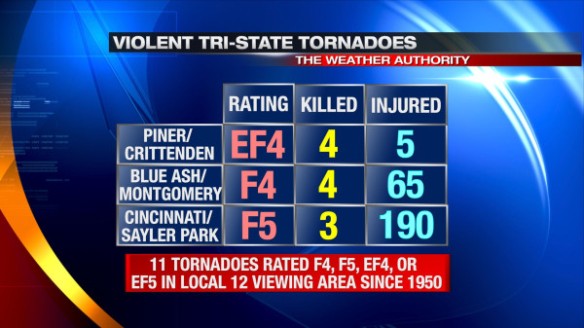
Originally, the Piner/Crittenden tornado was given an EF-3 rating; on the Friday after the outbreak, the National Weather Service upgraded the tornado to an EF-4. The Piner/Crittenden was only the 11th tornado in the Tri-State since 1950 to be classified as a violent tornado:

mar1-violenttors

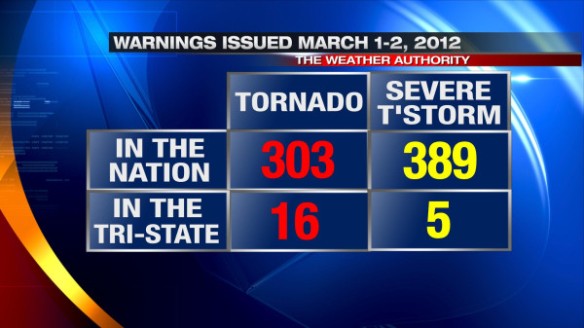
16 Tornado Warnings and 5 Severe Thunderstorm Warnings were issued for the Tri-State on March 2nd, 2012. While this is a large number of warnings in our area on one day, it is a small fraction of the number of Tornado and Severe Thunderstorm Warnings issued in the entire country on March 1-2, 2012:

mar1-mar2warnings

After looking through the data, there are three things that stand out to me about the tornado outbreak of March 2, 2012. For the first time ever, the National Weather Service issued a Tornado Emergency for our area (not once, but twice). A Tornado Emergency is issued when a large, confirmed tornado threatens a highly populated area. Second, three major tornadoes were confirmed in the event. The last time 3 major tornadoes were confirmed in our area on the same day before March 2, 2012 was on April 3, 1974. Lastly, March 2, 2012 now stands as the deadliest severe weather day in the Tri-State since official NWS records began in 1950.

There is no doubt that this was the biggest event of my career so far and likely will be for the rest of my life. I still get emotional thinking about March 2, 2012. As a meteorologist, you do all you can do to get the word out about severe weather in the days and hours leading up to the event; when anyone dies on your watch, you take it personally and you wonder if you could have done more. I hope that something like what happened on March 2, 2012 in this area never happens again; unfortunately, events like these have happened and will happen again in time.

Remembering The Great Blizzard Of 1978

The winters of 1976-1977 and 1977-1978 were among the worst the Tri-State has ever seen. In January 1978, 31.5″ of snow fell in Cincinnati, the most amount of snow in a single month since official records began in November 1870. The second snowiest month on record was January 1977, when 30.3″ of snow fell. With an average temperature of only 11.5°, January 1977 was also the coldest month on record in the Queen City.

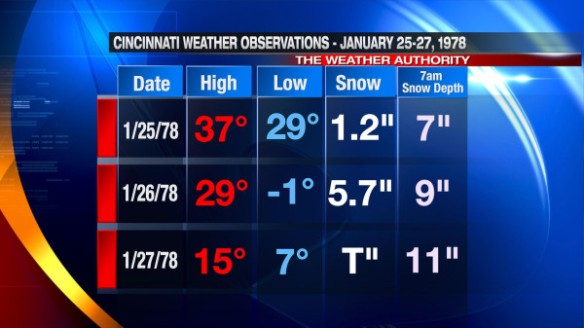
Part of January 1978’s large snow total fell between January 25 and January 27 during what many call the “Great Blizzard of 1978″; daily weather records taken at the Cincinnati/Northern Kentucky International Airport show 6.9” of snow fell in those 3 days:

jan24-blizzarddaily

The snow depth of 11″ on January 27, 1978 ranks as the 24th (tie) largest early morning snow depth in Cincinnati on record; the all-time record early morning snow depth in Cincinnati is 15″ set on both January 15 and 16, 2010.

Blizzard is not defined by how much snow falls but instead by the visibility and wind. A blizzard occurs when the follow criteria are met:

– There are sustained, frequent gusts over 35mph
– Blowing or drifting snow causes the visibility to drop below 1/4 of a mile
– Both of the previous two conditions are met for at least 3 hours

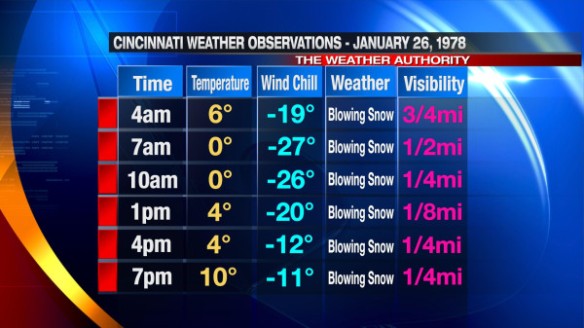
While the snow amounts were impressive during the Blizzard of 1978, the wind speeds, temperatures, visibilities, and duration of blowing and drifting snow was a bigger story. Here are some of the weather observations taken at the Cincinnati/Northern Kentucky International Airport on January 26, 1978:

jan24-jan26blizzardobs

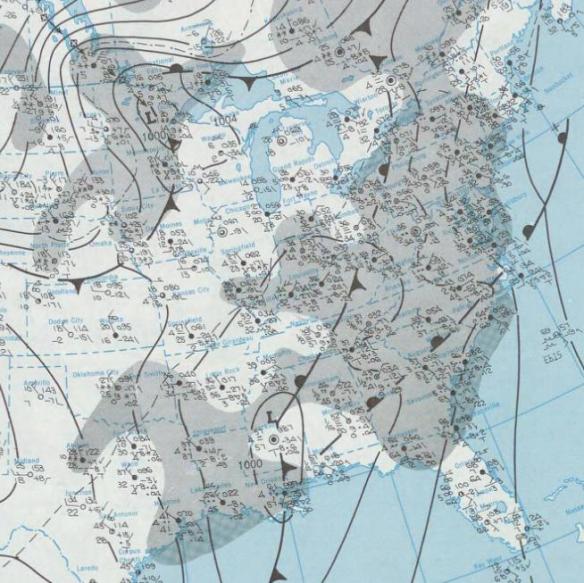
The official early morning surface map on January 25, 1978 from the National Weather Service showed two areas of low pressure in the eastern 2/3rds of the nation; the one closest to the Gulf of Mexico would rapidly intensify 24 hours later:

jan251978sfc

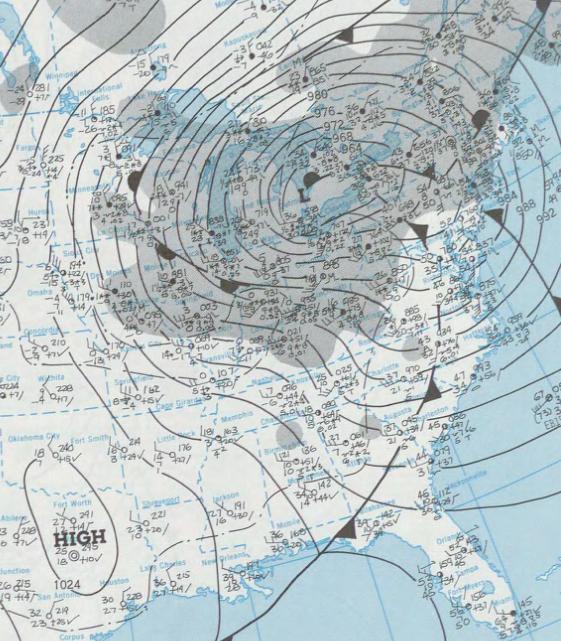
On the morning of January 26, 1978, that area of low pressure was centered near Detroit. This low was among the strongest ever recorded in the United States for a non-tropical system:
jan261978sfc

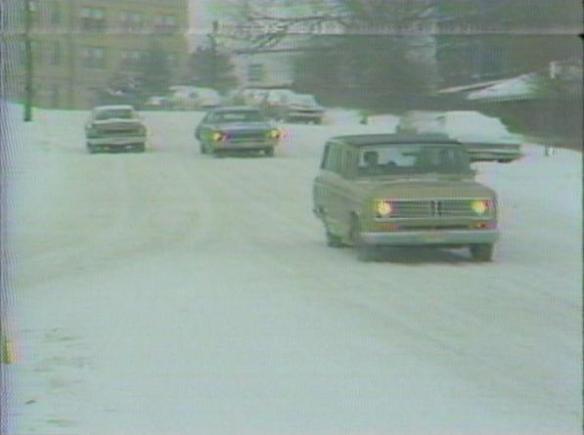
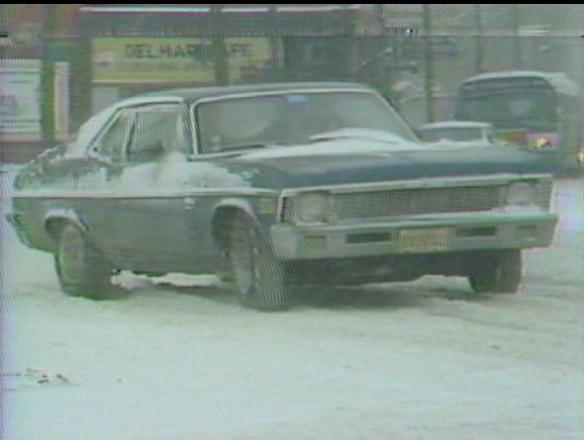
What did the blizzard look like? Here are some snapshots on January 26, 1978 from the WKRC-TV video archive (shot on 3/4″ tape):

blizzard1978-1

blizzard1978-2

In 1998, the National Weather Service forecast office in Wilmington released a statement that gives perspective on the Great Blizzard of 1978 in Cincinnati: http://www.erh.noaa.gov/iln/PSACVG.htm

The National Weather Service also released a statement putting the blizzard in perspective for Dayton and Columbus. The links to each statement are linked here, respectively: http://www.erh.noaa.gov/iln/PSADAY.htm, http://www.erh.noaa.gov/iln/PSACMH.htm.
What were your memories of the Great Blizzard of 1978?