Rain Showers Today, Snow Showers Thursday

Scattered showers are forecast through the lunch hour. Regional radar shows rain showers moving from west to east through the Tri-State:

jan3-11amradar

Notice the break in showers over west-central Indiana. That break is over the Tri-State by mid-afternoon, but the area of rain showers in Illinois will overspread the Tri-State late in the business day and this evening. The amount of lift in the atmosphere is increasing to the west, so plan for more showers later today and tonight after a brief break this afternoon.

It’s warm outside! As of 11am, temperatures are in the 50s:

dec13-11atemps

Temperatures will be gradually falling through the 50s this afternoon with showers favored early and late:

jan3-afternoon

Showers will continue this evening as temperatures fall through the 40s:

jan3-evening

Showers will diminish late tonight, briefly mixing with flurries, especially northwest of Cincinnati:

jan3-overnight

Notice the quicker fall in temperatures late tonight compared to this evening! We’ll start Wednesday in the upper 20s and low 30s. Little if any warm up is forecast Wednesday, even with decreasing clouds:

jan3-wednesday

Wednesday will be a much colder and breezy day. The next wave of precipitation (Thursday) will be in the form of snow showers. Models are getting more aggressive with the strength of this wave, so up to 1″ of snow is forecast Thursday:

jan3-snowfall

Notice that no Tri-State community is favored for more or less snow. Snow showers implies snow that starts and stops. Here is a summary of late week impacts:

jan3-screaming

Snow showers will increase in coverage Thursday morning, decrease in coverage late Thursday, and cold air will plunge into the Ohio Valley behind this wave. Lows will be in the low to mid teens and highs will be in the mid to upper 20s Friday through Sunday.

Snow squalls are unlikely Thursday, but there will be drops in visiblity underneath snow showers.

An Annual Reminder: Think Before You Share Weather Posts

While the courtesy applies to any time of the year, the courtesy of “thinking before you sharing weather-related posts” especially applies to the colder months of the year.

As a meteorologist, I look at a look of computer forecast model data daily. This is often referred to as “guidance” for a reason; these models are designed to “guide” the decisions of meteorologists while making a forecast. Sometimes the guidance is wrong, and sometimes it is right. Sometimes one model will propose one solution, and other model will have a different idea of how the weather will change.

You may have seen some of this guidance without even knowing it. If you see a map of snowfall totals that doesn’t look like a human being created it, that’s likely computer model guidance. It’s raw computer output, so it’s not a forecast. That one computer forecast model may look very different from the model run before it or different types of computer forecast models. But all you likely see in that social media post is what one model at one time thought. It may not be current; it may be a map saved from years ago and just re-posted.

Sometimes the maps you see are created by a human, but not by a meteorologist or someone with years of forecasting experience. For example, someone messaged me this screenshot from the other day on Facebook asking if it was true:

dec7-blog-snow

Who was this created by? Do you know them? Did their forecast from last time verify? These are questions you should ask yourself. This post had hundreds of shares when I researched it. Why? Because it’s scary. Blizzards are rare. True blizzard conditions usually don’t cover multiple states and aren’t forecast 5 to 7 days in advance. A lot can change in a span of a few days, especially when the system hasn’t even developed yet. But it gets shared on social media because it’s potentially scary.

How often do forecasts change in the weather world? Here’s a forecast for atmospheric pressure (black lines) and precipitation (colored contours) from Wednesday morning’s GFS model for the Ohio Valley, New England, and Great Lakes for 7am Monday morning:

dec7-wednesdayamgfs

Cincinnati looks dry. Here’s what the same model (GFS) had forecast for the same time (7am Monday) 12 hours earlier:

dec7-tuesdaypmgfs

Cincinnati also appears dry here, but notice a forecaster using this model in Boston may have some trouble because precipitation amounts differ.

Let’s take another model, the ECMWF. Many meteorologists feel, over long periods of time, that it’s more accurate than the GFS. Is it? Here’s the forecast for atmospheric pressure (black lines) and precipitation (colored contours) from Wednesday morning’s ECMWF model for the Ohio Valley, New England, and Great Lakes for 7am Monday morning:

dec7-wednesdayamec

That’s a lot different that what Wednesday morning’s GFS model showed. That’s also a lot of precipitation. Some of it may be snow and some of it may be rain, depending on the temperature at various levels of the atmosphere. Here’s what the ECMWF had forecast for 7am Monday just 12 hours earlier:

dec7-tuesdaypmec

That’s quite a difference in 12 hours. Precipitation amounts are much different in the Ohio Valley and Great Lakes…plus the center of low pressure (closed off black lines) is in a much different spot.

So which one is right? That’s why meteorologists go to school for 4 years to study math and science. They throw the book at us and teach us how these models behave and work. What isn’t learned through education is learned through experience. This knowledge is not a part of a social media post showing massive amounts of snow, ice, cold, and a blizzard days or weeks out. Realistically, a social media poster wanting “likes” will post Wednesday morning’s ECMWF precipitation forecast because it’s scary and (if it verified) would be quite disruptive to travel.

So before you share a weather-related social media post, think of these:

  1. Who posted this information? Are they a meteorologist? Do you know them? Do they actually forecast the weather, do or they just post computer forecast model graphics? Have they been right before? Do you trust their forecasts?
  2. Who shared this information? If it’s a trusted source of information, then it’s probably giving you more truth than lies. If it’s a friend that shares everything and anything, then it’s probably a good idea not to share it and go to a trusted source.
  3. Did they post model output or did they make an actual forecast? Odds are higher that the outcome they are predicting will be right if it’s an actual forecast (meaning it doesn’t just look like a computer made it). Remember, snowfall forecasts usually have ranges not specific numbers for cities because wise forecasters and meteorologists acknowledge variability and uncertainty.
  4. A forecast for a massive storm or hazard several days or weeks out – especially if it is a very specific forecast – is usually wrong to dead wrong. When it doubt, don’t share it.
  5. Computer forecast models often overdevelop areas of low pressure in the long range (7+ days), so of course they are going to produce big storms as you go farther into the future.
  6. Some meteorologists hype. It’s just a fact. I hate it, and you hate it. Don’t fall for the hype. Remember if that meteorologist or forecast got it right last time. When I say “got it right,” I mean “was responsible,” “not scaring you then changing their thinking last minute,” and “at least in the ballpark with amounts and impacts.”
  7. When in doubt, don’t share it. There are a lot of teenagers out there who have no formal training in the weather posting scary images just to get your attention and likes. Would you trust a teenager with your car if he or she said they were a mechanic, or would you look for someone with experience and certification in their field? Education and experience aren’t everything, but it should count for more than something.

It’s Time To Stop Issuing Tornado And Severe Thunderstorm Watch Boxes

No, I don’t want the Storm Prediction Center to stop issuing Tornado and Severe Thunderstorm Watches. I just want them to stop issuing the boxes.

If you’re confused, I’ll explain.

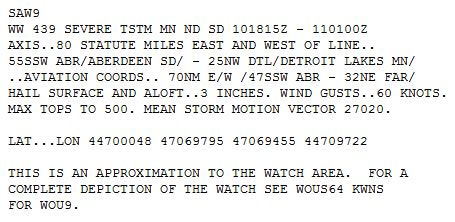
If the Storm Prediction Center feels there is an organized threat for severe or tornadic thunderstorms, they will issue a Severe Thunderstorm or Tornado Watch. But what exactly do they issue? Years ago, they would draw a parallelogram (like the one pictured below), and other text bulletins:

may19-oldwatch

If you were in the box, you were in the watch. If you were out of the box, you weren’t in the watch. It was that simple.

Nowadays, the box is issued, but so is a list of counties in the watch. First the box comes down:

aug18-watchtext

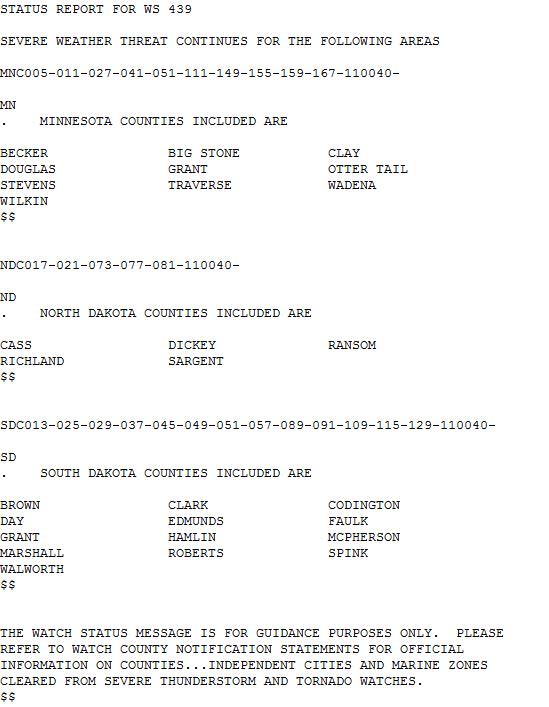
Then the county list comes down (this example is a status update, not the initial update):

aug18-watchcounties

No problem, right? You see the box, you see the counties, and you know whether you are in the watch or not. Right? Not always.

Sometimes the watch and the counties don’t match up. Here’s a watch from earlier this year:

aug18-watchboxexample1

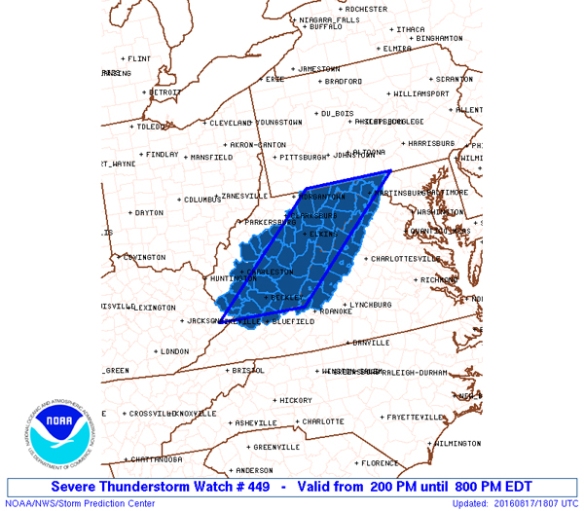
Is Charleston, West Virginia in the watch or not? Charleston is outside of the box, but is in a highlighted county. How about another example? Suppose you’re watching TV in Rapid City, South Dakota. Are you in this watch?

aug18-watchboxexample2

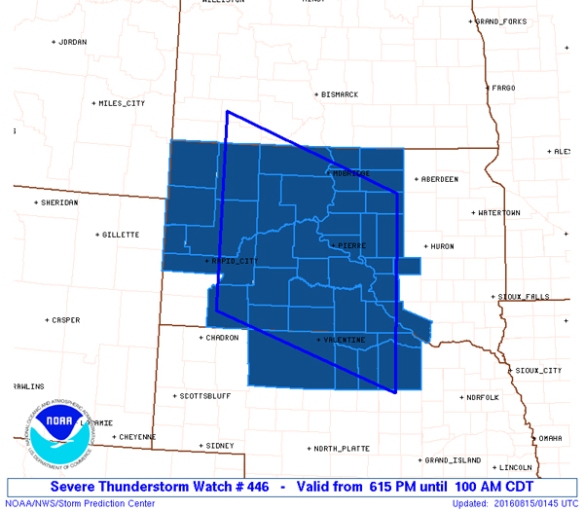
If the TV meteorologist on Channel A shows only the box, you’re “out” of the watch. If the TV meteorologist on Channel B shows only the counties, you’re “in” the watch. If the TV meteorologist on Channel C shows both, you’re “in” and “out” of the watch.

Here’s another tricky one:

aug18-watchboxexample3

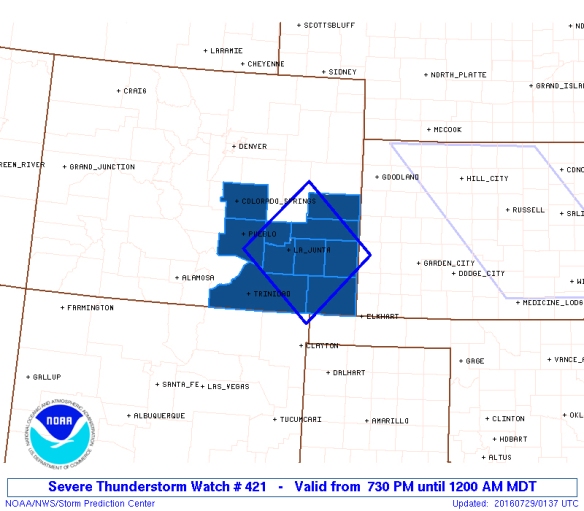
What if you were in the southeastern part of the county just east of Colorado Springs? This area is in the box, but not in a highlighted county.

How about a watch where a few counties west and north of the box aren’t even close to the edge of the box?

aug18-watchboxexample4

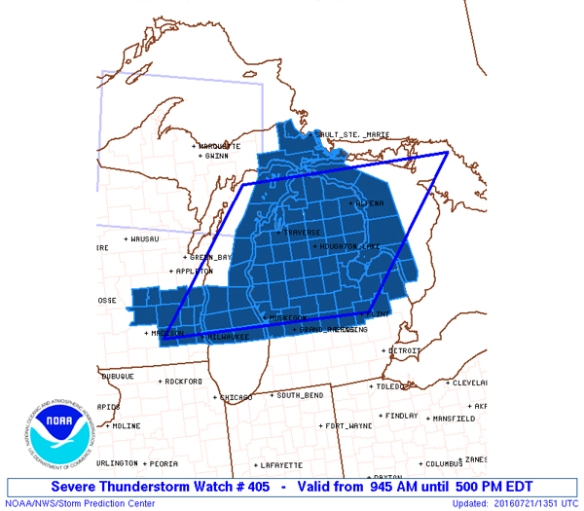
Because the box “must” be a parallelogram, SPC color outside of the lines. Or perhaps the local National Weather Service forecast office wanted to include areas in the watch, and the SPC agreed. Storms rarely fit in parallelograms.

It gets more confusing. Suppose the threat for severe storms is high, and a Particularly Dangerous Situation Tornado Watch is issued:

aug18-watchboxexample5

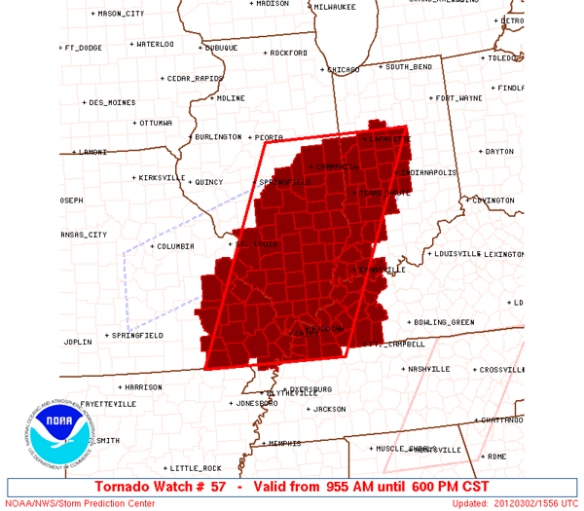
This Particularly Dangerous Situation is particularly confusing. If you’re in Fort Campbell, Kentucky, are you in this watch? This is a bad time to be unsure. There were several strong tornadoes in this watch.

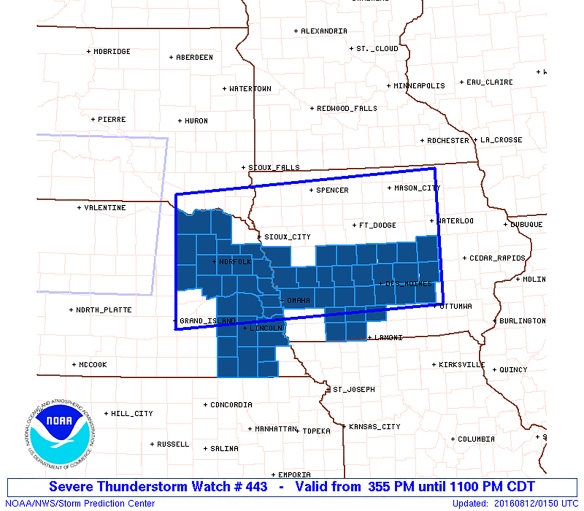
What about when several counties in the box are not in the watch? It has happened.


aug18-watchboxexample6

So let’s go back a second…was Charleston, West Virginia in the Severe Thunderstorm Watch above? The answer is yes. How about Rapid City, South Dakota? They were. Fort Campbell, Kentucky? Yes. The box doesn’t define the watch; the county list does. In other words, if your county is on the list, you’re in the watch. The box doesn’t matter.

Suppose a pair of watches are put up side by side, and you’re on the edge. One watch is in effect through 3am, and the other is in effect through 6am. There’s a big difference there. That’s a lot of lost sleep if you think you’re in the second watch and actually in the first.

This brings me to my point: it’s time to stop issuing Severe Thunderstorm and Tornado Watch boxes. Being in the box or out of the box means nothing, so why issue it? The box is a legacy product that is outdated and only confuses those reviewing the watch. The box idea worked in the 1960s, but it doesn’t work now. The only reason I can think the box is around is the Internet and media. Intellicast.com will show Tornado and Severe Thunderstorm Watches in box form. Some TV meteorologists will, too. I’m not sure why they do. But change is slow, so I suppose it’s easy to not make a change.

I’ll argue, however, this change needs to be made. Severe Thunderstorm and Tornado Watches are not life or death, but they are likely the most – at least least one of the – important types of watches issued. Many people have died in these watches. The last thing I want is for someone to get hurt or killed because they weren’t sure if they were in the watch.

Confirmed Tornado In Sardinia

At approximately 11:16am Wednesday morning, a tornado damaged homes in the city of Sardinia, Ohio (of north central Brown) County. The National Weather Service confirmed the tornado at 3pm this afternoon, but radar actually confirmed the tornado shortly after it occurred.

Here was the snapshot of radar reflectivity (the shower and storm mode) from the National Weather Service radar at 11:16am Wednesday:

aug17-reflectivity

The Tornado Warning is outlined in red. Note the weaker echoes between stronger echoes in the image above compared to the radar velocity (the “Doppler” part of Doppler radar) below:

aug17-velocity

In the highlighted area, the wind on the west side of the storm is moving away from the radar to the north of the storm (the red area), and the wind on the east side of the storms is moving towards the radar to the north of the storm (the green area immediately right of the red area). This is the circulation associated with the tornado.

How was it possible to confirm this tornado in real-time? See the correlation coefficient image from the National Weather Service’s radar at the same time:

aug17-cc

That “cool” colored spot in the middle of red colors is a debris signature. It is very close to the rotation on radar and the hook seen in the reflectivity image. Correlation coefficient shows the correlation in shape and size of objects (raindrops, hailstones, etc) in each pixel. A high correlation (red colors) between objects suggests objects the radar samples are relatively the same size and same shape. A low correlation (cooler colors) suggests objects are of different shapes and sizes. In this case, the objects are pieces of trees, someone’s home, or crops being lofted into the air and being sampled by the radar. As a meteorologist, you hope you don’t see this. This signature (really, all three of them) confirmed the damaging tornado shortly after it caused damage.

See the comparison of the products:

aug17-radarloop

The tornado had a damage path that was 1 mile long and up to 100 yards wide. The maximum wind was 75mph. This was the first confirmed tornado in Brown County since March 2, 2012; the 2012 tornado also went through Moscow, one of the deadliest Tri-State tornadoes in recent history.

What You Need To Know About Tomorrow’s Severe Weather Threat

There is a risk for severe storms tomorrow. There is uncertainty in the timing and the strength of thunderstorms tomorrow. I’ll provide updates as the timing and threat changes, but this is the plan for now.

The entire Tri-State is in a marginal to slight risk for severe storms Thursday and Thursday night. The slight risk is basically for communities along and west of I-75; this is where the threat is highest:

mar30-spc-blog

As usual, the threat for damaging straight-line wind and large hail will be highest. Tornado threat is in play, but it is a secondary threat. Here’s are my thoughts how high each threat is:

mar30-threats-blog

Note that the most likely time for strong to severe storms late in the week is 8pm Thursday to 2am Friday.

Computer guidance is of little help with the timing and strength of tomorrow’s storms. For the time being, the NAM model appears to be more accurate. It shows rain and isolated storms developing overnight and early Thursday (Cincinnati is the pink dot):

mar30-8amradar

Rain and isolated storms move east of Cincinnati tomorrow morning and early tomorrow afternoon, and partial clearing is forecast during the second half of the day:

mar30-1pmradar

The second round of showers and storms will develop to our west during the afternoon and move east, towards the Tri-State, nearing sunset:

mar30-8pmradar

A line of rain and storms will sweep through the Tri-State during the second half of the evening and very early Saturday morning:

mar30-11pmradar

Rain and storms will diminish and end well before sunrise on Friday:

mar30-2amradar

The screaming message here is that rain and isolated storms are forecast overnight and early Thursday and a second round of storms is forecast tomorrow night. Be alert for warnings!

What Happened To Tuesday Night’s Forecast?

As you probably noticed, the chance for showers and storms in the Tri-State Tuesday night was overdone. Even on-air at 5pm Tuesday, I mentioned a threat for severe weather – especially west of Cincinnati – and scattered showers and storms. I played the threat down on-air tonight, but the radar tonight suggested I didn’t play it down enough.

At 2pm Tuesday, the Storm Prediction Center had the western half of the Tri-State and most of Indiana under a slight risk for severe storms:

aug18-svr2pm

As a broadcast meteorologist, you need to present this threat, even if you don’t fully agree with the Storm Prediction Center. I’ll agree with the Storm Prediction Center that there was adequate low-level moisture, warmth, and instability available for thunderstorms to form and become strong or severe.

The missing piece – or at least the piece that was most in question – was the upper-level support. Tuesday morning’s NAM model showed the upper-level disturbance (yellow/orange/red) approaching Cincinnati (the black dot) at 8pm Tuesday:

aug18-namvort

Ahead of a disturbance like this, lift in the atmosphere increases, and the chance for storms – including severe storms – increases. Tuesday morning’s GFS model showed a disturbance of similar strength approaching the Tri-State at 8pm Tuesday:

aug18-gfsvort

Two models showing a disturbance moving through the Ohio Valley raises confidence about the coverage and intensity of showers and storms. The GFS model was farther south with the disturbance, and the NAM model had the disturbance more spread out.

It is hard to verify exactly where these disturbances were Tuesday evening (given they are 18,000 feet above the ground), but the 9pm run of the RAP model (which updates every hour) is our best hope for verification. Here’s where it placed upper-level disturbances at 10pm Tuesday night:

aug18-rapvort

Clearly, the RAP has the strongest disturbance northwest of Cincinnati and has it more compact than the NAM model. Showers and storms developed well to the northwest of Cincinnati on the nose of the upper-level disturbance Tuesday afternoon, and outflow from the early evening storms supported new storm development through late evening (as 11pm Tuesday radar shows):

aug18-11pmradar

Models clearly missed the mark, and as a result, the forecast could have been better. Just like in the winter where the exact track has a big impact on snowfall totals, the track of this disturbance had a big impact on the placement and strength of showers and storms.


The Problem With Sunday’s Highland County Tornado

On Tuesday afternoon, the National Weather Service in Wilmington, Ohio confirmed an EF-0 tornado in central Highland County that lasted approximately 4 minutes (from 8:39 to 8:43pm) Sunday evening. According to the damage survey, the tornado produced wind speeds up to 85mph and created a swath of damage 2.5 miles long. The tornado length is the 9th highest on record for any EF-0 Tri-State tornado since 1950.

At 1:45pm ET on Sunday, the entire Tri-State was put under a Tornado Watch:

jul28-tornadowatch

In addition to SPC’s slight to moderate risk for severe storms issued days in advance, this was an early indication that tornadoes would be possible Sunday afternoon and evening. Many – including me – weren’t buying into the need for a watch Sunday afternoon. Afternoon clouds only allowed spotty showers to form. Showers and storms finally started to move into the Tri-State and intensify slightly after some late day sunshine. There was one Severe Thunderstorm Warning issued for a part of the Tri-State Sunday night: A Severe Thunderstorm Warning for Fayette, Union, and Butler County issued at 6:26pm…

jul28-severe

This warning did not verify. Showers and storms were spaced out for much of the evening and were not particularly strong. There was a report of a tree down on a house in Independence, Kentucky around 8:30pm, and that was the only report of damage for quite a while. Reports of damage came in late from Highland County; the first report of damage from Highland County came about 45 minutes after the damage had occurred:

jul28-lsr

This is not an uncommon report to have after a severe storm. It was a bit surprising to see the report given that no Tornado or Severe Thunderstorm Warning was issued for Highland County and radar data suggested there would be some areas of strong but sub-severe winds.

What exactly did radar data show? Here is the reflectivity scan (showing shower and storm intensity) from the NWS Wilmington, Ohio radar at 8:38pm Sunday night:

jul28-reflectivityedit

The tornado was confirmed southwest of Highland County, and it is clear that showers and storms in the area were intense. These showers and storms had good inflow, but there was no pronounced hook echo. What did the Doppler part of Doppler radar show?

jul29-velocityedit

Storm relative velocity data from NWS Wilmington’s radar showed strong winds moving toward from the radar (green) south of Hillsboro around 8:40pm. The red pixels on the southwestern flank of this storm showed winds on average moving away from the radar in Wilmington. These red and green colors are not close together or bright, suggesting little or no rotation. Some storms in the Tri-State had stronger rotation Sunday night, and they did not produce tornadoes. What made this storm a troublemaker?

The real problem here is the radar data. This graphic from NOAA shows why this storm likely didn’t receive a warning:

jul28-radarbeam

Where the tornado began, NWS Wilmington’s radar beam was scanning about 1,100 feet above radar level (the radar is about 100 feet off of the ground in Wilmington). Despite being one county away from the radar site, the beam was likely too high to see the tornadic circulation or any parent circulation. Even with a recent upgrade – called SAILS – to the radar, the upgrade does not allow the radar to scan closer to the ground. The upgrade allows low-level scans to come from the radar during times of active or severe weather, but the upgrade does not give meteorologists the ability to see all tornadoes, including if they are far from the radar site.

The lowest scan from nearly all of the NWS radars covering this country is 0.5° above the ground. Why? Honestly, it’s fear of people getting blasted with radiation from these radars. The sun gives off a lot more radiation every day, but people aren’t constantly lathering up on sunscreen every time they go outside.

For years, the FAA has operated a radar in Kenton County, continuously scanning at 0.1° above the ground. To my knowledge, I’ve seen no complaint about this radar emitting radiation even closer to the ground than the NWS’ radar. Why should we be so considered with an NWS radar scanning at 0.1° instead of 0.5°? This fear of radiation and the bureaucracy surrounding it may actually be putting lives at risk. Lower-level scans will likely improve lead times on Tornado Warnings and Severe Thunderstorm Warnings. Lower-level scans will allow us to track hazardous weather with more accuracy. Why would we not want this?

Despite all of the improvements made to radars over the years (from more frequent updates to higher resolution to even more radars), the lowest-level scan is not getting any lower; this needs to change. The benefits of lower-level scanning outweigh the consequences; an upgrade that involves lower-level scan angles will allow us see tornadoes like the one that hit Highland County Sunday night with ease.


Threat For Winter Storm Increasing

Confidence is increasing that a significant winter storm will affect the Ohio Valley Tuesday through Thursday. Heavy snow will be possible with this system. Recent model runs suggest the highest snowfall totals will be northwest of Cincinnati and lower amounts will be found southeast. For now, here’s my thinking on the winter storm threat from Tuesday night through early Thursday:

dec22-stormthreat

While the confidence for snow is increasing, there will likely be a a wide range on snowfall amounts in the Cincinnati area Tuesday through Thursday. The latest model runs suggest areas northwest of Cincinnati (especially north and west of the Tri-State over southern, central, and northern Indiana) may see several inches of snow, while areas southeast of Cincinnati will see considerably less.

There is also a potential for ice accumulation with this system, especially Tuesday night and early Wednesday. The newest SREF model probabilities (from 10am this morning) also suggest a rain/freezing rain mix at 7am Monday morning, with the highest chance for seeing ice along I-70 from Indianapolis to Columbus:

dec22-sref12zmonday2

While the area of low pressure set to move through the Ohio Valley will be strong, winds will not be as strong with this system as they were over the last couple of days. The latest model guidance for Cincinnati has 10-25mph sustained winds Tuesday through Wednesday night and wind gusts up to 45mph Wednesday and Wednesday night:

dec22-winds

It is still too soon to make a call on ice or snowfall accumulations with this Tuesday, Wednesday, and Thursday storm. More specifics will be released in the coming days…

Rain Transitioning To Snow, Gusty Winds Tonight

Good afternoon! A well advertised storm system will affect the Ohio Valley over the next couple of days. Simply put, rain will transition over to snow tonight, and winds will continue strengthening over the next several hours. I have broken down this blog post into sections to focus on each threat specifically:

Precipitation

Early morning model runs are in good agreement about the strength and positioning of the low pressure (the driving force) at 7am Friday morning:

dec20-12zmodels

The 7am model runs all have low pressure centered over Michigan tomorrow morning. The heaviest, most intense precipitation with this system will be to our east by early tomorrow morning, but models all suggest precipitation (snow, given temperatures in the 20s) will be falling in the Ohio Valley at that time.

While rain will fall in many Tri-State locations through dinner time, rain will gradually transition over to snow approaching late evening. The latest run of the HRRR model suggests many will have a slushy inch or more of snow by 1am tonight:

dec20-hrrr6z

Of course, this is just one model’s forecast snowfall accumulation, but the HRRR model tends to do well with snow events like these. Notice higher snowfall accumulations north and west of Cincinnati. There will likely be some other areas north and east of Cincinnati with locally higher amounts as an upper-level disturbance moves through overnight.

Fayette, Union, Franklin, and most of Ripley County, Indiana along with Butler, Warren, Clinton and most of Highland County will likely receive 1-3″ of snow from this evening through tomorrow afternoon. Totals will be closer to 1-2″ from southern Ripley County to southern Butler County back down to northern Adams County. Less than 1″ of snow is forecast in the southern third of the Tri-State. Local 12 Meteorologist John Gumm posted this storm total accumulation graphic this morning, and his thinking is nearly identical to my thinking for now.

Snow will partially melt tomorrow as temperatures struggle to reach into the low 30s. Roads tomorrow morning in and around Cincinnati may be slick or partially covered with slushy snow. I’m cautiously optimistic road crews will keep up with snow overnight, but I’m confident there will be more accidents than usual during the Friday morning commute.

Temperatures

The chart below shows model temperatures trends in the week ahead:

dec20-temps

Temperatures will drop rapidly through the 40s, 30s, and 20s over the next several hours. We’ll likely be in the mid to upper 20s early tomorrow morning. The warmest Tri-State locations tomorrow will top out in the mid 30s. We’ll be back down in the 20s early Saturday morning.

Wind Chills

The chart below shows model wind chill trends in the week ahead:

dec20-windchills

The “feels like” temperatures late tonight will likely be in the single digits and teens. It will feel just as cold early Saturday morning. Wind chills will be in the teens most of Friday morning and afternoon.

Winds

The chart below shows model wind trends in the week ahead (solid lines are sustained winds, dashed lines are wind gusts):

dec20-winds

Wind chills will be well below temperatures tonight, Friday, and Friday night. Winds will gust as high as 65mph tonight and tomorrow; sustained winds will be between 20-40mph out of the southwest early this evening, then veering to the west by early Friday morning. Winds will be strong out of the northwest tomorrow.

Some will experience power outages tonight and tomorrow; light home damage also will be possible. I strongly recommend you secure any outdoor holiday decorations soon before gusty winds hit this evening; this includes any inflatable snow globes you have in your front yard!

Be safe tonight and tomorrow! Strong winds, arctic air, and accumulating snow promises to travel challenging in the next 36 hours!

Quick Thoughts On Snow Tonight

I’m on vacation, so I’m going to keep this short…plus I have a lot of Christmas shopping to do!

A quick glance through the latest computer model runs shows they are more aggressive with snow chances tomorrow. As of yesterday afternoon up to 2″ of snow appeared likely north and west of Cincinnati Thursday night and Friday; models are now more aggressive with bringing snow farther south.

Here’s what the latest model runs have to say about snowfall amounts tonight in Cincinnati:

This morning’s (7am) NAM: 0.9″
Last night’s (7pm) GFS: 1.0″
Last night’s (7pm) ECMWF: 1.0″

Even the SREF model probabilities for 1″+ of snow in our area have gone up. The SREF model trends are usually accurate, so this is a telling signal. Here’s a comparison of yesterday’s 4pm and this morning’s 4am SREF model runs for the potential of 1″+ of snow:

Image

Notice higher probabilities of 1″+ of snow are higher in the Cincinnati area. With low temperatures tonight in the mid 20s and highs tomorrow only in the low 30s, this snow will be more slushy than powdery.

For now, I’m thinking storm total snowfall will look something like this…(remember, these numbers may change!):

Connersville, Liberty: 1-2″, isolated 2.5-3″ amounts
Brookville, Middletown, Lebanon, Wilmington, Hamilton, Penntown: 1-2″, isolated 2.5″ amounts
Cincinnati, Versailles, Fayetteville, Hillsboro, Alexandria, Batavia, Aurora: Around Or Just Under 1″
Vevay, Owenton, Williamstown, Falmouth, Foster, Maysville, Georgetown, West Union, Peebles: 1″ Or Less

I’ll try to get another update in later today…