An Annual Reminder: Think Before You Share Weather Posts

While the courtesy applies to any time of the year, the courtesy of “thinking before you sharing weather-related posts” especially applies to the colder months of the year.

As a meteorologist, I look at a look of computer forecast model data daily. This is often referred to as “guidance” for a reason; these models are designed to “guide” the decisions of meteorologists while making a forecast. Sometimes the guidance is wrong, and sometimes it is right. Sometimes one model will propose one solution, and other model will have a different idea of how the weather will change.

You may have seen some of this guidance without even knowing it. If you see a map of snowfall totals that doesn’t look like a human being created it, that’s likely computer model guidance. It’s raw computer output, so it’s not a forecast. That one computer forecast model may look very different from the model run before it or different types of computer forecast models. But all you likely see in that social media post is what one model at one time thought. It may not be current; it may be a map saved from years ago and just re-posted.

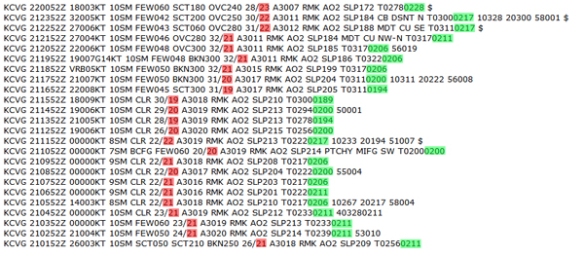
Sometimes the maps you see are created by a human, but not by a meteorologist or someone with years of forecasting experience. For example, someone messaged me this screenshot from the other day on Facebook asking if it was true:

dec7-blog-snow

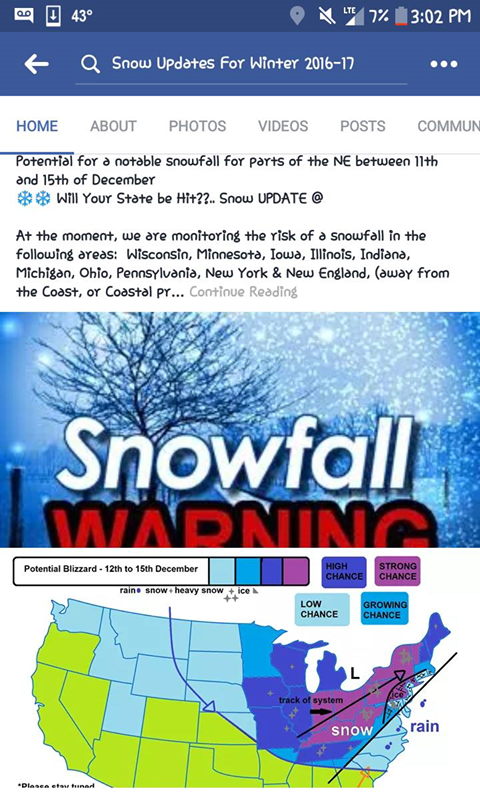
Who was this created by? Do you know them? Did their forecast from last time verify? These are questions you should ask yourself. This post had hundreds of shares when I researched it. Why? Because it’s scary. Blizzards are rare. True blizzard conditions usually don’t cover multiple states and aren’t forecast 5 to 7 days in advance. A lot can change in a span of a few days, especially when the system hasn’t even developed yet. But it gets shared on social media because it’s potentially scary.

How often do forecasts change in the weather world? Here’s a forecast for atmospheric pressure (black lines) and precipitation (colored contours) from Wednesday morning’s GFS model for the Ohio Valley, New England, and Great Lakes for 7am Monday morning:

dec7-wednesdayamgfs

Cincinnati looks dry. Here’s what the same model (GFS) had forecast for the same time (7am Monday) 12 hours earlier:

dec7-tuesdaypmgfs

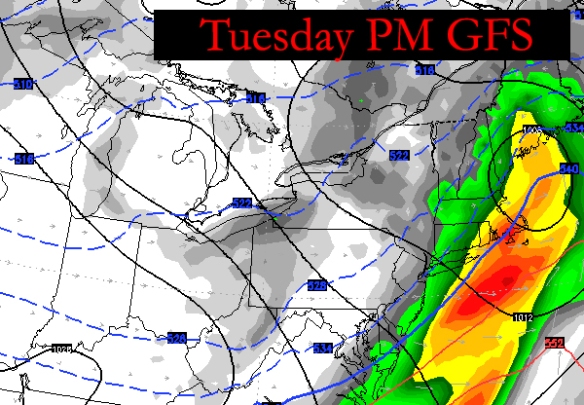
Cincinnati also appears dry here, but notice a forecaster using this model in Boston may have some trouble because precipitation amounts differ.

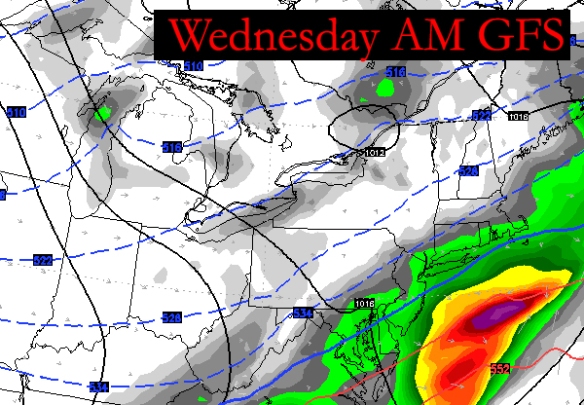
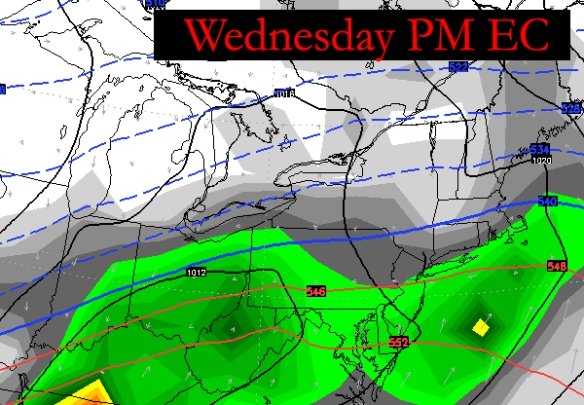
Let’s take another model, the ECMWF. Many meteorologists feel, over long periods of time, that it’s more accurate than the GFS. Is it? Here’s the forecast for atmospheric pressure (black lines) and precipitation (colored contours) from Wednesday morning’s ECMWF model for the Ohio Valley, New England, and Great Lakes for 7am Monday morning:

dec7-wednesdayamec

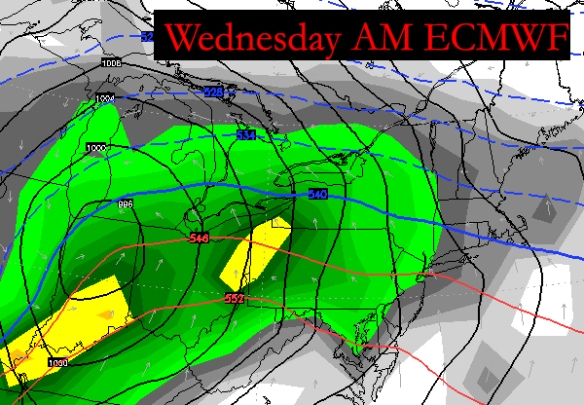
That’s a lot different that what Wednesday morning’s GFS model showed. That’s also a lot of precipitation. Some of it may be snow and some of it may be rain, depending on the temperature at various levels of the atmosphere. Here’s what the ECMWF had forecast for 7am Monday just 12 hours earlier:

dec7-tuesdaypmec

That’s quite a difference in 12 hours. Precipitation amounts are much different in the Ohio Valley and Great Lakes…plus the center of low pressure (closed off black lines) is in a much different spot.

So which one is right? That’s why meteorologists go to school for 4 years to study math and science. They throw the book at us and teach us how these models behave and work. What isn’t learned through education is learned through experience. This knowledge is not a part of a social media post showing massive amounts of snow, ice, cold, and a blizzard days or weeks out. Realistically, a social media poster wanting “likes” will post Wednesday morning’s ECMWF precipitation forecast because it’s scary and (if it verified) would be quite disruptive to travel.

So before you share a weather-related social media post, think of these:

  1. Who posted this information? Are they a meteorologist? Do you know them? Do they actually forecast the weather, do or they just post computer forecast model graphics? Have they been right before? Do you trust their forecasts?
  2. Who shared this information? If it’s a trusted source of information, then it’s probably giving you more truth than lies. If it’s a friend that shares everything and anything, then it’s probably a good idea not to share it and go to a trusted source.
  3. Did they post model output or did they make an actual forecast? Odds are higher that the outcome they are predicting will be right if it’s an actual forecast (meaning it doesn’t just look like a computer made it). Remember, snowfall forecasts usually have ranges not specific numbers for cities because wise forecasters and meteorologists acknowledge variability and uncertainty.
  4. A forecast for a massive storm or hazard several days or weeks out – especially if it is a very specific forecast – is usually wrong to dead wrong. When it doubt, don’t share it.
  5. Computer forecast models often overdevelop areas of low pressure in the long range (7+ days), so of course they are going to produce big storms as you go farther into the future.
  6. Some meteorologists hype. It’s just a fact. I hate it, and you hate it. Don’t fall for the hype. Remember if that meteorologist or forecast got it right last time. When I say “got it right,” I mean “was responsible,” “not scaring you then changing their thinking last minute,” and “at least in the ballpark with amounts and impacts.”
  7. When in doubt, don’t share it. There are a lot of teenagers out there who have no formal training in the weather posting scary images just to get your attention and likes. Would you trust a teenager with your car if he or she said they were a mechanic, or would you look for someone with experience and certification in their field? Education and experience aren’t everything, but it should count for more than something.

Flooding And Severe Threat Through Saturday Night

A Flash Flood Watch has been posted for much of southwestern Ohio and southeastern Indiana, thanks in part to saturated soil after last night’s heavy rain:

sep9-ffw

While the coverage of showers will be low through mid-evening, scattered showers and thunderstorms will develop late this evening and early in the overnight. There is a risk for strong storms tonight, but the main concern is flooding and flash flooding in the watch area.

The Storm Prediction Center only has communities northwest of Cincinnati in the marginal risk for severe storms through sunrise:

sep9-spctonight

Even if storms aren’t strong or severe, they may produce heavy rain and frequent lightning.

While the Flash Flood Watch will expire at 6am, the threat for flooding and heavy rain returns Saturday afternoon and evening. The threat for strong and severe storms will also be higher Saturday, especially for areas east of Cincinnati:

sep9-spcsaturday

The most likely time for storms – including strong to severe storms – Saturday is 2pm to 9pm. Damaging straight-line wind is the main threat:

sep9-impacts

The key takeaways here are to be aware for flooding and strong storms through Saturday night. The risk for both of these is highest northwest of Cincinnati tonight and along and east/south of I-75 and I-71 Saturday afternoon and evening. Never drive through flooded roads!

A Threat For Strong And Severe Storms Thursday And Friday

While the threat is small, you should be alert for strong and severe storms Thursday and Friday, especially during the afternoon. Even if storms aren’t strong, some cells may produce heavy rain and lightning.

Models are quite sloppy with the coverage and timing of showers and storms Thursday and Friday. Wednesday morning’s NAM model has precipitation developing in the Ohio Valley around 2pm Thursday afternoon:

sep7-2pmthursday

The same model also has showers and storms developing in the Tri-State Friday afternoon:

sep7-2pmfriday

Other models and guidance is not as aggressive with the coverage storms both Thursday and Friday. My forecast for Thursday calls for scattered showers and storms developing, especially during the afternoon and ending in the evening.

The Storm Prediction Center has placed areas west and north of Cincinnati in a marginal risk for severe storms Thursday:

sep7-spcthursday

The marginal risk is farther west in SPC’s severe weather outlook for Friday:

sep7-spcfriday

At this point, all severe weather threats for Thursday and Friday are low and mainly during the afternoon and early evening. Here’s are forecast severe impacts for Thursday:

sep7-thursdaythreats

And here is the breakdown of threat for Friday:

sep7-fridaythreats

Be alert! This threat may change in the next 24 to 48 hours.

It’s Time To Stop Issuing Tornado And Severe Thunderstorm Watch Boxes

No, I don’t want the Storm Prediction Center to stop issuing Tornado and Severe Thunderstorm Watches. I just want them to stop issuing the boxes.

If you’re confused, I’ll explain.

If the Storm Prediction Center feels there is an organized threat for severe or tornadic thunderstorms, they will issue a Severe Thunderstorm or Tornado Watch. But what exactly do they issue? Years ago, they would draw a parallelogram (like the one pictured below), and other text bulletins:

may19-oldwatch

If you were in the box, you were in the watch. If you were out of the box, you weren’t in the watch. It was that simple.

Nowadays, the box is issued, but so is a list of counties in the watch. First the box comes down:

aug18-watchtext

Then the county list comes down (this example is a status update, not the initial update):

aug18-watchcounties

No problem, right? You see the box, you see the counties, and you know whether you are in the watch or not. Right? Not always.

Sometimes the watch and the counties don’t match up. Here’s a watch from earlier this year:

aug18-watchboxexample1

Is Charleston, West Virginia in the watch or not? Charleston is outside of the box, but is in a highlighted county. How about another example? Suppose you’re watching TV in Rapid City, South Dakota. Are you in this watch?

aug18-watchboxexample2

If the TV meteorologist on Channel A shows only the box, you’re “out” of the watch. If the TV meteorologist on Channel B shows only the counties, you’re “in” the watch. If the TV meteorologist on Channel C shows both, you’re “in” and “out” of the watch.

Here’s another tricky one:

aug18-watchboxexample3

What if you were in the southeastern part of the county just east of Colorado Springs? This area is in the box, but not in a highlighted county.

How about a watch where a few counties west and north of the box aren’t even close to the edge of the box?

aug18-watchboxexample4

Because the box “must” be a parallelogram, SPC color outside of the lines. Or perhaps the local National Weather Service forecast office wanted to include areas in the watch, and the SPC agreed. Storms rarely fit in parallelograms.

It gets more confusing. Suppose the threat for severe storms is high, and a Particularly Dangerous Situation Tornado Watch is issued:

aug18-watchboxexample5

This Particularly Dangerous Situation is particularly confusing. If you’re in Fort Campbell, Kentucky, are you in this watch? This is a bad time to be unsure. There were several strong tornadoes in this watch.

What about when several counties in the box are not in the watch? It has happened.


aug18-watchboxexample6

So let’s go back a second…was Charleston, West Virginia in the Severe Thunderstorm Watch above? The answer is yes. How about Rapid City, South Dakota? They were. Fort Campbell, Kentucky? Yes. The box doesn’t define the watch; the county list does. In other words, if your county is on the list, you’re in the watch. The box doesn’t matter.

Suppose a pair of watches are put up side by side, and you’re on the edge. One watch is in effect through 3am, and the other is in effect through 6am. There’s a big difference there. That’s a lot of lost sleep if you think you’re in the second watch and actually in the first.

This brings me to my point: it’s time to stop issuing Severe Thunderstorm and Tornado Watch boxes. Being in the box or out of the box means nothing, so why issue it? The box is a legacy product that is outdated and only confuses those reviewing the watch. The box idea worked in the 1960s, but it doesn’t work now. The only reason I can think the box is around is the Internet and media. Intellicast.com will show Tornado and Severe Thunderstorm Watches in box form. Some TV meteorologists will, too. I’m not sure why they do. But change is slow, so I suppose it’s easy to not make a change.

I’ll argue, however, this change needs to be made. Severe Thunderstorm and Tornado Watches are not life or death, but they are likely the most – at least least one of the – important types of watches issued. Many people have died in these watches. The last thing I want is for someone to get hurt or killed because they weren’t sure if they were in the watch.

Confirmed Tornado In Sardinia

At approximately 11:16am Wednesday morning, a tornado damaged homes in the city of Sardinia, Ohio (of north central Brown) County. The National Weather Service confirmed the tornado at 3pm this afternoon, but radar actually confirmed the tornado shortly after it occurred.

Here was the snapshot of radar reflectivity (the shower and storm mode) from the National Weather Service radar at 11:16am Wednesday:

aug17-reflectivity

The Tornado Warning is outlined in red. Note the weaker echoes between stronger echoes in the image above compared to the radar velocity (the “Doppler” part of Doppler radar) below:

aug17-velocity

In the highlighted area, the wind on the west side of the storm is moving away from the radar to the north of the storm (the red area), and the wind on the east side of the storms is moving towards the radar to the north of the storm (the green area immediately right of the red area). This is the circulation associated with the tornado.

How was it possible to confirm this tornado in real-time? See the correlation coefficient image from the National Weather Service’s radar at the same time:

aug17-cc

That “cool” colored spot in the middle of red colors is a debris signature. It is very close to the rotation on radar and the hook seen in the reflectivity image. Correlation coefficient shows the correlation in shape and size of objects (raindrops, hailstones, etc) in each pixel. A high correlation (red colors) between objects suggests objects the radar samples are relatively the same size and same shape. A low correlation (cooler colors) suggests objects are of different shapes and sizes. In this case, the objects are pieces of trees, someone’s home, or crops being lofted into the air and being sampled by the radar. As a meteorologist, you hope you don’t see this. This signature (really, all three of them) confirmed the damaging tornado shortly after it caused damage.

See the comparison of the products:

aug17-radarloop

The tornado had a damage path that was 1 mile long and up to 100 yards wide. The maximum wind was 75mph. This was the first confirmed tornado in Brown County since March 2, 2012; the 2012 tornado also went through Moscow, one of the deadliest Tri-State tornadoes in recent history.

Why The Dewpoint Needs To Be A Part Of Official NWS Weather Records

Everyone knows the word moisture. It is a fundamental ingredient for making precipitation or even keeping it away. It is the reason why it was humid today; the more moisture there is in the air (the higher the dewpoint), the more humid it is. The dewpoint is critical for knowing whether clouds will form or whether they will break apart. The dewpoint has either a direct or indirect impact on the strength, positioning, and timing of all weather systems. The dewpoint (a temperature) can impact the air temperature and what type of precipitation falls at the ground and aloft.

For some reason, though, the dewpoint is not listed in official weather records (kept by the National Weather Service in the United States). When you look at weather records for the month of July 2016 in Cincinnati (so far), the maximum, minimum, or average dewpoint is nowhere to be found:

jul21-blog-cf6cvg

Records of air temperatures, precipitation, snowfall, wind speeds, and even snow depth are kept every single day. Yet the dewpoint is not here. Why?

The dewpoint is so important that is it listed not once, but twice in airport weather observations:

jul21-blog-metars

The red number is the dewpoint to the nearest whole number (°C), and the green number is the dewpoint (°C) in tenths (and the first “0” or 1″ here is used to indicated whether the dewpoint is positive or negative, respectively). It’s important enough to go here, but not in official weather records?

The dewpoint is so important it is measured vertically using a weather balloon (to the top of the troposphere, the layer of the atmosphere that we live in and where weather occurs) twice a day at numerous sites around the country and the world. Here’s the weather balloon “sounding” from 8pm Thursday night from Wilmington, Ohio:

jul21-blog-sounding

Guess what the green line is? It’s the dewpoint! It’s right next to the temperature in red! Wind directions and speeds (listed as barbs on the far right) are also listed. And that’s it for a weather balloon sampling! Every other variable is derived. If the dewpoint makes the variable list here, it should be in official weather records

You want to know what the record lowest or highest dewpoint was at a pressure of 850 millibars (about 5,000 feet above the ground) back to the early days of when weather balloons were launched? Here you go! It’s all here! Want to know how the average dewpoint this month compared to last month or last July? It’s not easy; even the most data savvy meteorologists will need time to make this calculation.

Keep in mind, temperature ranks for a week, month, year, decade, or ANY stretch of time are done by averaging the average temperatures for each day in that period. The average temperature for the day is simply the high and the low divided by 2. I can calculate the average temperature for a year or month and compare it to a similar length of time easily because high, low, and average temperatures are listed in official weather records. High, low, and average dewpoints are not. Comparing the average dewpoint for one year to another can take hours. It should take minutes.

Part of the argument is that dewpoint records don’t go as far back as temperature records. Hourly dewpoint records for Cincinnati go back to the late 1930s, but temperature, rainfall, and snowfall records go back to 1870, 1870, and 1893 (officially and respectively). So it’s not the same period of record…but so? Records are records. The first half of 1872’s temperature records in Cincinnati are gone; they were lost in a fire. We didn’t throw out the entire record on account of some records being lost. Jackson, Kentucky’s weather records (at the National Weather Service office there) began in 1981, some 100 years after Cincinnati’s records began. Still, we aren’t throwing out weather records from Jackson because their period of record is less than 40 years.

It’s time to add the maximum, minimum, and average dewpoint to official climate records for the United States. Moisture in the air is fundamental to understanding what type of weather occurs and how poor conditions will be. The public, not just meteorologists, should have knowledge of how weather conditions are changing so that we can see how moisture is moving over time and space. With a large enough period of record in place, dewpoint records will add to the ongoing discussion about climate change and give all a better indication of whether certain areas are more humid or less humid over time.

Update On Wednesday And Thursday’s Severe Weather Threat

As I highlighted in my Sunday blog post, there is a significant threat for severe storms Wednesday, Wednesday night, and early Thursday. Damaging straight-line wind was the main concern per yesterday’s guidance, and it still is the main threat. The tornado threat, though, has come up, but it is still a secondary threat at this time.

Just after 3am on Monday, the Storm Prediction Center placed the Tri-State in a slight to ENHANCED risk for severe storms Wednesday and Wednesday night:

jun20-spcday3

The highest potential for severe storms is focused northwest of Cincinnati.

This morning’s guidance has shifted the main area of severe weather farther north into the Great Lakes. Despite this shift, we are still in a significant threat for severe storms Wednesday and Wednesday night.

In yesterday’s blog, I discussed the derecho parameter. While I am not forecasting a derecho at this time, this parameter gives us an idea of how high the damaging straight-line wind threat is IF storms occur. Here’s what this morning’s NAM model thinks the derecho parameter will be at 2am Thursday morning:

jun20-blog-2amnamderecho

Clearly, these are high values (anything over 5 is very significant, really) over the Great Lakes and Ohio Valley. Here’s what this morning’s GFS model thinks for the same time:

jun20-blog-2amgfsderecho

While values are not as high, they are still high.

While computer guidance suggests the complex of storms may stay focused to our north, the Weather Prediction Center suggests there will be warm front (the leading edge of warmer air bisecting the Tri-State) Wednesday night:

jun20-blog-wpcsurface

The air mass lifting in from the southwest will be warm, humid, and unstable, and the front will help provide shear (the change in the speed and direction of the wind). All of these elements combined elevate the threat for tornadoes and damaging-straight wind locally (despite a higher threat closer to Chicago).

The Significant Tornado Parameter tells us where there is a elevated risk for tornadoes IF storms can form. Number greater than 1 are usually supportive of at least the potential for tornadoes. Here’s what Monday morning’s NAM model has the significant tornado threat at for 8pm Wednesday night:

jun20-blog-8pmnamtornado

This is elevated. Let’s see what Monday morning’s GFS model has for the same time:

jun20-blog-8pmgfstornado

This is also elevated. Notice that this does not guarantee tornadoes, but it does show us the magnitude of the tornado threat.

It is also important to note that model guidance is NOT is not a forecast. A meteorologist must review other guidance to make a forecast, and here is what I have come up with for now regarding late Wednesday and early Thursday’s severe weather threat:

jun20-severeimpacts

This forecast may change as model guidance changes and as we near the event. Know that the damaging straight-line wind threat and tornado threat are both in play for late Wednesday and Thursday. I’ll update this blog as needed.

What We Know And Don’t Know About Wednesday Or Thursday’s Severe Weather Threat

In the Ohio Valley, it is rare to be put in a severe weather risk area by the Storm Prediction Center more than 3 days out. This week will feature one of those rare occasions.

The Storm Prediction has put the Tri-State in the 15% severe storm risk for Thursday. The 15 percent risk means SPC feels there is a 15% probability of a tornado, severe hail, or severe wind event occuring within 25 miles of a point:

jun19-blog-spc

This is – essentially – a “slight” risk for severe storms on Thursday. The 30% area would be the equivalent of an “enhanced” risk. “Marginal,” “moderate,” and “high” risk equivalents are not issued on forecast days 4 through 8.

The takeaway here is that the Storm Prediction Center feels there is a significant severe weather threat in the Great Lakes and Ohio Valley Wednesday.

Or will it be Thursday? Models disagree on the timing of this mid-week storm threat.

There is already a buzz on social media about a complex of storms racing through the Midwest and Ohio Valley Wednesday. Some are predicting a “derecho” (a long-lived complex of storms that causes wind damage over a large area), which predicting at this range is not worth our time and ridiculous. The definition of a derecho is loose. The SPC believes a derecho must go 250 miles and contain separated 75mph wind gusts. Others disagree that a derecho needs to fulfill this requirements.

Regardless, let’s investigate this severe threat using the derecho parameter, which suggests where derechoes may grow or evolve IF storms are able to occur. The higher the derecho parameter, the better the support for them. Here’s what Sunday morning’s NAM model suggests the derecho parameter will be at 2pm Wednesday:

jun19-blog-2pmwednam

Clearly, there is a significant risk for storms with damaging wind to our west Wednesday afternoon if you believe this model. Let’s compare it to Sunday’s morning’s GFS model:

jun19-blog-2pmwedgfs

The GFS is not as impressed with the threat compared to the NAM, especially for Indiana. It is a model model with a different engine, but it is still showing a significant risk for storms with damaging straight-line wind. The GFS model actually holds the better threat off until Thursday:

jun19-blog-2pmthurgfs

The NAM model produces a future radar product. Here’s what Sunday’s morning’s NAM model suggests the radar might look like Wednesday morning:

jun19-blog-8amwedradar

…and here’s what it suggests the radar will look like 12 hours later:

jun19-blog-8pmwedradar

Even history suggests we need to watch for a damaging straight-line wind threat. The Storm Prediction Center’s database suggests the historical odds of seeing severe weather on June 22 is focused over the Tri-State, central Plains, and Carolinas:

jun19-blog-anysevere

When severe weather occurs in the Ohio Valley on June 22nd, it is very likely to be a damaging straight-line wind report versus a tornado or large hail report:

jun19-blog-wind

It is apparently that we need to monitor the damaging straight-line wind threat later this week, although tornadoes and large hail are possible with any storms that sweeps through the Ohio Valley. Our confidence, however, is muted when we see discrepancies in model guidance. The last two runs of the European forecast model (ECMWF) suggest the damaging straight-line wind threat will peak late Wednesday night or early Thursday. It is the “middle of the pack” right now.

Stay tuned. Wednesday and Thursday are days to be prepared for strong and severe storms.


A Breakdown Of Today’s Severe Weather Potential

Morning showers and storms have stabilized the low-levels of the atmosphere and have prevented temperatures from rising significantly. As of 11am, most in the Tri-State are in the 70s:

jun15-11amtemps

Sunshine is, however, returning to the Tri-State per the 10:45am visible satellite image:

jun15-1045amclouds

Note a boundary (in the form of clouds) from southern Indiana back close to Dayton. The Ohio Valley radar image as of 11:15am shows showers and storms moving east and southeast of Cincinnati:

jun15-1115amradar

While the boundary now from southern Indiana into west-central Ohio is moving southeast and will trigger isolated to scattered storms early this afternoon, the main axis of instability is in northwestern Indiana and is dropping southeast. This secondary front will be the one that triggers storms later this afternoon and early this evening.

The Storm Prediction Center has the entire Tri-State in a slight risk for severe storms through this evening:

jun15-spc

This is mainly for the potential of damaging straight-line wind. Secondary threats include large hail and localized flooding, especially with dewpoints in the upper 60s and lower 70s as of 11am. Here’s a breakdown of severe weather threats through this evening:

jun15-impacts

The most likely time for severe weather today centers between 3pm and 9pm, especially between 5pm and 8pm.

Clusters of rain and storms will develop to our northwest later today, gradually coalescing into a line as it moves southeast. The afternoon forecast calls for showers and storms to redevelop this afternoon. Highs today will be in the mid to upper 80s, and it will be steamy:

jun15-afternoon

Showers and storms will diminish and end this evening. Strong and severe storms will be favored early:

jun15-evening

Be alert, friends!

Was It A Storm That Wasn’t In The Forecast? Nope.

If you were watching Ohio Valley radar yesterday afternoon, you might have noticed radar returns in southern Indiana. Were these showers and storms bubbling up due to temperatures rising through the 70s? Did I bust a forecast?

Despite what you may think, the same device that suggests I blew the forecast also suggests I got it right. Modern radar is a power thing when used to it’s fullest potential.

First, is it realistic to have radar returns in this area? A visible satellite snapshot of the Ohio Valley shows cumulus clouds in southern Indiana at 5:15pm yesterday afternoon:

jun8-515pmclouds

We need clouds to have showers and storms, so the returns on radar could be precipitation. Notice there are no towering clouds in the area though (unlike in northern Ohio were showers and storms were in progress with higher instability); satellite imagery leads us to believe there was just a sea of shallow cumulus clouds yesterday afternoon in southern Indiana.

Here are the radar returns as viewed by the National Weather Service Doppler radar in Indianapolis late yesterday afternoon. The reflectivity (commonly shown on television or apps) is on the left, and correlation coefficient (showing the relationship between the height and width of objects like raindrops, hail, or debris sampled by radar) at the right. Blue values of correlation coefficient here suggest these returns are particles of different shapes and sizes and likely not raindrops, hailstones, or something related to meteorology:

jun8-chaff600

Radar cross sections show these returns did not extend well into the atmosphere. Here’s the reflectivity cross section from NWS’ Indianapolis’ radar at 5pm ET yesterday:

jun8-5pmreflectivity

These returns are relatively close to the ground (below 10,000′). Here’s the correlation coefficient cross section at the same time:

jun8-5pmcc

Blue values here suggest these radar returns are likely not raindrops or hailstones. So what could it be?

The radar returns become apparent around 4:40pm in the afternoon. See the green dot in the reflectivity at the left with blue (low) correlation values in the same area at the right:

jun8-440pmradar

This is surprisingly close to Camp Atterbury in Indiana. The military is known for dropping chaff to scramble radar and serve as a countermeasure. Low (blue) correlation coefficient values on radar are common with smoke plumes and military chaff. The meteorological environment did not support showers and storms, so military chaff is the most likely bet.

Need some additional evidence? Fast forward to this morning. Here’s the visible satellite snapshot as of 8:45am Wednesday:

jun8-845amclouds

Notice no clouds in the sky. There were still no clouds over southern Indiana as of 10:30am ET.

Yet there is something on radar in the same area near Camp Atterbury as of 10:20am ET:

jun8-1020amradar

Reflectivity values are high and correlation coefficient values are low in the image attached. It looks like chaff is the culprit here. Remember, we need clouds to have showers and storms, and there were no clouds in the sky when these returns were on radar.

Radar is a powerful tool if you review the data thoroughly. Even as a meteorologist, it’s easy to fall into the trap of seeing radar returns and assuming showers and storms are developing. Radar can sample dirt, bugs, plumes from wildfires, tornado debris and precipitation. Things aren’t always as they seem!