Answering the question “How humid was it this summer?” requires an understanding of the dewpoint. The dewpoint is a temperature that indicates an absolute measure of how much moisture there is in the air. Knowing the dewpoint is helpful for gauging how humid Cincinnati was on a particular day or for a particular period of time.
There are extensive weather records for temperatures and precipitation in Cincinnati back to November 1, 1870. Reliable, hourly dewpoint records for Cincinnati, however, only go back to 1938. This period of record, however, is more than sufficient to create 30-year averages (1980-2010); these averages compared to the average dewpoint for each month this summer will give us an indication of how humid this summer was and when.
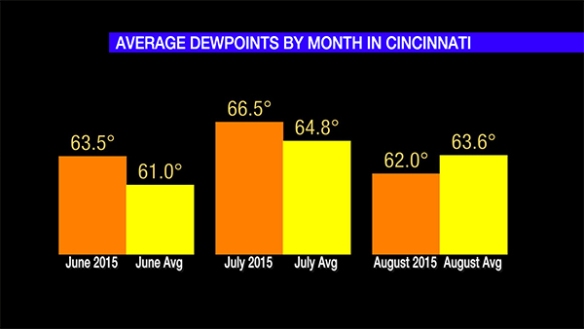
Here’s a comparison of average dewpoints by month in Cincinnati compared to the monthly average:
This graph shows June 2015’s average dewpoint was higher than the 30-year average, July 2015’s average dewpoint was higher than the 30-year average, and August 2015’s average dewpoint was lower than the 30-year average. June 2015 and July 2015 were both more humid than average, but August 2015 was not.
It is not uncommon to have dewpoints ranging from the 40s to 70s during June, July, or August. The dewpoint peaked in the 70s in June, July, and August; this peak, however, was well short of the all-time records (back to 1938) for each month near or above 80°:
We expect the maximum dewpoint of each month to be below the record, and that was the case for each month this summer. The maximum dewpoint we saw June was on the average, just above average in July, and just below average August:
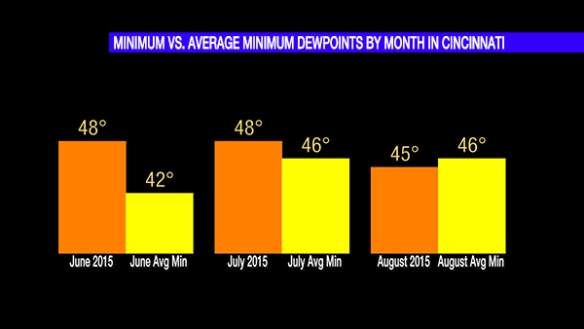
The minimum dewpoint we saw in June well above average, above average in July, and below average in August:
All of the graphics above suggest that June and July dewpoints were – more often than not – above average, but August dewpoints were generally below average.


