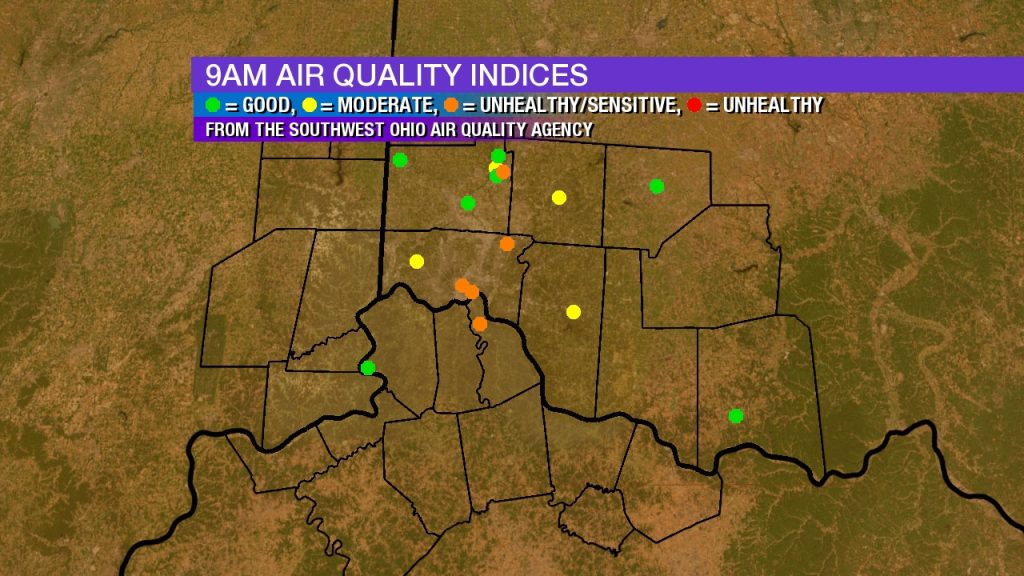
Have breathing problems? I would suggest limiting your time outside for the next couple of hours. There’s no Air Quality Alert in effect, but there’s something pretty interesting and unfortunate going on with the air quality around #Cincinnati now.
By accident, I happen to look at a map of air quality indices (AQI) this morning, and I notice the air quality was categorized as “unhealthy for sensitive groups” for many communities in and around Cincinnati, especially near I-71 and I-75.
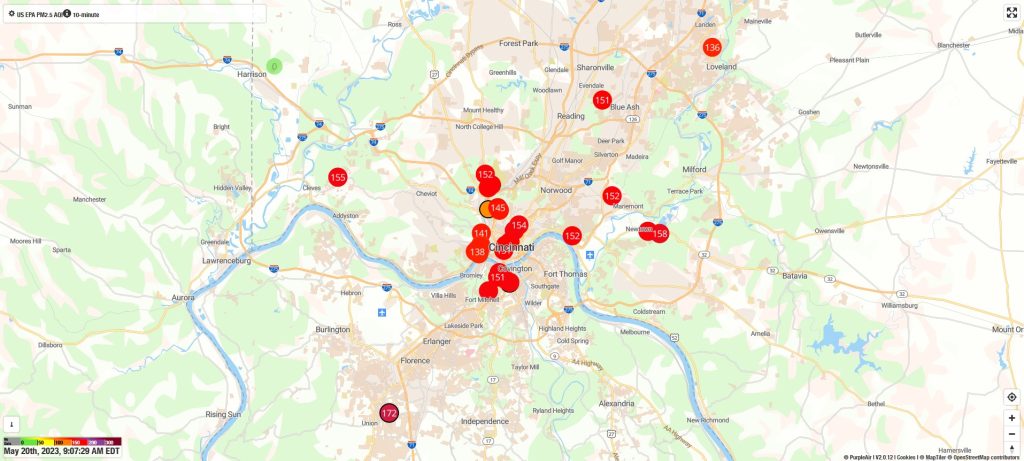
These are government sensors, but citizen sensors – like those from Purple Air (I have one) – show the AQI is actually much higher in spots and even going into the unhealthy for everyone category:
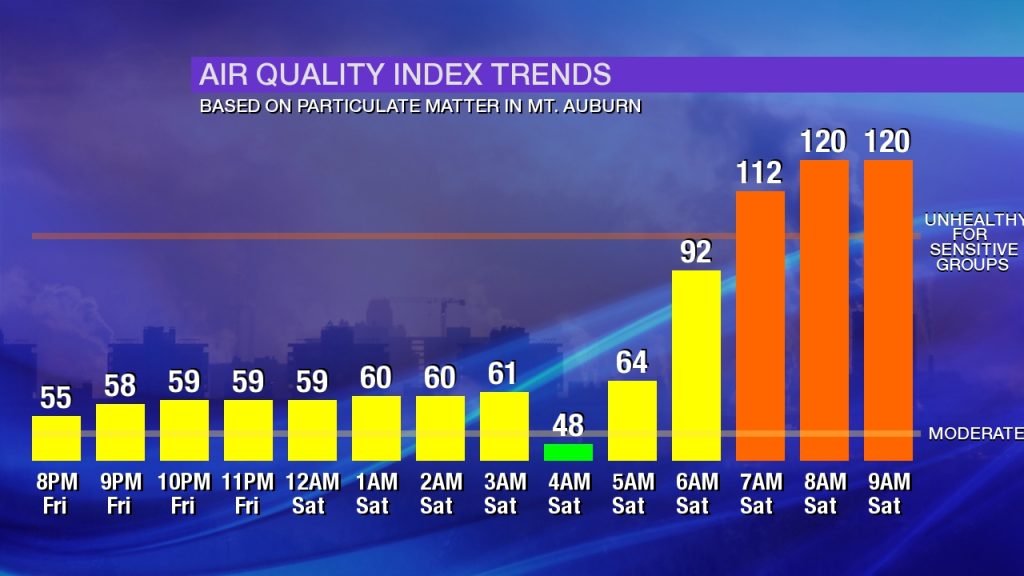
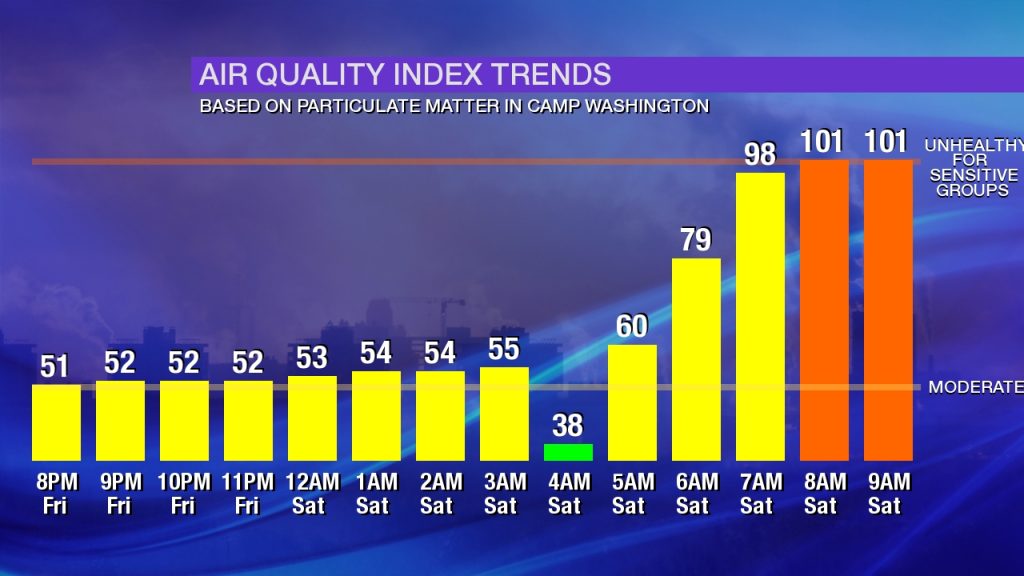
The AQI index is 100+ in Middletown, Blue Ash, Mt. Auburn, and a couple of other local sites. Here’s the trend for Mt. Auburn:
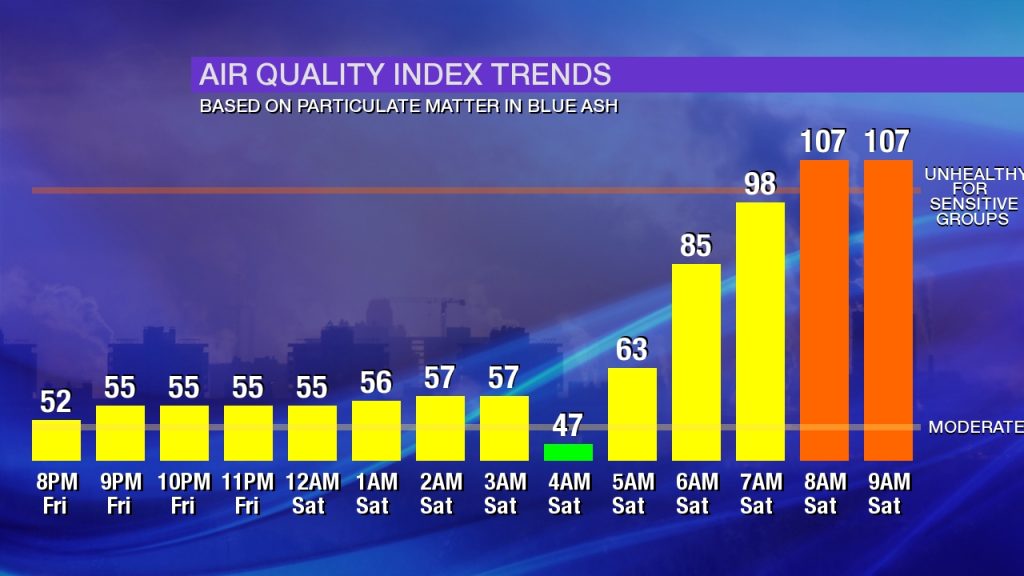
…and Blue Ash:
…and Camp Washington:
Calculating the AQI is a bit weird because it’s not a true observed value like a temperature. The AQI is a forward-leaning 8-hour average, meaning it’s the currently function of the current AQI and forecast AQI values for the next 7-hours. As time goes on, values for previous hours are recalculated based on more observed values and less on forecast values.
So why is the AQI spiking? The AQI is based on a few different pollutants, including ozone and PM2.5. The graphics attached are the AQI based on PM2.5. What’s a common source of elevated PM2.5? Wildfire smoke. An explanation of PM2.5 can be found here, and the caption of an image from this link is important to review:
Emissions of combustion of gasoline, oil, and diesel fuel can drive up the AQI, so seeing “less than ideal” values around interstates is not unusual. But this morning’s spike is significant.
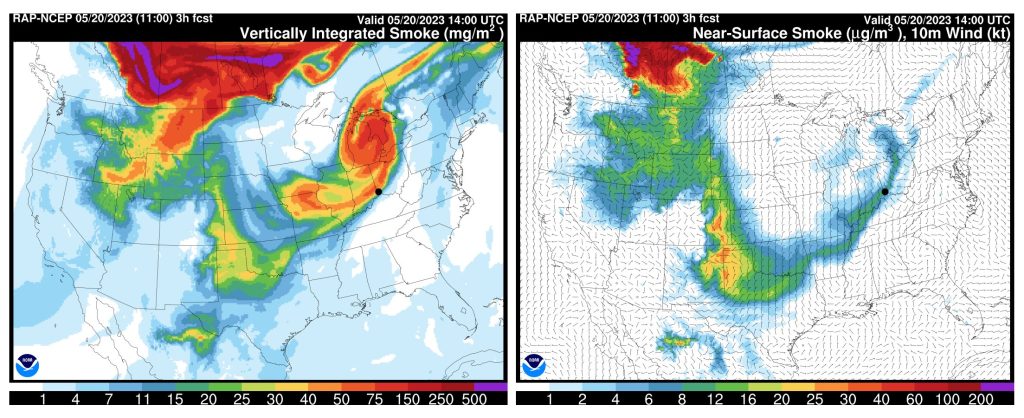
For days I’ve been talking about the wildfire smoke overhead being aloft. For the most part it is, but notice how the RAP model has elevated levels of near-surface smoke around #Cincinnati (black dot in the graphic below) this morning:
So how did this smoke aloft get to the ground? The answer is simple: it has rained. Rain – especially if it’s heavy – is a efficient way of bringing air/wind/energy aloft down to the ground. In this case, it was able to take a lot of PM2.5-laden air down to the ground.
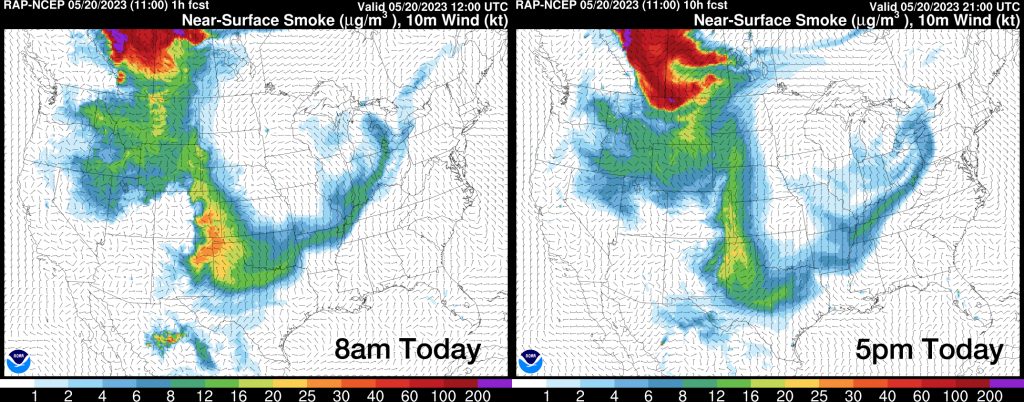
So as rain moves out and the flow at and above the ground turns more northwesterly, smoke and higher PM2.5 concentrations will move south. Here’s an evolution of near-surface smoke from 8am to 5pm today.
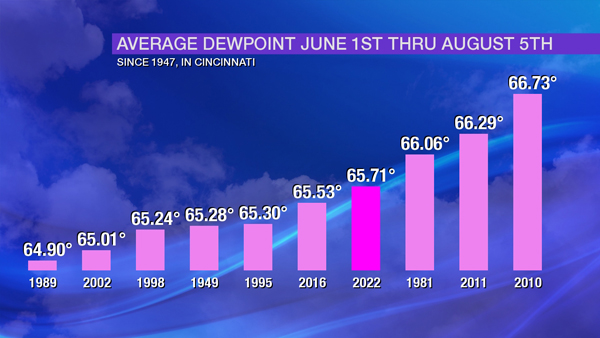
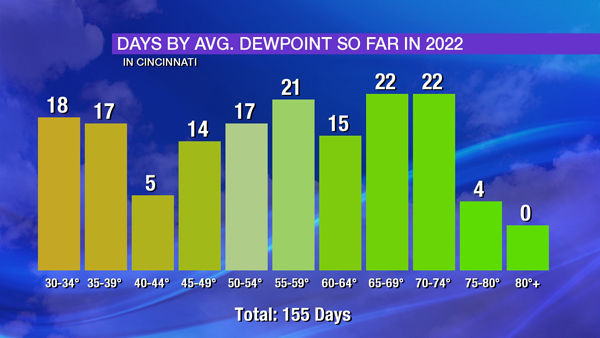
The absolute measure of humidity – or how much moisture there is in the air – is the dewpoint. The highest the dewpoint goes, the more humid it is…and in 2022, it has been high more than it has been low.
But how do you answer the question of “how humid has 2022 so far been?” The answer is: it depends how you measure it, but by most measures, it’s been abnormally humid. For this analysis, let’s look at the hourly dewpoint in Cincinnati from when the airport opened
The average dewpoint based on hourly data at the Cincinnati/Northern Kentucky International Airport since June 1, 1948. We’ll use 8pm on August 5 as the cut-off time for 2022.
Since June 1st, the average dewpoint in Cincinnati (based on hourly data) has been about 65.7°. When you compare this same period of time against previous years at CVG, 2022 ranks as the 4th highest:
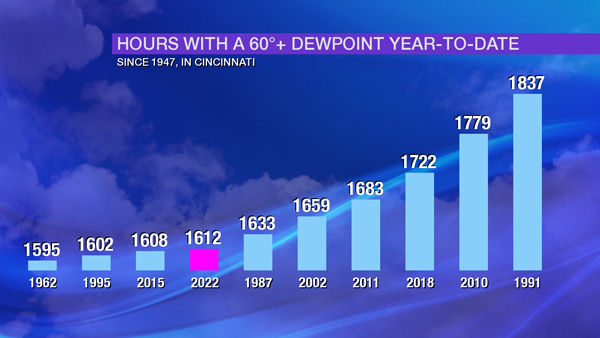
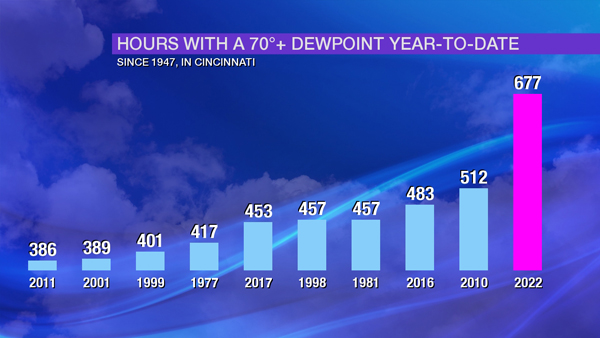
By this account, 2022 so far hasn’t been terribly humid, but there are different ways to measure how humid a period of time is. Here’s another way to measure it: “how many hours have we been in humid air?” If you say a dewpoint of 60°+ is humid like I do, we’ve had more than 1,600 hours (more than 66 days) in humid air so far this year:
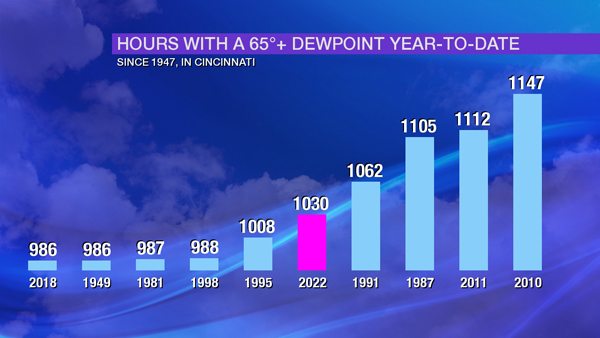
This calculation, too, shows years like 2010 and 2011 were more humid, but turn the threshold up to 65°+, and 2022 climbs up the list:
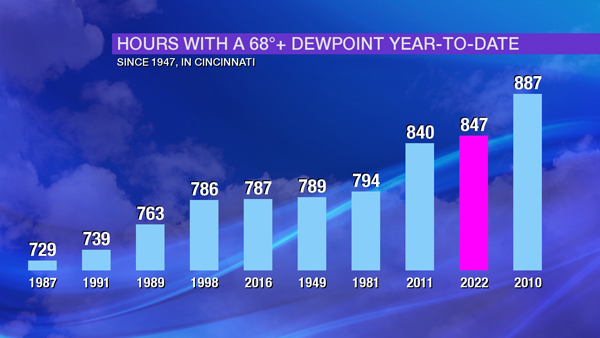
That’s nearly 43 days in 65°+ air in the first 217 days of the year. Let’s keep going: 2022 is in 2nd place for the most number of hours year-to-date at CVG with a 68°+ dewpoint:
68° for a dewpoint means it’s very humid, but I consider a dewpoint of 70°+ steamy.
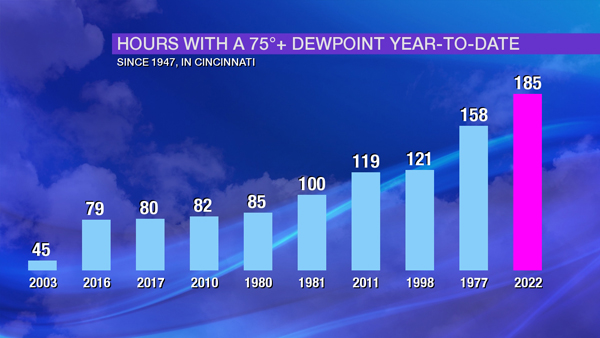
That’s more than 28 days in steamy air so far in 2022. That smashes the previous record of 512 hours year-to-date in 2010. This alone is impressive, but the dewpoint was in the mid 70s for most of Friday (August 5th)…so let’s keep going. CVG has had more than a week with a very steamy dewpoint of 75°+:
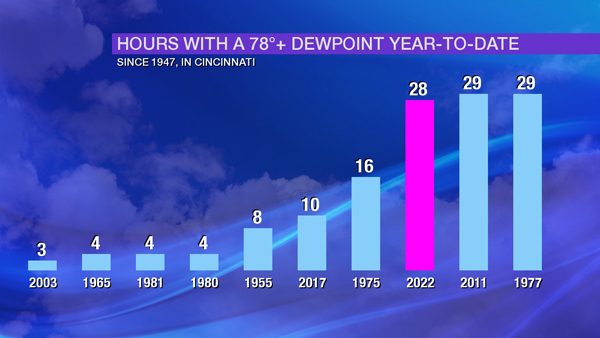
That’s also a record. But let’s go a little more. How about 78°+?
To give some perspective on this, of the 610,505 hourly weather observations I used in my calculations throughout this analysis, there were only 179 hours with a dewpoint of 78°+. Put another way, less than 0.03% of all weather observations to date at CVG have a dewpoint that high or higher.
There is no “top 10” list for dewpoint of 80°+ (extremely steamy) weather observations at CVG because a dewpoint that high as only occurred in Cincinnati for a total of 22 hours and across 4 years (2022, 1975, 2011, and 1955). Eight of those hours occurred in 2022, and that is a record for a single year.
The all-time record highest dewpoint for Cincinnati is 82°, set in July of 1943. This was observed at the Abbe Observatory in Clifton, where official records for Cincinnati were kept at the time (and airport to the International Airport opening).
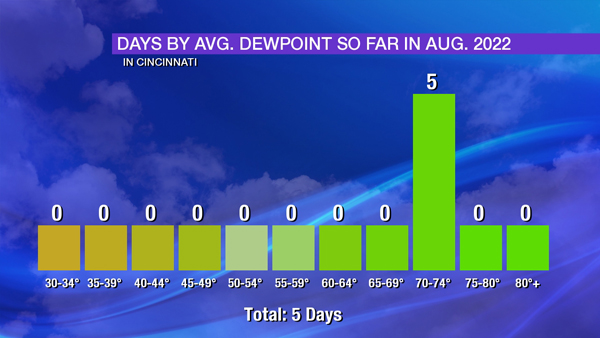
By many measures, 2022 so far has been the most humid or at least among the most humid on record. August 2022 alone has begun with 5 steamy days (based on the average daily dewpoint):
…and Cincinnati is already up to 26 steamy (70°+ average dewpoint) days and 63 humid (60°+ average dewpoint) days so far this year:
To put these numbers in perspective, Cincinnati averages 17 steamy and 72 humid days each calendar year. The records are 98 humid days (1991) and 38 steamy days (1977) for a single year at CVG.
And summer is not over! Steamy air typically moves south in early to mid-September, and humid air is usually done for the year in late September to early October.
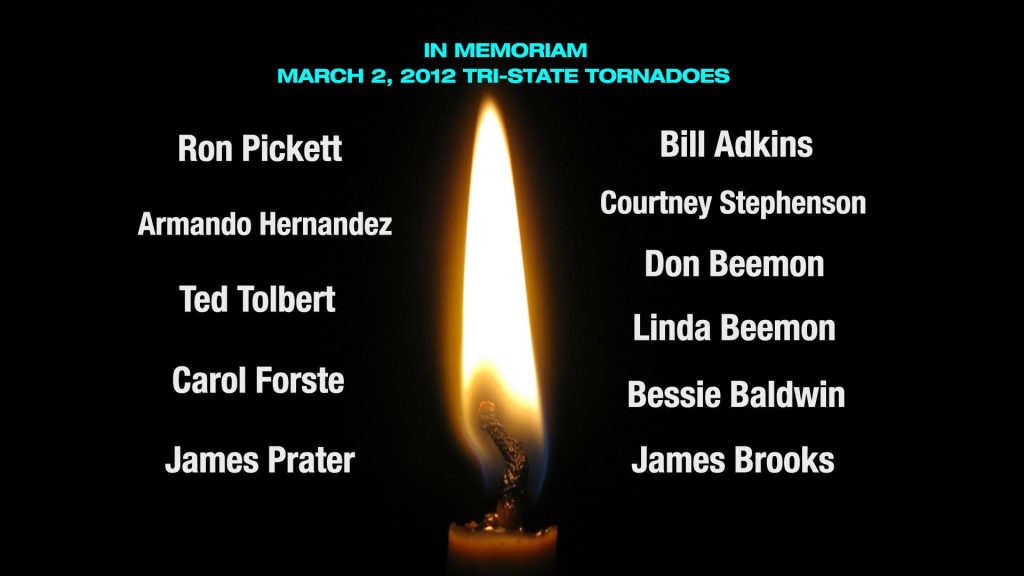
Where were you 10 years ago today? Unfortunately, for some, it was their last. March 2, 2012 was the single deadliest severe weather day in the Tri-State since official records began in 1950. There were 10 tornadoes in the Tri-State that day, and 11 people died in northern Kentucky, southeastern Indiana, and southwestern Ohio as a result of the tornadoes that day.
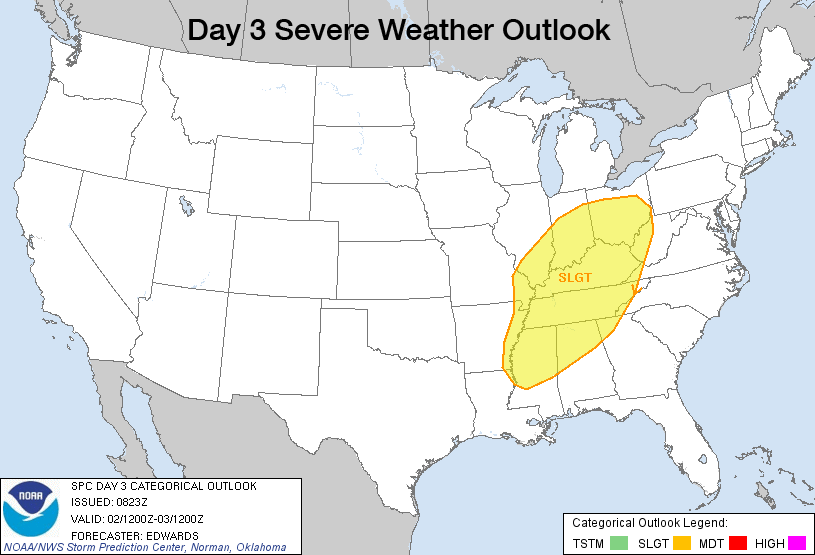
This day was also the biggest day of my weather career. This event was not a surprise; I was on television Monday morning talking about this severe weather outbreak that would occur on a Friday. By Tuesday, I was concerned that there would be severe weather to the west of the Tri-State. By Wednesday and Thursday, guidance was shifting and expanding that threat east into southern Indiana, and central Kentucky. By late Friday morning, it was very apparent that morning thunderstorms were going to move north and the warm front was going to be able to spread into northern Kentucky and areas along and south of US-50 in Ohio and Indiana. Here’s the evolution of the severe weather threat from the Storm Prediction Center in the days leading up to the March 2, 2012 tornado outbreak:
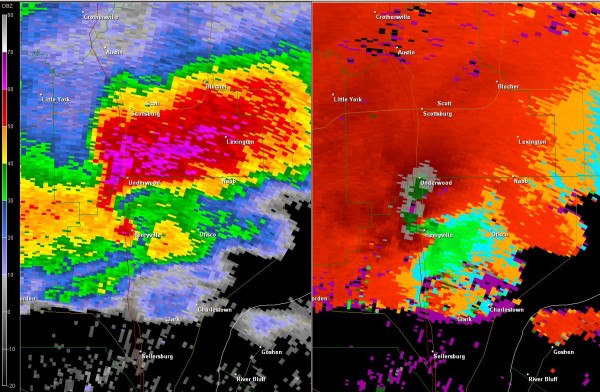
Tim Hedrick and I chatted throughout the week about the event, but I remember the conversation we had on the evening of March 1, 2012 well. That night, he asked me what I thought. I said that the severe weather threat was concerning, especially to the west of us…but I was concerned about what the leftovers would look like if thunderstorms in the morning could get out by the afternoon. By 10am Friday morning, he called and asked me to come in. By noon, I was in the chair looking at data. By 2pm, we were watching explosive thunderstorm development in Illinois and Indiana on radar; cells went from non-existent to tornadic. This outbreak’s first signal of extreme severity happened at 3:14pm ET; at this time, Henryville, Indiana is struck by an EF-4 tornado. This tornado was on the ground for 49 continuous miles and killed 11 people. The thunderstorm that produced this tornado would produce additional tornado damage in northern Kentucky and southwestern Ohio later that afternoon.
NWS Louisville reflectivity/velocity radar imagery at 3:14pm ET 3/2/2012. A debris ball is shown in the reflectivity imagery at the left near Henryville, Indiana.
At 3:22pm, the National Weather Service in Wilmington issued their first Tornado Warning of the day for Carrollton, Kentucky and surrounding areas. At 3:44pm, that warning became the first ever Tornado Emergency issued the NWS Wilmington forecast office.
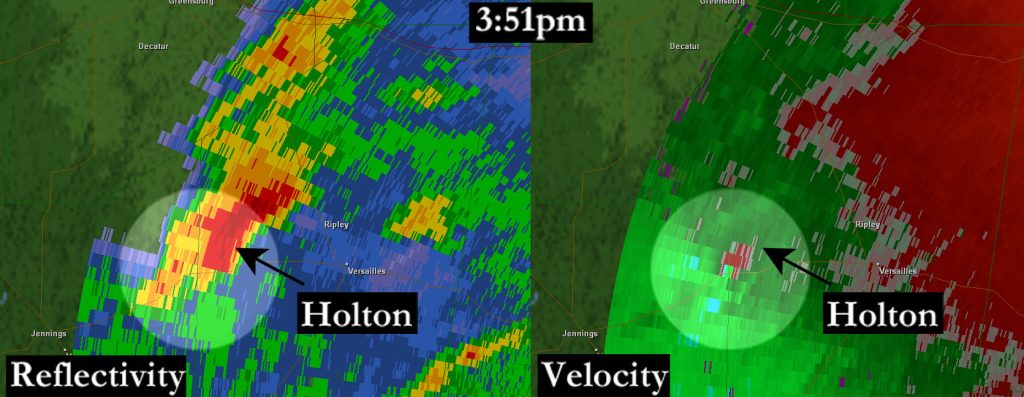
Meanwhile, a supercell in Jennings County, Indiana was rapidly rotating as it entered Ripley County. At 3:51pm, a developing EF-3 tornado took aim on Holton, Indiana. Tri-State residents Ron Pickett, Armando Hernandez, and Ted Tolbert were killed by this tornado.
FAA Terminal Doppler reflectivity/velocity radar imagery at 3:51pm ET 3/2/2012. Strong rotation is shown in the velocity imagery at the right near Holton, Indiana.
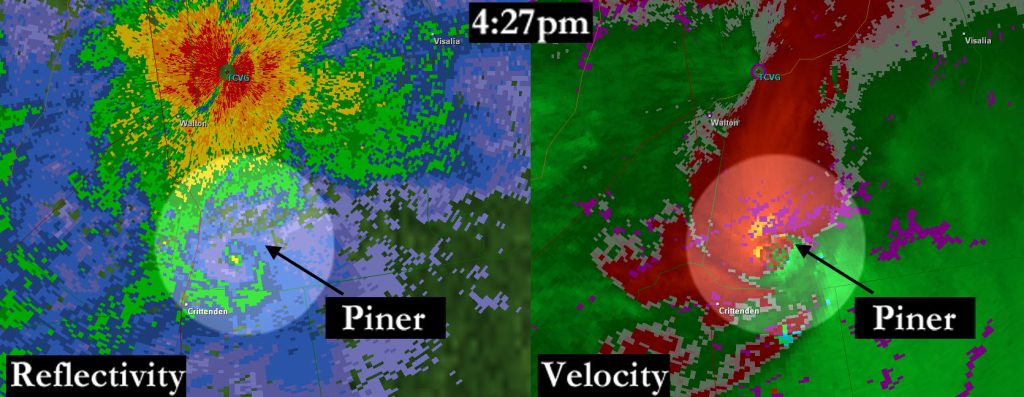
Back in northern Kentucky around the same time (3:50pm), a second Tornado Emergency is issued for areas near the I-71/75 split. I remember announcing on television that rotation in the supercell was increasing and preparing to cross I-75. A tornado was forming and moving east at roughly 50mph. At 4:27pm, debris from the EF-4 Piner/Crittenden tornado is detected by the FAA Doppler radar in south-central Kenton County. This tornado was the first tornado to be considered a violent tornado since the Blue Ash/Montgomery/Symmes Township tornado on April 9, 1999. Tri-State residents Don Beemon, Linda Beemon, James Brooks, and Courtney Stephenson were killed by this tornado.
FAA Terminal Doppler reflectivity/velocity radar imagery at 4:27pm ET 3/2/2012. Strong rotation is shown in the velocity imagery at the right near Piner, Kentucky. A debris ball is shown in the reflectivity imagery at the left near the same location.
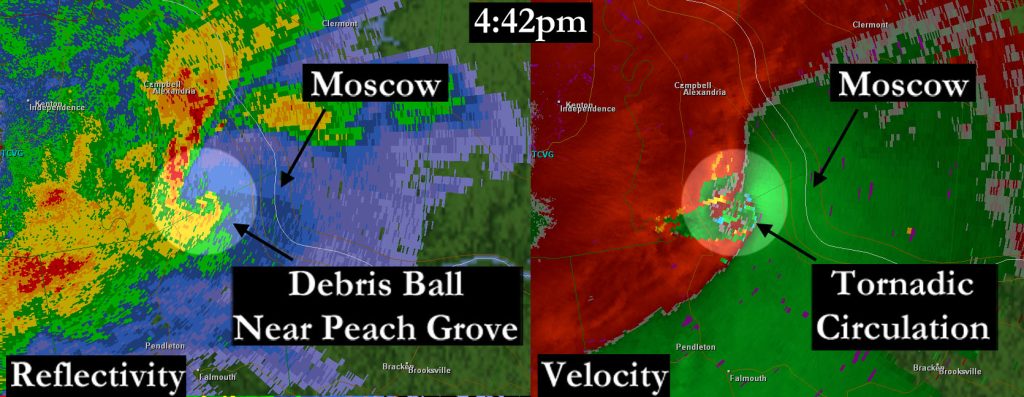
This supercell is not done. Radar showed tornado debris in southern Campbell County. This EF-3 tornado that formed in southern Campbell County would be on the ground for 23 miles into Clermont and Brown County, causing extensive damage in Moscow and Hamersville. Tri-State residents Carol Forste, James Prater, and Bill Adkins were killed by this tornado. The National Weather Service storm survey of this area also revealed a large area of 100+ mph straight-line winds near Peach Grove.
FAA Terminal Doppler reflectivity/velocity radar imagery at 4:42pm ET 3/2/2012. Strong rotation is shown in the velocity imagery at the right nearing Moscow, Ohio. A debris ball is shown in the reflectivity imagery at the left near the same location.
The death that I remember the most from that day was Bessie Baldwin’s. She was in her mobile home in Adams County. She was 99-years old. Had she not been in the path of that tornado or evacuated that day, she might have lived to 100-years old.
I hope you take a moment to think of the people we lost because of that day 10 years ago. Even though I have left broadcast meteorology, I still think of that day often. May it never happen again.
When I left broadcast meteorology on the last day of November in 2017, I was more than ready to go. I had been passed up for three promotions, yet I had the qualifications for all of them. I had an MBA secretly in my back pocket, and I took at job in the business world a few days after presenting a weather forecast in front of a chromakey.
Today, I leave that job.
When I joined, my focus was business intelligence – or a fancy way of saying “making business dashboards.” Over time, my position leaned into the decision scientist, data liaison, quality assurance, testing, database design, ETL, and algorithm development space as new data sources were created throughout the organization. I created a significant amount of value, and for only the second time in the last 1.5 years, I went into the office today. Since the pandemic began, this was my office 99.5% of the time:
After Christmas, I’ll start a new job. I’ll be going downtown often. I’ll be paying for parking. I’ll be in a room with people. I won’t be a SME for a while. It will be different, but here’s why I’m ready for it and how I know it was time and is time for a change:
Give yourself three strikes. There will be days of success, and there will be days with failures. When I started my job, I had a great boss, and we were aligned. But it was a matter of time before that boss was pushed out, the new one was looking to make a mark, and the personal and political attacks came. Strike one. I was fortunate to move to a new team that worked with my existing one. I got to do more of the things I was good at, but a personal passion of mine was to work in sustainability. For years, I talked to those in the organization about recycling, reducing overhead, and other environmental sustainability efforts; I won an award within the company for pitching some of these ideas. Finally, my company developed a sustainability arm, there was an environmental sustainability leader opening, and I applied. I interviewed as the only internal candidate, and I pitched my highly profitable ideas. Despite this, I didn’t get the job. I was very qualified, but no offer came. Strike two. A few months ago, I got assigned to 100% hands-on-keyboard development work. I get that the work needed to be done, and I saw – at a high-level – the importance of the project. But I’m not a developer; I’m a business guy who knows some things about data. Strike three. The search was on, and a great opportunity came. Each of the three strikes gave me pause and an opportunity to reflect. I don’t like seeing strikes, and – frankly – I hope I know I never see them. I, however, allowed myself a count and time for reflection along the way. Was this really want I wanted to do? Was this the environment that I wanted around me? Was this the cultural fit I needed to succeed? You know when it’s time to get off the field; one of those ways is getting three strikes.
Little things can matter. Is there flexibility in your job? Do you feel safe? Are you appreciated? Seemingly small things can have a significant impact on your happiness. In my “Strike Three” above, I was having a daily meeting with that team every day at noon (preventing me from going to lunch with other people and coworkers). This seemingly small daily meeting was a bottleneck. But there can also be sneakier bottlenecks or ones that wear you down over time. The phrase “merger and acquisition” is a bit of a misnomer; one often happens ahead of or without the other. When a company acquires another company, the merger piece takes time. When you work in a technology space, that often means you have legacy systems and new systems…and different credentials for each. These credentials expire over time. And there’s a possibility you can get locked out with the only way to get back in through a service desk and an IT ticket. Your productivity and success is a function of the tools you use, especially in a virtual, work-from-home world. Fatigue is real, and small tokens of respect – the “you get a lunch hour,” “thank you for your hard work,” and “I’m your boss, and I support you” matter. Along the way, assess your happiness as you work hard.
Personal and political attacks are a red flag. If you aren’t valued or respected, take it seriously. You should not be making repeated mistakes, but know that you can’t take on the blame for larger scale, organizational-level mistakes or missteps. Mistakes will happen; take ownership of them, but don’t take on unnecessary blame…especially repeatedly. If the blame is fair, accept it; if it’s not, it’s a signal of a bigger and more personal problem. Those that are volatile and excessively blame others are unlikely to do you favors, and those close to them are likely not worth your time either (and are probably feeding the monsters).
In time, you should be growing and – if you want to – advancing. I’ve learned a lot over the last 4 years, but I’m still in the same position. I want to advance in time, and I’ve found one of the best ways to do this is not vertically. When people talk about the “great resignation,” I think they are saying a few things: 1) there’s a lot of quantity but not as much quality of jobs out there, 2) the job and talent market is increasingly competitive, and you should strongly consider asking yourself if the benefits you have now are as good as you could get elsewhere, 3) people are realizing how stagnant they are, 4) people are realizing that they have at least some power in a world of large corporate influence, 5) one of the most powerful weapons employees have is to resign.
Happiness, joy, and success are still king. It’s pretty simple: are you happy? Are you successful? Are you joyful? Is what you today checking those boxes? If not, how are you going to get those checked? Can it be done in your current environment? How do you get there? Whether you think life is short or life is long, disappointment, frustration, anger, and sadness is no place to wallow; now is the right time to be happy, successful, and joyful…or at least work towards getting there. Go forth and find them!
Think of the cloudiest place you know. Is it Seattle? Or Buffalo? Or Portland, Oregon? It may be your neighborhood.
There are different ways to measure cloudiness, but looking at the really cloudy days gives an idea of often we are truly gloomy. In Cincinnati, we’ve had 41 days with an average daily cloud cover of 90% so far in 2021, 49 days with an average daily cloud cover of 100%, and 90 days with a 90%+ cloud cover :
We’ll focus on these numbers here, but – as an aside – is this year cloudier than most? The daily average cloud cover so far in 2021 is 61%, but this is not as cloudy as 2017, 2018, 2019, or 2020 year-to-date:
But lets go back to the thought of 90%+ and 100% cloud cover days. Are we cloudier than other long-term climate sites near Cincinnati? For comparison, Cincinnati has had 90 and 49 days of each, respectively, so far this year. Dayton has had 87 90%+ and 49 100% cloud cover days so far in 2021:
Columbus, Ohio has had even fewer of those days (87 90%+ and 42 100% cloud cover days):
The counts for Indianapolis are even lower (76 90%+ and 43 100% cloud cover days):
It’s clear we’re in a local maximum for cloud cover, and I intentionally highlighted areas to the north that are closer to the Great Lakes and in colder air…suggesting the possibility for cloud cover, especially in the colder months of the year.
So maybe if we go north and away and far away from Florida, it’ll get cloudier than Cincinnati, right? Chicago’s 90%+ and 100% cloud cover day count is 40 and 40, respectively:
Maybe it’s cloudier in the tundra of Minneapolis?
Counts are even lower there compared to Cincinnati! Maybe downwind of Lake Michigan? Nope. There have only been 36% completely overcast days in Grand Rapids, Michigan so far in 2021:
Alright…clearly Cincinnati is a cloudy place. But what about the Pacific Northwest? It’s known for its gloom, right? Portland, Oregon has had 29 completely overcast days so far this year, and 78 days with 90%+ cloud cover:
Maybe Seattle is cloudier? While Seattle has had more 90%+ cloud cover days than Cincinnati, Cincinnati has had 11 more 100% overcast days than Seattle year-to-date:
So…where is it cloudier? There are cloudier places! Three cities in the United States that are cloudier than Cincinnati are…Rochester, New York:
…Pittsburgh, PA (with 101 90%+ cloud cover days so far in 2021):
…and Detroit, Michigan (with 107 90%+ cloud cover and 56 100% cloud cover days year-to-date):
So I suppose it could be worse, right, Cincinnati? We are – by some accounts – cloudier than Seattle, but there are at least a few places gloomier than the Queen City.
I was 11 years old. I was so young that I remember playing with Legos on the family room floor. At the time, I found it a point of pride to answer the phone in the house, but at 5:15pm that day a quarter-century ago, I didn’t know that the man on the other end of the phone would reply “Ummm…is your mother there?” and likely be a police officer or firefighter looking to deliver terrible news to my family. That evening was a blur, with friends and family coming to the house, and me being whisked away with the distraction of games and other fun activities.
My father and I at Kings Island, around 1990
As I discussed in a blog post back in 2015, my father was a passionate pilot who came to Cincinnati in 1979. Nearly all of the planes he flew were based at Lunken Airport, and that’s where I spent a weeks of my childhood with him. We also traveled as a family a lot; I look at my time like the career of The Beatles: a partnership built on love and care with many good memories but which also ended too soon. He died in a plane crash on September 17, 1996.
Now 25 years later, I have learned a lot from my father’s death, but I also have many questions. Because of my loss, I’ve also had to help, assist, or grow with people who have experienced tragedy. If you’ve lost someone you care about – whether it was recently or years ago – I want to share some things I’ve learned as an unfortunate veteran of loss.
1) It’s okay to grieve, and you should grieve. Weakness – including sadness of frustration – areoften dismissed or frowned upon in the world. There is a seemingly constant pressure everywhere to be strong and resilient. But – despite what everyone tells you – you should and must grieve when you experience a loss. Pushing hard-to-deal-with feelings aside only prolongs and delays the pain and keeps the healing that it found through hardship away. If you don’t take the time to process the loss or emptiness you’re feeling, your grief will just be waiting for you until you get to it, and the lack of resolution within will bring you down eventually. Grieving is not something you should fear; in the end, you’ll see that it was a path to your own peace. If you’re a person of faith, know that Matthew 5:4 says “Blessed are those who mourn, for they shall be comforted.”
2) You’re going to need to re-visit grieving sometimes. During the pandemic and through months of stress and strain, I realized that I never fully grieved. Grieving isn’t a process you go through and just put away; losses you experience – to some degree – last a lifetime. There will be many times you realize you didn’t resolve all of the issues or needed help. I wish my father was around when I was growing up to teach me about relationships or how to deal with highly political job environments. It would have been nice for him to guide me through career changes, too. He wasn’t here, and sometimes it’s just nice to have that voice to guide you…including when everyone else is quiet. In those moments, it’s easy to get frustrated or even angry. Why did he or she leave? Why where they taken from me? You can’t be too busy to work through it; you need to talk to someone, but you also need to understand that you can’t just deny feeling sad or frustrated – which you should be. You didn’t know that 20 years after they were gone that you would win an award and they would not be there. You didn’t know that after a tragedy would come a celebration that just felt emptier than usual because you just lost someone. There’s no way around it; you must work through it. Grieving is like rest; when your body and mind need it, there’s no substitution for it. And when you help others with your grieving, you’re going to need something constructive – perhaps even your own grieving – to heal and recharge.
3) Mentally prepare yourself for supporting others and their losses that may be bigger than yours. I remember I was in college when I got a call from the family member of a close friend. He said my friend wanted to see me immediately. He was grieving. His sister had just killed his mother, and he said I could help him with the grieving and calm him down. While I was happy to help my friend, my loss was far more extreme than mine. I had lost my father suddenly, but he had just lost his mother and likely contact with his sister for many years to come. How was I to help a friend through this? Somehow, when I walked up to my friend minutes later, I assured him we would get through this no matter how awful things seemed right now and gave him a hug. Outside of sleeping, I spent the days that followed sitting next to my friend. That experience reminded me that giving someone a hug, holding someone’s hand, and listening to them helps both you and others grieve. You don’t have to solve their problems, even if they are bigger than yours or what you think you can handle; the goal is to be their friend and support them unconditionally.
My father and I in Vancouver, Canada, 1994
4) Life goes on quickly for others and far more slowly for you. By the way, no one tells you this, and it’s frustrating. A week after my father’s death in 1996, I went back to school. People were happy to see me, but they didn’t know my father, and they didn’t understand my loss. From their point of view, I was just not at school for a week. My teachers came to my father’s funeral, but – again – they were just there to support me; my loss was not their loss. In hindsight, all of the adults that came to my father’s funeral and visitation over the previous weekend were back to work on that Monday; they were likely sad or still reflecting that day, but some had moved on. Fast forward to the clock 6 or 12 months in the future, and even more people had moved on. They were healing a lot faster than I was. At some point, your life, too, must continue. Being alone or isolated in your healing is not ideal. You’ve been dealt a blow, and it doesn’t seem fair. But this reality means it is important for you talk to someone, including a medical professional. There is no shame in talking to a psychiatrist or psychologist. Talking to friends is good, too, but you must quickly realize that they will grow tired of listening, especially without incremental progress; friends are not designed to keep you afloat after a significant tragedy or loss. As this blog post shows, you are not alone. A network of friends will help, but your help from them will be limited. Do not hesitate to talk to someone, and stay connected to the ones you love.
5) Keep your memories in a form that is up to date. I still have the C-tapes where my father recorded home movies. Physical media breaks down over time, so those C-tapes have gradually worn out. During the years I was grieving, recovering, and going through life, my memories on video have been sitting in a drawer…slowly breaking down. I realized this a couple of years ago, and I have converted over many of the individual tapes thus far. Those tapes are one of only a few ways I can hear my father’s voice again. I’m glad I remembered about these tapes and got the tools to keep the memories alive; I encourage you to do the same. Put your memories in a form where you can enjoy them for years to come. More importantly, keep a record of dates, times, and who is in the photos and videos you keep. You may not want to hear this, but other people you may know may die in the years that come; this is a reminder to not just treasure your time with them, but this is also a reminder to use their knowledge to help you know as much as you can about your memories. Who is in that photo? When was that video taken? Is there a good story that goes with that photo that you’ll want to tell your kids?
My father and I on the observation deck of the World Trade Center, 1992
6) A loss is a great time to see who really cares. When the funeral is over and people have to go home to their home and job, who will still contact you? Who will send cards? Who will call and see if you’re OK? Who actually cares about your happiness and well-being? A loss or tragedy can really do a number on you, but it’s also a teaching moment. You deserve friends that care and want you to be happy. Don’t make drastic moves, but take note of who just says “I’m sorry for your loss” and who actually cares about your health and peace.
7) Your mind will likely work differently after a significant loss. The times of loneliness in life seem longer than the times of joy. You’ll spend many hours of your life after a significant loss searching for answers, trying to understand why the healing isn’t coming faster, why you don’t feel better, why others around you never seem to bear the burdens you have, and why everyone else has seemingly forgotten about the loss you all just went through. You may also wonder what you could have done to prevent your loss. Why did my father go flying that day? Why did he fly an experimental plane? Why didn’t he tell me about that plane? I could be angry and upset; I have every right to be. But I’ve also learned that I could better spend my time talking to a professional, talking to a friend, or grieving. Your loss is part of your story. Being bitter will not help you; you can’t just wish them back. Life goes on, not backward. Your story, however, will be different because of the losses or tragedy you experience. Let that be your strength, not a weakness.
8) Days will get better, but the loss never completely goes away. As you get older, the memories become less clear, the number of days you don’t think about them or think about them as much increase, and the pain and frustration go down. Despite this, there will be days where you wish you were there to learn from or listen to the person you lost. Some days will feature reminders of those you lost, and some days will go smoothly without these memories entering your mind. As days go by, you also see what people told you along the way – “you will get through this,” “brighter days are ahead,” and “life goes on” – become true.
One of the last photos ever taken of my father in Alaska, 1996
I’ve learned a lot about happiness, success, and joy in the last few years. Many would say my father died doing what he loved. He did love flying, and it brought him joy. I could be upset from losing him in my life, but I – instead – am thankful for the limited amount of time we shared; we accomplished a lot in our years together. In time, you have to find a way to let the pain go and focus your life on what is good.
If you’re thinking 2021 has been very cloudy, you’re right. Including today (which is likely to change with late day sun, but we’ll use data through 4pm today), today was the 10th completely cloudy day in Cincinnati:
We’ve not only had 10 days with 100% cloud cover in February; we also had 15 days with no sunshine in January:
This means we’ve had 25 days so far in 2021 with no sunshine:
That also means 47% of all days so far this year have been cloudy, and 88% of all days so far this year have had more clouds than sun. Is this unusual? It is. Through this date in 2020, we only had 20 completely cloudy days, but 86% of all days through February 22nd had 50% or more cloud cover:
2019 had a similar start through this point in the year; there were 21 days with no sun, and all but 5 days had clouds winning out:
2018 YTD had fewer 100% cloudy days, but only 9 out of 53 days had less than 50% cloud cover:
Compared to 2018, 2017 year-to-date had fewer days with more sun than clouds:
2016 had a more even distribution of days by average cloud cover and fewer overcast days:
Recent history would suggest that it’s not unusual to have more clouds than sun in February, but 2021 so far has been among one of the cloudiest. The average daily cloud cover for Cincinnati month-to-date is about 80%, and only one February – 2018 – has been cloudier:
…and the year so far is also quite cloudy compared to other recent years. Only 2019 – with 57% of all days through this point in the year having 90%+ cloud cover – beats 2021:
A big reason why it has been so cloudy recently is the amount of snowfalls. Despite being about 1/2″ behind average for total precipitation in February so far, nearly 22″ of snow has accumulated so far this month in Cincinnati…and when it snows like that, it will be cloudy:
The only next few days will be slightly brighter than the month so far, but a mix of sun and clouds is about as soon as it gets through the middle of next week.
Just before 6pm on Monday, February 15th, I posted these words on social media: “Trolls and haters…this is your time to shine, and bring your worst.”
And they came.
Nice modelcast. Must be nice being paid to report what garbage models say. Try forecasting Not reading models. Sunday this scenario became apparent with a layer above freezing at 850mb
yep, total bust. but then again, it isn't my profession. biggest issue I see is the hype for marketing purposes. No one wants to say "we really only blend models and with these storms we really don't know what will happen because the result is within our margin of error."
There is no denying my forecasts for snow in the days leading up to the event were very different than reality. And just so we’re clear, here’s what I had forecast last night:
This is a large amount of snow for the Cincinnati area. But note that I have lower totals to the east where I felt sleet and freezing rain would be mixing in. Models become increasingly more aggressive with the presence of sleet – at the expense of snow – by midday Monday, and my forecast had changed:
By this point, sleet was falling, and I had accounted for the sleet and freezing rain rain accumulations…but I hadn’t cut snow totals significantly yet. But what was with the sudden change?
Over the last few days, it has been very clear that we would have moisture moving into the Ohio Valley on Monday. Here’s a total precipitation (all precipitation types melted down to liquid) forecast through Monday from the NAM model run early Sunday:
So we we’ll have precipitation Monday, but how much of this is going to be snow versus sleet versus freezing rain? That depends on the temperature. In meteorology, you multiply the liquid-equivalent amount by a factor to create a “snow-to-liquid” ratio. A temperature near freezing would align with a snow-to-liquid ratio of 10:1, but temperatures in the low 20s would support a ratio of 12:1-17:1. And remember, some of that liquid-equivalent could be rain, freezing rain, or sleet…or a mix of all of those. Let’s assume the 0.66″ is right and all snow, though. Here’s the snow-to-liquid ratio math for 0.66″:
If this 0.66″ is right, a forecast of 6 to 12″ is appropriate, but you want to be as specific as possible. 8-12″? 6-9″? But what if this 0.66″ isn’t right? What if it’s 0.40″ of total precipitation? Here’s the math on that:
That’s a lot less snow. If the models went from 0.66″ to 0.4″ (a drop in 0.24″) of precipitation, your snow totals are probably going to go down by at least a couple of inches. In reality, 0.2″ of liquid-equivalent fell at the Cincinnati/Northern Kentucky International Airport between 1pm and 8pm Monday! Many models – so far – are not close with this total.
Let’s revisit the temperature issue, including in the vertical. Here’s what the same model (Sunday’s 7am NAM model) is showing for the vertical temperature profile for 10am Monday morning:
This a complex graphic, but know that altitude increases moving to bottom to top in the graphic, and the red line is the temperature. The red line is left of the 32° line, and this mean the temperature is below freezing (and at least by several degrees) over a large depth of the atmosphere. This suggests we will see snow and avoid freezing rain, sleet, and rain.
Fast forward the clock to 7am Monday morning. Here’s the actual/observed temperature profile from Wilmington, Ohio:
The surface temperature is close to what is shown above, but note the temperature line (red) is closer to the freezing line (blue) compared to what is shown above. The temperature, though, is still below freezing, so snow is still the focus.
Let’s fast forward the clock to 3pm Monday. This is same model (NAM) but only looking 9 hours into the future from when the model was ran. It has a temperature near 32° just a few thousand feet above Cincinnati. This layer of air is warming.
Suddenly, our forecast for snow is not looking as good. Remember, this is a modeled temperature profile. Weather balloons only get launched early in the morning and early in the evening. Monday evening’s weather balloon launch from Wilmington, Ohio shows even warmer air aloft:
Courtesy: NWS Wilmington
Uh, oh. The temperature is a few degrees above freezing 6,000′ above the ground. This means snowflakes well above the ground are falling into this warm layer, melting, and then refreezing as they fall several thousand feet toward the ground. This is also known as sleet. Of the total precipitation that falls, more of it is falling as sleet (and less as snow) when this happens. This is a key reason many didn’t get slammed with snow. Many models were too wet with this system, and many did not capture the warm air invasion/advection aloft.
You may say: “Well, Scott, aren’t you a meteorologist? Isn’t it your responsibility to see this?” And to that I say…with what? How do I know what the temperature is at 7,000′ above the ground at every hour of the day? As I said above, weather balloons are launched twice a day in Wilmington, and the morning weather balloon was suggesting snow. How about data from an airplane? That data does exist, but it’s expensive and not publicly available. Plus…an airplane has to sample that air. So how would I know about this temperature change aloft as a forecaster? I must – in part – follow model guidance to see this. I can review guidance and compare it to reality (surface reports, satellite, radar)…but to a point. I can’t see, sample, or collect everything. And today, the things I couldn’t see….temperatures a few thousand feet above the ground and how much precipitation would fall…were not something I could understand without modeling.
The impacts of this system were good (roads were terrible, visibilities were reduced, accidents happened), but the precipitation type and amounts were off. And now you know why it’s not as easy as it looks.
Does this month seem cloudier than usual to you…or does it just feel that way?
Tuesday was the 13th day of January 2021 so far with 100% cloud cover between sunrise and sunset:
In other words, half of all of the days this month have had no to extremely filtered sun. There have only been two days so far this month with more sun than clouds during the day. Is this unusual?
The average of the average daily cloud cover for January 2021 so far is 78%. Compare that to 80% for all of January 2020 and 2019…and the 85% average daily cloud cover for all of 2017. This month has been cloudy, but three January’s since 2011 have been cloudier. As a first pass, January 2021 actually hasn’t been that cloudy for January standards; this is because January is often a very cloudy month.
What’s the story with January 2020, 2019, and 2017? January 2020 only had 11 100% cloud cover days, but 90% of all days (28 out of 31) had 50% or more cloud cover:
January 2020 was quite wet, with 4.14″ of precipitation. January 2019 had 14 completely cloudy days but only 6 days with 50% or less cloud cover:
January 2019 was also an active weather month with 4.11″ of precipitation. January 2017 had less precipitation (3.67″, which is 0.67″ above the monthly average), but it was quite cloudy. 81% of all days in January 2017 had 80% or more cloud cover:
There is a loose relationship between monthly precipitation and cloud cover for the month overall (of course, it’s not that simple). Interestingly, there was less than an inch of snow accumulation in January 2020 and only 4.2″ of snow accumulation (that’s below the monthly average of 6.5″) in January 2017. January 2018 had more snow accumulate (6.2″) but had less cloud cover.
Hang in there; the average daily cloud cover will increase in the next few months. Over the last few years, average cloud cover in February has centered between 70 and 90%:
By May, percentages drop to the 60 to 75% range:
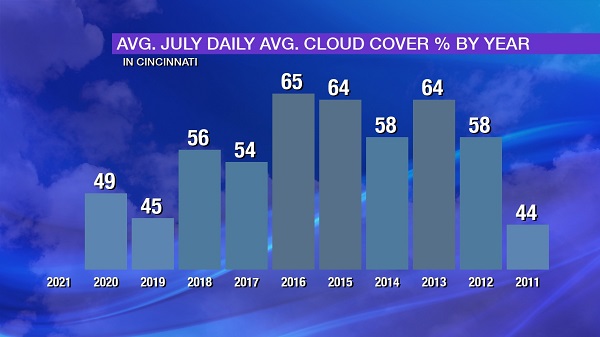
By July, these percentages drop into the 45 to 65% range:
Data confirms brighter days are ahead, but this will be a gradual transition spanning the rest of the winter and spring.
Several people have reached out to me on social media recently about how cloudy this year, winter, spring, or month has been in Cincinnati. Does the data support it? How do we answer this question?
Quantifying cloud cover is difficult because clouds in the sky appear at different layers and with different opacities. One way to measure cloudiness for a period of time is by looking at the average sky cover between sunrise and sunset. This definition is particularly convenient since it is calculated daily by the National Weather Service for long-term climate sites like Cincinnati. For this analysis, we will use this average sky cover metric which is defined as:
The average sky cover between sunrise and sunset in tenths of sky covered. The minimum of “0” (0%) means no clouds observed, “10” (100%) means clouds covered the entire sky for that day. (Source)
Admittedly, data quality is not great from 2010 through 2013, but it is better for more recent years. Also, we’ll use 4pm on May 11, 2020 as cut-off time for this analysis
There are many ways to present the data, so let’s start with just the month of May:
We’re 11 days into the month and 10 out of 11 days (91%) have had at least 50% cloud cover. Is May usually this cloudy? Does it seem more cloudy than last May? Here was the distribution of cloud cover in May 2019:
About 84% of all days last May had 50%+ cloud cover, and 22 out of 31 May 2018 days had at least 50% cloud cover:
There were 23 days in May 2017 with more clouds than sun, and 15 of those had at least 70% cloud cover:
May 2020 is young, but if the month had ended today, it would be the cloudiest May in the last several years:
It is worth noting that early May tends to be more cloudy than late May with temperatures rising and a lean from stratus to cumulus clouds…so this average of 70% cloud cover is likely to change and will probably decrease.
How about the year to date so that we can make an apples-to-apples comparison of this year to previous years? So far in 2020, there have been 38 days with 100% cloud cover (Monday was one of them):
Also note the left-leaning tail on the data towards more cloud cover. 81% of days so far in 2020 have had 50% or more cloud cover. In 2019, about 82% of days through May 11th had 50% or more cloud cover; we also had 4 more days with 100% cloud cover through this point in 2019:
Through this point in 2018, there were 15 days with 20% or less cloud cover…compared to 5 days in that same time during 2019 and 2020:
From a year-to-date perspective, 2017 had more 50%+ cloud cover days than 2018, 2019, or 2020…but fewer 100% cloud cover days than those same years:
Finally, 2016 year-to-date had relatively few overcast days compared to 2020, 2019, 2018, and 2018:
How does the average daily cloud cover so far this year compare to other recent years? We’re averaging about 74% cloud cover each day in Cincinnati thus far in 2020; this is about the same as it was in 2017, slightly more than in 2018, and slightly less than in 2019:
I will remind you that data quality issues affect the averages from 2010 through 2013, but it is clear that the last four years-to-date have been cloudier than the four that came before it. So what is driving this? This is not an easy answer, but here are some high-level thoughts:
March 2020, 2019, 2018, and 2017 had 8, 10, 11, and 7 completely cloudy days respectively compared to 8 in March 2016, 8 in March 2015, and 2 in March 2014.
March 2020 had no days with 0%, 10%, or 20% cloud cover.
February 2020, 2019, and 2018 had 11, 9, and 14 100% cloudy days whereas February 2017, 2016, 2015, and 2014 each had 5 to 8 completely cloudy days.
January 2020, 2019, and 2017 all had left-tailed cloud distributions, whereas 2018, 2016, and 2015 had more even distributions.
Overall, cloud cover in January, February, and April between 2017 and 2020 was a couple to few percentage points higher than in those same months of 2014, 2015, and 2016
Relative to averages, precipitation surpluses are 2.85″ and 0.94″ since January 1st and March 1st, respectively. It makes sense that a wetter than average start to the year is likely a frequently cloudy start to the year as well.
The more complex answer is not as easy to pinpoint. Temperatures several thousand feet above the ground have an impact. The timing of weather systems, wind speeds at the ground and aloft, and snowpack can all influence cloud cover.
And, in case you’re wondering how Cincinnati’s 38 days so far in 2020 with no sunshine compares to other cities…
Denver has has 3 of those days:
Minneapolis has had 25…
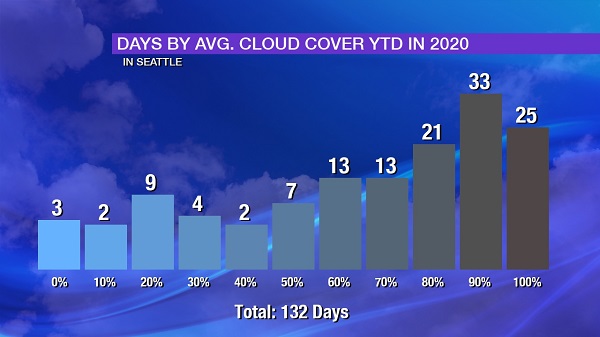
…and the infamously cloudy Seattle, Washington has had 25: