Cincinnati Winters That Follow Federal Government Shutdowns Tend To Be Snowy And Cold

For the last few days, there has been a lot of focus on the federal government shutdown. National parks and non-essential government employees have felt the effects of this shutdown. Like it or not, many are speculating that the government shutdown could continue for at least a few days or even weeks.

With all of the focus on the consequences of the shutdown, I thought I would try to lighten the mood and see if there was a correlation between a government shutdown and how much cold and snow Cincinnati got in the winter that followed. Ian Livingston of the Washington Post’s Capital Weather Gang looked at a similar correlation (just for the Washington D.C. area), so I tip my hat to him for this idea.

In the modern era (since the mid 70s), Cincinnati winters that follow a federal government shutdown are usually colder, snowier, or both colder and snowier than average. For the sake of this discussion, “winter” is considered to be “meteorological winter,” or December, January, and February only.

Here are winter snowfall totals in Cincinnati following a federal government shutdown:

oct3-wintertemps

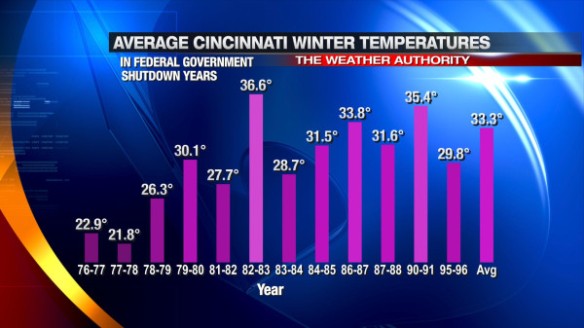
Only 3 out of the 12 winters shown above were warmer than average. Note that the second coldest and coldest winters on record (1976-1977 and 1977-1978, respectively) are listed. The average of all of the “shutdown winters” above is roughly 3.2° below average, although the brutal winters of 1976-1977 and 1977-1978 pull the average down significantly; without these two years included, the “shutdown winters” average is about 1.7° below the seasonal average.

What about snow? Here’s a list of snowfall totals in the winter following a federal government shutdown:

oct3-wintersnow

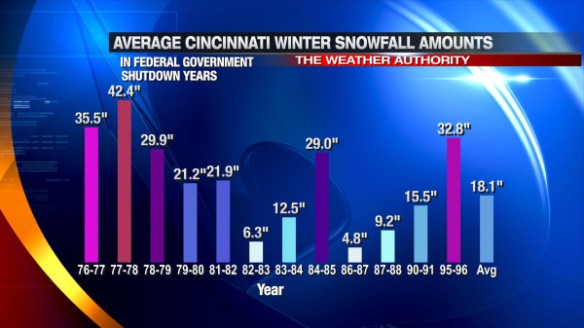
Only 7 out of the 12 “shutdown winters” above were snowier than average. The average of all of the “shutdown winters” above is roughly 3.7″ above average, although the brutal winters of 1976-1977 (5th snowiest all time) and 1977-1978 (snowiest all time) pull the average up significantly; without these two years included, the “shutdown winters” average is only 0.2″ above the seasonal average.

7 of the 12 “shutdown winters” were both colder and snowier than average.

Of course, this exercise is all for fun. A government shutdown does not mean we will get a certain type of winter. A winter forecast will be developed in the days and weeks to come; look for it later this year.

2013 On Pace To Be One Of The Quietest Severe Weather Years On Record

I’ve blogged about this before because it continues to amaze me with each month that goes by. After a record number of Tri-State tornadoes in 2012, this year has been a very slow one for severe weather. In fact, 2013 will be the quietest year for severe weather in the Tri-State on record by most measures.

How do Severe Thunderstorm, Tornado, and Flash Flood Warnings so far this year compare to average??

oct2-fewwarnings

The current Tri-State Severe Thunderstorm Warning count of 61 this year is tied (with 2005) for the fewest Severe Thunderstorm Warnings issued in a year (since the National Weather Service in Wilmington started issuing warnings for the Tri-State in 1995):

oct2-svryear

19 Flash Flood Warnings have been issued in the Tri-State so far this year. While our Flash Flood Warning count is likely to be below average this year, there have been several years since 1995 with fewer Flash Flood Warnings.

The statistic that continues to amaze me is the fact that no Tornado Warnings have been issued in the Tri-State so far this year. Since 1995, we have never gone an entire year without at least one Tornado Warning being issued in the Tri-State; in fact…since 1995, at least one Tornado Warning had been issued somewhere in the Tri-State prior to July 28th. For perspective, 24 Tornado Warnings were issued in the Tri-State through this date last year.

Here’s a comparison of Tri-State Tornado Warnings issued by year since 1995:

oct2-toryear

The only thing better to see than 0 Tornado Warnings in a year is 0 confirmed tornadoes in that same area. If we don’t see a confirmed tornado for the rest of the year, 2013 will be the first year since 1987 without one:

oct2-confirmedtornadoes

We need to thank our lucky stars for a boring severe weather season. After going through deadly tornadoes last year (including March 2, 2012 – the deadliest severe weather day in the Tri-State since official tornado records began in 1950), we needed a year to rebuild and regroup.

The last tornado in the Tri-State was on September 8, 2012…389 days ago. Let’s hope we make it another 389 days without a tornado.

What To Expect In October In Cincinnati

Welcome to October! Today is the first day of the second month of meteorological fall. October, like many months in the Ohio Valley, is a month of change; the most drastic change is in the temperature. While each October is different, the average high temperature drops 11° and the average low temperature drops 10° from October 1 to October 31:

sep30-averagehilo

The gradual drop in temperatures – especially low temperatures – signals an increase in the likelihood of frosts and freezes. Historically (1870 to 2012), the majority of first fall frost and first fall freeze events occur in October:

sep30-frostfreeze

In October, extreme cold is very rare in Cincinnati. The temperature has only dropped into the teens 3 times and below 30° 128 times in October since 1870. On the flip side, 90°+ heat is very rare in October. The temperature has hit 90° 6 times in October since 1870. In most years, the last 80°+ day of the year in Cincinnati is in October; the average last 80°+ day of the year is October 8th.

On average, October is the 4th driest month of the year in Cincinnati. September is the typically the driest month of the year, and the average monthly precipitation total increases from September to October and slightly from October to November:

sep30-precp

Like it or not, snow becomes a possibility in October. The earliest flurries have fallen in Cincinnati during the fall was on October 12, 1917. The earliest autumn day with measurable snow in Cincinnati was on October 19, 1989. Here are the earliest fall dates where measurable snow fell in the Queen City:

sep30-earliestsnow

What Does October 2013 Look Like?

The latest outlook from the Climate Prediction Center released Monday suggests the Ohio Valley, Great Lakes, and New England will likely be warmer than average in October:

sep30-cpcoutlook

Released Friday, the latest run of the ECMWF Weekly model suggests each week in October will be warmer than average despite a brief blast of Canadian air diving south late in the weekend and early next week. In fact, the latest ECMWF Weekly model suggests the week of October 16th will be abnormally warm over most of the country. The newest ECMWF Weekly model also suggests precipitation amounts will be near or below average in the Tri-State this month.