Spring Frost And Freeze Dates In Cincinnati

As a Cincinnati native, I find it very surprising that so many people that live in the Tri-State – including many natives – that don’t expect the temperature to drop near freezing in late April or early May. Hope springs eternal? Perhaps. While many cheer for warmth all spring, flowers almost always start blooming before the last 32° or 36° temperature of the cold season comes.

While a temperature to or below 32° is scored as a freeze, frost can develop at various temperatures. The temperature at eye-level can be 40°, but there can still be frost at your feet. At local airports (where the meteorological standard is used), the temperature is measured 2 meters (or roughly 6.5 feet) above the ground:

sep28-asos

Because relatively cold air sinks and relatively warm air rises, the temperature of the air below the temperature sensor’s height is likely below the temperature of the air at the temperature sensor’s height. If a plant was planted below the temperature sensor at an airport, it may be damaged or killed on a morning where the temperature sensor above it recorded a low of 35° to 40°. This is why Frost Advisories are issued when the temperature drops into the mid and upper 30s.

When does history suggest you’ll be able to plant your flowers and completely forget (well, virtually) about a killing frost or freeze? A sign at Natorp’s Nursery Outlet in Mason says:

apr23-frostfree

…but historical records suggest otherwise!

The latest freeze of the spring in Cincinnati typically comes in April, but we have gone the entire month of April without a freeze and had to wait until late May to get the last freeze of the season:

apr23-freeze

A freeze (hitting 32° or below) will kill plants very sensitive to the cold and severely damage plants sensitive to the cold. A frost, however, will damage – in full or part – plants sensitive to cold. Using a temperature of 36°, Cincinnati’s last frost of the spring typically comes in late April; historically, it has come as early as late March and as late as late May:

apr23-frost

Mother’s Day is usually a save bet for planting flowers; more specifically, looking at the forecast on Mother’s Day to make sure the temperature won’t drop below 40° is a save bet for planting flowers. Since 1871 (not including 1872 because those spring records are missing), the historical odds of the last spring frost (using a temperature of 36°) occurring during May in the Queen City is 32.8%. In other words, the last frost of the year comes before May begins two out of every 3 years.

So…back to the big question…when does history suggest you’ll be able to plant your flowers and completely forget about a killing frost or freeze? Based on records back to 1871, you’ll have to wait to late May to completely avoid a freeze and June 1st to avoid frost:

apr22-latest

Happy planting! But seriously, wait until Mother’s Day.

Why Local Weather Station Data Is Important

All weather is local.

Sure, patterns and cycles in the atmospheric impact the oceans, the patterns and cycles of the ocean affect the atmopshere, the larger scale features affect the smaller-scale features, and the smaller-scale features can effect the large scale features. But – ultimately – you care about the current conditions and the forecast for where you live. Not a state to the west, not a county to the west, not a city to the west, but where you live. And that’s why all weather is local. As a meteorologist, you must think globally and forecast locally.

A forecast for where you live is more likely to be accurate when we know the current conditions where you live. As George Carlin said, “I don’t know anybody who lives at the airport.” While reliable instruments for measuring atmospheric conditions – including the temperature – are often located at airports, the weather must also be understood away from airports. There are several airports in the Tri-State, but there are hundreds of thousands of people in our area that don’t live within 5 miles of an airport (and weather conditions can be dramatically different over a 5 mile span).

One of the most common ways to showcase local weather conditions is a temperature map. Rain or shine, people always care about the temperature. Here’s a typical temperature map you’ll find on Local 12:

apr14-blog-alltemps

Regardless of the source, it is incredibly likely that your community or one nearby is represented on this map. Nearly all counties are represented, and some counties have 2 or 3 temperatures listed. It is impossible to get all of the weather stations in the Tri-State on this map; this is about as full as it can get.

But what is the source of this temperature data? The simple answer is: “there are multiple sources.” The more complex answer is below.

There are eight airports in the Tri-State that have an Automated Airport Weather Station (ASOS) or Automated Weather Observing System (AWOS) that share data with the FAA directly. These observations are taken under strict standards; for example, temperatures are measured 2 meters above the ground and wind speeds are measured 10 meters above the ground. These sites also report the visibility. Outside of maintenance and occasional power outages, these sites share observations 24 hours a day, 7 days a week, and 365 days a year:

apr14-blog-asostemps

While those sites are very reliable, Remote Automated Weather Station (RAWS) sites are also run 24 hours a day but report just basic weather conditions (temperature, winds, dewpoints, etc.). These RAWS sites are run by the U.S. Forest Service and Bureau of Land Management to monitor wildfire potential in and near national forests. These sites always report once or twice an hour with no exceptions (including special reports for strong winds or severe weather). There are three RAWS sites in the Tri-State (Crittenden, Big Oaks Refuge, and Shawnee National Forest):

apr14-blog-rawstemps

The Shawnee National Forest RAWS is not displayed to make room for West Union’s temperature (see below).

Roadway Weather Information System (RWIS) sites are operated by state transportation departments, including the Indiana Department of Transportation, the Ohio Department Of Transportation, and the Kentucky Transportation Cabinet. These sites measure atmospheric conditions as well as pavement conditions (wetness, temperatures, etc.):

apr14-blog-rwistemps

The Kentucky Mesonet is the official climate network of Kentucky and is operated by Western Kentucky University. Most counties in Kentucky have a site, and they are positioned to measure temperatures, wind speeds, rainfall amounts, and dewpoints in areas away from airports and other major observing sites:

apr14-blog-kymesonettemps

The Kentucky Mesonet site in Burlington is not shown to make room for the Cincinnati/Northern Kentucky International Airport and Union weather station data.

The temperature map is pretty full with temperatures already, but there are several communities we have left out so far. To fill in the gaps, we use personal weather station data. More specifically, owners of a personal weather station (that they bought) have configured their weather station software to share data with us. With the exception of Lebanon and Falmouth, the data shown on Local 12 from these sites come from personal weather stations:

apr14-blog-othertemps

Temperatures listed for Falmouth and Lebanon come from the AWOS at the Gene Synder Airport and the Lebanon Airport, respectively. These observations, however, are not sent directly to the FAA and the NWS through a certified channel; they are sent to us through a secondary data stream NOAA operates called MADIS, or the Meteorological Assimilation Data Ingest System.

Remember, the temperatures on the maps above are just the ones that fit on the map. There are dozens of other sites in our area that we monitor.

With ASOS, AWOS, RWIS, RAWS, and Kentucky Mesonet sites in the Tri-State, why is there a need for personal weather station data? It all comes full circle: all weather is local. Personal weather station data shows us small-scale wind, precipitation, and temperature changes. These personal weather station stations can and have verify Severe Thunderstorm Warnings and Flash Flood Warnings. Also, higher-resolution, modern computer forecast models analyze local weather station data and may incorporate the data into the model.

If you own a personal weather station, please consider sharing your data with the Citizen Weather Observer Program. If you use software to upload your weather station data online, odds are good that you can share your data with CWOP. Step-by-step directions for sharing data from popular weather stations and their software to CWOP can be found here: http://www.srh.noaa.gov/epz/?n=cwopepz. Many towns and cities don’t have a weather station reporting at this time.

If you have any questions about which weather station to buy or how to share data with CWOP, please don’t hesitate to ask in the comment section of this post.

Thunderstorm Myths

There are numerous misconceptions and myths about thunderstorms. “Lightning only strikes tall objects,” “people struck by lightning carry an electrical charge,” and “it is okay to showers during a thunderstorm” are some of the common misconceptions. I am not here to discuss these; instead, I want to highlight some of the challenges meteorologists face during active and severe weather. While reports are valuable to us, there are a lot of beliefs about storms and reporting storms that are not true, such as:

apr13-blog-myth1

While radar is a powerful tool, it is not a pair of eyes. Radar can but often does not confirm tornadoes. Radar suggests where damaging straight-line winds are likely, but it doesn’t confirm them. Radar data suggest where heavy rain has fallen, but it doesn’t replace what a rain gauge measures. Simply put, radar, models, satellite, and weather balloon data are great, but it doesn’t always verify the conditions where you live. In fact, your report is more important than anything a meteorologist can access at his or her fingertips. Please don’t assume someone else has reported what you are seeing because you may the only one seeing what you are seeing. Always report out-of-the-ordinary weather.

apr13-blog-myth2

Thank you for your report. Seriously! We need to know what you are seeing! Radar doesn’t always tell us the story. When you submit your report, however, please be specific about what you are seeing and where. Where are you located? Are you in a town, and how far/what direction are you relative to that town? A photo of hail or damage is great, but a photo with a detailed description of where you are (i.e. “I’m 2 miles west of Oxford, Ohio”) is FAR more helpful. In addition to knowing where you are, I want to know what you are seeing specifically. If you are seeing hail, how large is the hail compared to a coin? Why do I ask this? Because coins are all the same size; a quarter in California is the same as a quarter in Ohio. I need to know how big your hail is compared to something absolute in size. I don’t know how big your hand is. I don’t know how big your finger is. I do, however, know how big a golf ball is.

Also, please let me know what time severe weather occurred. Sending me a photo at 5:30pm of damage that occurred at 5:25pm is helpful, but sending me a photo at 5:30pm of damage that occurred at 2:30pm is not as helpful, especially if there are numerous rounds of storms; I don’t know what storm likely caused the damage unless you can confirm when the damage occurred.

apr13-blog-myth3

You might. If you’re seeing a violently rotating cloud extending from the base of a thunderstorm that’s connected to the ground, you are seeing a tornado. If you’re not seeing this, you’re probably not seeing a tornado. You may be seeing a tail cloud, a funnel cloud, a wall cloud, or another type of cloud. After going through spotter training, you’ll know the difference between these types of clouds. There are a lot of tornado look-alikes. There’s actually a “Scary Looking Cloud Club.” While these clouds may look like tornadoes, they are not.

apr13-blog-myth4

I am sorry. I really am. I don’t want to have to interrupt your program to tell you there is a threat for damage. I don’t want to cut into your favorite show to tell you there may be a tornado coming towards you or one of your neighbors. But if it’s a life threatening situation, I have to cut into your program. It’s not just a standard set by television station managers, but it’s also the right thing to do.

I understand you may not be in the warning, but someone nearby is; they deserve the warning just as much as you do should your town been placed in the warning. Please understand that my job – ultimately – is to make sure you stay safe. If you’re going to see severe hail, severe winds, or a tornado, you not only deserve to know, you should want to know. Big Brother, Survivor, the Olympics, the World Series, the NBA Finals, or any other program is not as important as a meteorologist telling you that you or your stuff is in danger.

From 0 To 36: A Suddenly Stormy Stretch For The Tri-State

In my March 31st blog post, I said that the Tri-State had not gone the entire month of January, February, and March without a Severe Thunderstorm Warning being issued (since 1995 when the National Weather Service in Wilmington opened).

Boy, did our luck suddenly run out. Or as Ron Burgundy put it:

apr12-blog-ron

The first Severe Thunderstorm Warning of the year in the Tri-State was issued in Owen County at 4:35pm on April 2nd. Another was issued at 5:10pm that day, and other was issued on the afternoon of April 7th. From April 8th through April 10th, however, a whopping 33 Severe Thunderstorm Warnings were issued in the Tri-State, bringing the monthly total up to 36 warnings; this total puts the Tri-State into second place for the most number of Severe Thunderstorm Warnings during April:

apr12-blog-aprilwarnings

All of these warnings were issued in the first 10 days of the month. Between 1995 and 2014, an average of 14 Severe Thunderstorm Warnings were issued in the Tri-State each April; with 2015 included, that average now goes to 15.

On average, April is the 3rd most common month for severe storms in the Tri-State behind June and May.

While getting 34 Severe Thunderstorm Warnings in two days is impressive, the number of times certain counties have been placed under warnings so far this month is also impressive:

apr12-blog-aprilcounties

The Severe Thunderstorm Warning count for so far this month for Clermont, Brown, Pendleton, and Adams County are new records for April. Grant and Owen have tied their records for the most number of Severe Thunderstorm Warnings in a single April.

While there will be waves of rain and storms in the week ahead, this week does not look exceptionally stormy. The warning count for most if not all Tri-State counties will remain the same through the upcoming weekend.

Reds’ Opening Day Weather History

Opening Day is upon us, and the long-awaited start of the baseball season is here! Showers will be scattered today, and high temperatures will be near average. While you may be bummed about the chance for rain, it will not be widespread, and it the weather has been MUCH worse on Opening Day!

To celebrate the beginning of the 2015 season, here’s some Cincinnati Reds Opening Day weather trivia:

apr5-blog-trivia1

apr6-blog-trivia2

apr6-blog-trivia3

apr6-blog-trivia4

apr6-blog-trivia5

apr6-blog-trivia6

apr6-blog-trivia7

apr6-blog-trivia8

Play ball!

What You Need To Know About The Air Quality Advisory Program That Starts Today

The term “Smog Alert” has been a phrase used for decades on days where air quality was relatively poor in Cincinnati. Beginning today, however, the Southwest Ohio Air Quality Agency will no longer issue “Smog Alerts.” Instead, they will issue an “Air Quality Advisory.” This change involves more than just the title of the alert. The chief aim of this rebranding is to re-engage you about local air quality.

The Southwest Ohio Air Quality Agency measures the concentration of the six pollutants to U.S. Environmental Protection Agency health-based standards for Butler, Clermont, Hamilton, and Warren County. Under the current U.S. EPA standards, if ozone or particulate matter causes the Air Quality Index to exceed 100, the Agency will issue an Air Quality Advisory (beginning today). This is a message that encourages at-risk individuals (those with asthma and other pulmonary issues, young children, and older adults) to avoid strenuous outdoor activity until air quality improves.

When an Air Quality Advisory is issued, it will be in effect for Butler, Warren, Hamilton, Clermont, Boone, Kenton, and Campbell County (just like Smog Alerts).

The Air Quality Advisory is issued by Southwest Ohio Air Quality Agency the day before elevated ozone and/or particulate matter levels are anticipated. The decision is made around 2pm (usually Monday through Friday, but occasionally on weekends if ozone or particulate matter levels are forecast to be high) and includes a review of current and historic weather patterns.

Calculating the Air Quality Index is not easy. In fact, it’s horribly messy. The technical explanation how the AQI is calculated is here: http://www.epa.gov/airnow/aqi-technical-assistance-document-dec2013.pdf (beginning on page 16). Before the overall AQI is calculated, the AQI must be calculated for each pollutant (O2, O3, NO2, SO2, PM10, PM2.5). A calculator for doing this can be found at: http://airnow.gov/index.cfm?action=resources.conc_aqi_calc. Again, it’s a total mess. However, once that AQI is measured or forecast, the determination for a “Air Quality Advisory” will be made.

The weather plays an important part of that decision to issue or not issue. Here’s a graphic showing some weather factors that may trap pollutants near the ground and cause an “Air Quality Advisory” day to be issued:

mar29-aqasetup

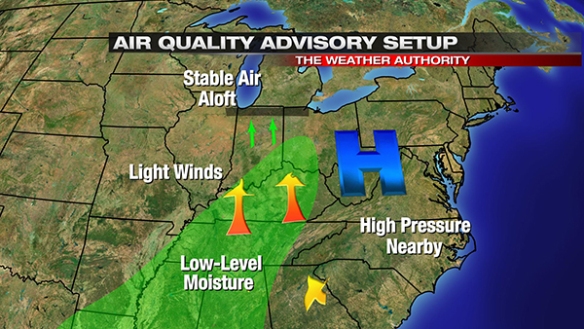
Notice that high dewpoints, a center of high pressure nearby, weak winds, and a temperature inversion (temperature increasing with increasing altitude, creating a stable layer of air aloft) help elevate air pollution levels. With time these conditions change, and air quality levels improve.

The main driver for an elevated AQI in the summer is ozone. The main driver for an elevated AQI in the winter is particulate matter. Smog alerts were almost always issued during the summer in the past; going forward, Air Quality Advisories may be issued at any time of the year, including during the winter.

Air Quality Advisories will likely be issued more frequently than Smog Alerts were. The current national standard for ozone is 75 parts per billion (ppb). The U.S. EPA is proposing a new standard of 70 or 65ppb and possibly 60ppb; the EPA will likely adjust the standard this fall. How many Air Quality Advisories we get will depend on how strict the standard is.

For example, no Smog Alerts were issued in 2013 or 2014. Had the Air Quality Advisory program been in effect those years, an advisory would have been issued 2 days in 2013 and 4 days in 2014 due to ozone levels exceeding the standard of 75ppb:

mar29-75ppb

That’s the current EPA ozone standard. The standard will likely become more strict later this year. Suppose it was set at 70ppb in 2013 and 2014 (like it likely will be later this year); during the last two years, there would have been 31 days with Air Quality Advisories in effect:

mar29-70ppb

Suppose it was even more strict and set at 65ppb. There would have been 109 Air Quality Advisory days in 2013 and 2014:

mar29-65ppb

Lastly, if the EPA had lowered the standard to 60ppb for 2013 and 2014 with the Air Quality Advisory program in effect, an Air Quality Advisory would have been needed 239 days in the last two years:

mar29-60ppb

We are just barely meeting the ozone standard in Cincinnati now:

ozone_8hour
Courtesy: Southwest Ohio Air Quality Agency

While ozone concentrations in the air we breathe have dropped significantly in the last few decades (the blue line above), we are just under the current standard (the green line above).

Again, this is just for the ozone standard. We also have to meet particulate matter, sulfur dioxide, nitrogen dioxide, and carbon monoxide standards. In addition to ozone, we are barely making sulfur dioxide and some particulate matter standards.

We have a lot of work to do on air quality. I haven’t met a person who doesn’t want cleaner air. All of the same air quality tips you heard for Smog Alerts will apply to Air Quality Advisory days. In case you’ve forgotten them (I understand, it has been a while), here they are:

– Taking the bus, carpooling, biking or walking instead of driving
– Refueling your vehicle after 8 p.m.; do not top off when refueling and tighten the gas cap
– Not idling your vehicle
– Combining trips or eliminating unnecessary vehicle trips
– Keeping your vehicle maintained with properly inflated tires and timely oil changes
– Avoiding use of gasoline-powered lawn equipment on Air Quality Advisory days
– Avoiding use of oil-based paints and stains on Air Quality Advisory days
– Never burning leaves or other yard trimmings
– Always burning clean, seasoned wood in outdoor fire pits, fireplaces and wood stoves
– Not using fire pits or fireplaces for non-essential home heating on Air Quality Advisory days
– Conserving electricity