Historical Perspective On El Niño In Cincinnati

El Niño is the warm phase of an atmospheric and oceanic oscillation called ENSO, or the El Niño Southern Oscillation. The word “oscillation” implies that El Niño comes and goes on a semi-regular schedule (every couple to few years). El Niño is best visualized as abnormally warm water in the equatorial Pacific Ocean:

sep21-elninosst

This abnormally warm ocean water leads to rising air directly above it. This rising air leads to atmospheric changes around the world, including a shift in jet streams. Changes in jet streams around the world means changes for where cold and warm air goes and where fronts go.

El Niño is not the only oscillation that controls weather around the globe. The Pacific Decadal Oscillation, the Arctic Oscillation, and other oscillations can affect where weather systems go and how strong they are.

El Niño impacts weather patterns in North America, so El Niño can affect the weather the Tri-State sees. El Niños typically occur during the winter, so looking at previous El Niño events can be helpful for understanding the El Niño currently affecting the us and the world.

What does an El Niño winter look like in Cincinnati? Most El Niño winters tend to be drier than average, warmer than average, and less snowy than average; there are exceptions! Like snowflakes, no two winters are alike.

The average winter temperature (December 1st through the end of February) in Cincinnati is 32.86°. Since 1950, 3 out of 5 strong to very strong El Niños winter have been warmer than average:

sep21-wintertemps

The El Niño of 2014-2015 is forecast to be strong to very strong, and perhaps the strongest on record.

Winter temperatures in Cincinnati aren’t necessarily warmer than average during moderate to strong El Niño events:

sep21-wintertempsweaker

El Niño winters in the Queen City tend to be drier than average, but El Niño doesn’t mean the Tri-State is exceptionally dry during the winter:

sep21-winterprecip

The Tri-State isn’t always drier than average during moderate to strong El Niño events. In fact, many moderate to strong El Niño winter in Cincinnati since 1950 have been wetter than average:

sep21-winterprecipweaker

It is important to note that precipitation is liquid-equivalent. Snow and ice must be melted to water (and added to the rainfall total) before a precipitation total is calculated.

Does El Niño affect winters snowfall totals? Yes, but not always. Since 1950, 3 out of 5 strong to very strong El Niño winters had less snowfall than average in Cincinnati:

sep21-wintersnowfall

18.5″ of 1997-1998’s winter snowfall total came fell on February 4, 5, and 6 from a single winter storm. Had that event not happened, the seasonal snowfall total would have been well below average.

A full understanding of El Niño doesn’t not mean a full understanding of the winter forecast. A single winter storm can tip the scales to the other side of average.

As always, forecast change. Seasonal forecasts can change drastically. Use caution in using historical data to understand the future. Also, computer forecast models can struggle with long range forecasts. Know that as climate scientists and meteorologist review data, the forecast may change.

How My Father Still Inspires Me 19 Years After His Death

Everyone has dates that cannot be scrubbed from their mind. September 17, 1996 is at the top of my list. It is the day that my father suddenly died.

Long before his death, my father lived his dream. He was born in Freeport, Long Island, and his father – my grandfather – was a pilot for TWA. My grandfather was a navigator and often flew flights from New York to Europe on Lockheed Constellations. Because of this, mMy father was destined to be a pilot from the time he was born. He got his pilots license before his drivers license. He soloed in an airplane at age 16 in 1966.

My father worked from crop dusting all the way to being a corporate pilot. He had licenses for multi-engine planes and even for hot air balloons. He loved to fly.

He shared that love of flying with me. He refused to let a commercial airline pilot give me my first flight; he took me up for a quick flight just days before I flew commercially:

firstplaneride5monthsold

As I grew, his love for aviation and flying remained strong. I spent a lot of time in a cockpit as a child:

dadairplane1yearold

I always thought it was cool to be in a plane and see all of the dials and controls in front of me. Perhaps it was the view out the window of one of my father’s planes that got me interested into weather. My mother can’t remember a time where I haven’t loved weather, and I don’t think my father could either.

We would travel as a family in airplanes. Road trips were only for trips to Indiana to see family or nearby to Rocky Fork Lake.

My father was a proud Purdue University graduate. After living in Long Island very early in his life, his parents moved to northwestern Indiana. His love for aviation grew there; after getting his license, he went to Purdue and focused on aerospace and aviation. He wanted to make flying his career. Years later, when he had a son, it was clear he would fly him places and Purdue would be a place his son respected. Even at Acadia National Park, a picture of Neil Armstrong (the first man on the moon and a Purdue graduate) holding a Purdue flag covered my father’s shirt and mine:

acadianatlparkmaine1980s

Unsurprisingly, my father was a USAF ROTC Cadet. The Army or Navy did not have the draw that the Air Force did…for obvious reasons.

My father came to Cincinnati in 1979. He flew Challengers, Lear Jets, and Hawkers for Cincinnati-based Federated Department Stores and Chemed. He was based out of Lunken Airport for his job but also as a private pilot. He owned numerous airplanes, and he loved to take his wife and son to places. He was a flying instructor, and even gave me two lessons was I was 11 years old.

Of course, some of those trips were related to aviation, such as Kitty Hawk, North Carolina:

kittyhawk1andhalfyearsold

Other trips were to Michigan, Minnesota, Maine, or other scenic spots. With his help, I was fortunate enough to visit over 40 states by age 11.

Because he loved to fly, he was away from home a lot. My mother was a teacher, and she was often there to pick me up from school or get me to practice as I grew older. Despite being under the care of my mother most of my childhood, my father seemed to make it a priority to help me and bond with me when he was around. For the first ten years of my life, I seemed to bond with him more than my mother.

My father was a determined man. As a pilot, he had no choice but to get the plane on the ground every time; that way of thinking translated into other aspects of his life, such as putting a basketball pole 10 feet under ground at my childhood home when I was 9. It took all day, but that pole was getting in the ground:

basketball1994

Some of my memories with him as a child have faded with time, but many have lasted to this day thanks to photos.

Unfortunately, my relationship with my father ended suddenly on September 17,  1996. He was flying in east-central Indiana when the plane he was flying had a mechanical malfunction and crashed.

I remember the phone call as an 11-year-old. I answered the phone, and a man said “Is your mother there?” I passed the phone to my mother, and went back to playing with Legos. Several minutes later, I remember looking up at my mother crying and still on the phone. She got off of the phone to deliver the news, and in a matter of hours, there were dozens of people at the house.

There were a lot of people at my father’s funeral. He was well liked, and I remember how many people had good things to say about him.

19 years later, I still think of him and how life would be different with him here. My mother and I both agree that our lives now would be similar in many ways to what would have happened if he was still here, but we still wonder what specifically would be different.

I learned a lot about the grieving process in the years following my father’s death; most importantly, I learned that the process is different for everyone. Friends grieving from murder or a prolonged, drawn-out death have reached out to me in the last 19 years, and I’ve learned that being there long term and just being a shoulder to cry on or a person to listen is the right way to handle those situations. Being exposed to the grieving process at an early age made me realize how unique our experiences in life are.

On a daily basis, I think of my father when I check weather conditions. One of the prerequisites to getting clearance to takeoff is knowing the weather conditions at the airport for which you are departing. I am reminded of my father writing down weather conditions on a piece of paper in the cockpit and talking to the control tower every time I check the latest weather observation at Lunken Airport. With aviation being so closely linked to weather, it makes sense that I am a meteorologist today because of what my father taught me and/or exposed me to.

On Wednesday, I was at Lunken Airport for a meeting, I took a photo of the terminal not just because of it’s scenic qualities, but because it reminds me of my father:

lunken

Nearly 20 years after his death, I still remember my father being a “by the book” man. His friends – many of whom I still talk to and know very well to this day – remember him as Dale “know when to have fun, but default to sticking to the rules” Dimmich. He did not cut corners, and he kept the eye on the goal. Safety was his top priority, but taking care of others – including his passengers – was a close second. While my dad was known for these things, those around me can make a strong case that those qualities have been passed on to me.

There were moments where my father was a fighter and stuck up for what was right. There were times where he contemplated issues and got frustrated. He disagreed with people. There were some that got in his way or clawed at him. I saw he was human; even in the limited about of time I spent with him, I learned that getting it all right was not always easy and was sometimes unattainable.

Most importantly, my father taught me about a dream. He wanted to fly, and he became a pilot; similarly, I loved weather, and I became a meteorologist. His death, however, taught me a lot about how distancing yourself from the dream (even if occasionally) can be a good thing. Had my father not being flying in that plane September 17, 1996, my father would likely be still be here. I have no way of knowing what would have happened had he not been flying that day, but I’ve thought a lot about that flight. Do I celebrate him dying doing what he loved, or do I wish he had taken fewer flights to decrease his odds of something going wrong? Either way, I know there are hazards in any job, but I’ve often pushed myself back from the desk to enjoy life elsewhere. Time away from the hazards is not only good for the soul, but it may tip the scale just enough to make life longer.

The metaphor of flying – from takeoff to taxi and from arrival to departure – is a good metaphor of life. My father and I had 11 years together; that’s not a lot of time, especially when you don’t remember half of those years. What my father did do, however, is plant a seed of success in me. He never saw the plant grow to its peak, but he gave it the support to live.

Perspective On 90°+ Heat In September 2015

Today marks the 7th straight day in Cincinnati where the temperature hit or went above 90°. It is not unusual for the temperature to reach 90° during September in Cincinnati, but a week-long stretch of 90°+ heat is uncommon.

Including today, the high temperature in Cincinnati has hit 90° 7 times this month (September 2nd through September 8th). This is the most number of 90°+ days during September in the Queen City since 2010:

sep8-blog-90degreeseptdays

On average, the warmest high temperature of September in Cincinnati is 90°. However, Cincinnati has only hit 90° 51 out of the last 145 years (about 35%). In the last 9 years, the Queen City has failed to hit 90° during September twice:

sep8-blog-warmestsepttemp

Our recent stretch of 90°+ days during September is not a record. In fact, we had 7 consecutive days of 90°+ during September 2007. 10 of the 11 90°+ days in 1897 came in a row:

sep8-blog-90streaks

During the warmest September on record (with an average temperature of 76.37°, about 9.5° above the 1981-2010 average), Cincinnati hit 90° 7 times. While the stretch of 90s in early September brought the average up, high temperatures consistently in the 80s and low temperatures in the upper 60s and lower 70s made September 1881 the warmest.

Through the 8th, September 2015 is off to the 19th warmest start on record. The week ahead looks much cooler with highs in the 80s and 70s.

It’s Time To Revisit Weather Safety And Personal Responsibility

Weather has the power to be inconvenient and – unfortunately – can be a threat to life and property. The danger that weather presents depends on the situation; lightning may not be a significant threat to you in your home, but it is a very significant threat to you if you’re outside.

College football is starting up. Baseball games have been going strong all summer. Play has been delayed at GABP almost 22 hours this year alone this and over 27 hours as a team (home and away games combined). Rain, wind, hail, and lightning are all legitimate reasons to stop a game, but lightning seems to be the hardest reason for fans to accept. Here are two examples of people on Twitter not happy with a lightning delay:

sep6-twittercomment1

sep6-twittercomment2

Not only did they spell “lightning” wrong, but they don’t seem to understand the importance of lightning. Lightning can injure and kill, and exactly where and when lightning will develop is not easy to predict. The reasons why officials and stadium staff suspend games are not always easy to accept, but they are important reason.

This discussion about lightning during sporting events is just a small part of a larger discussion on weather safety. Weather safety is not just communicating risk; it is also about more than weather education and awareness.

We need to revisit the basics. When I say “we,” I mean everyone; it’s not just a thing for meteorologists. We need to do more than just revisit policies and procedures; we need to start simple. Here are some steps we all need to take:

1) KNOW SPECIFICALLY WHERE YOU ARE AT ALL TIMES DURING THREATENING OR INCONVENIENT WEATHER
Some of you might laugh at this, but this is serious stuff. Too many people in this country don’t know where exactly where they live, exactly where they work, and exactly where they travel to throughout the day. It is very important that you know the county, the approximate distance and direction from nearby towns, and what time it is when there is a threat for inconvenient or storms. Do you know what part of the county for which you live? When you’re at the shopping mall, do you know what city you are near? When you’re watching TV at home and a meteorologist says a city where a storm is, do you know where you are relative to that city? You should. Geography and meteorology are interdisciplinary sciences. Knowing a storm is nothing if you don’t know where it is; on the other hand, if you know where you are but don’t know where storms are, you may be in trouble or unaware that significant weather is coming your way. Know local landmarks, and know where you are relative to those landmarks. Know what part of the city, county, and state you are in at all times, especially if there is a threat for thunderstorms or other threatening weather. Know where you are on a radar map.

2) WARNINGS RELATED TO THUNDERSTORMS ARE ISSUED FOR POLYGONS AND PARTS OF COUNTIES, NOT ENTIRE COUNTIES ANYMORE
In 2007, the National Weather Service started issuing Severe Thunderstorm, Tornado, and Flash Flood Warnings as polygons (or shapes) to clearly identify where severe weather impacts are focused. These warnings are not issued for entire counties anymore; this was done in the past, but it is not done in the present nor will it be done in the future. It is possible that part of your county is in a Tornado Warning while other parts are not. Here is an example of a Tornado Warning from March 2, 2012 in northern Kentucky:

sep6-radarblog

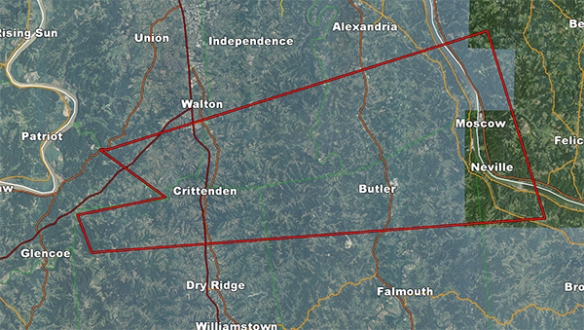
The Tornado Warning is outlined in red. The cities of Crittenden, Butler, Moscow, and Neville are in the Tornado Warning. Walton, Independence, Dry Ridge, Falmouth, Williamstown, and Alexandria are just outside of the warning. Here is the same Tornado Warning graphic with radar data included:

sep6-radarblog2

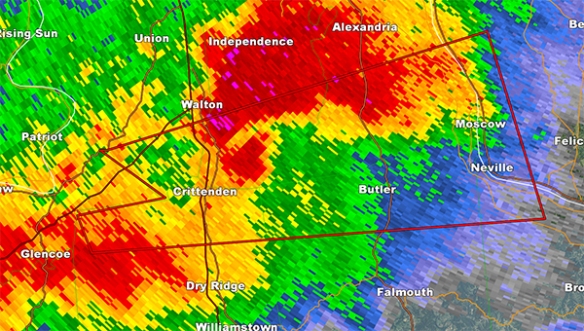
The radar shows intense radar echoes in the northern half of the Tornado Warning and also just north of the Tornado Warning.

The city of Crittenden and Dry Ridge (pictured) are both in Grant County, Kentucky. Suppose you live in Dry Ridge, and you hear a Tornado Warning is issued for part of Grant County. Should you take cover? Dry Ridge is not in the red box, and it is not in this Tornado Warning; therefore, you do not need to take cover at this time. However, there are strong storms in your areas, so you should be remain alert for warnings. This leads in easily into my next point.

3) NO WARNING DOES NOT NECESSARILY MEAN THAT STORMS WON’T BE INCONVENIENT OR THREATENING
Severe Thunderstorm Warnings in this country are issued when a storm is producing or is capable of producing wind in excess of 60mph, hail 1″ in diameter or larger, or a tornado. Severe Thunderstorm Warnings are not issued for lightning or heavy rain. Do not expect a warning to be issued if inconvenient weather is moving close to where you are. Heavy rain and lightning can still cause injury (or even death) if you put yourself in harm’s way. For your safety, you should always go inside when you see lightning. Heavy rain can lead to localized flooding; if you drive fast through heavy rain or standing water on roads, you can hurt yourself or get yourself in a bad situation, even if a warning was not warranted.

4) WARNINGS, WATCHES, AND ADVISORIES ARE NOT ISSUED FOR LIGHTNING
As I said above, a Severe Thunderstorm Warning has specific requirements for wind, hail, or a tornado. There are no lightning requirements for a Severe Thunderstorm Warning to be issued. If you’re outside in a non-severe thunderstorm, you can still be struck by lightning. It only takes one strike to injure or kill you. The odds of getting injured or killed go up rapidly if there is intense lightning in a storm or cluster of storms. Being safe means always going inside when there is lightning nearby.

5) YOU SHOULD HAVE MULTIPLE WAYS TO GET SEVERE WEATHER INFORMATION
Relying on one source to get severe weather alerts is a terrible idea. Watching television is a great source while you are awake, but your television will not alert you when you are sleeping. Having a NOAA weather radio in your home is important, as it can alert you with a loud noise day or night should a warning or watch be issued for your county and assuming you have your radio programmed correctly. Having a smart phone app to alert you to severe weather is great, but you should have more than one way to be notified of severe weather information. Cell phones can stop working, and batteries can die.

I would recommend having at least three ways to get severe weather bulletins. A correctly-programmed NOAA weather radio, a text alert service for your smart phone, television, and an e-mail alert service are all good sources to get this information. However…

6) A SEVERE WEATHER ALERT NOTIFICATION IS DESIGNED TO ENCOURAGE YOU TO SEEK ADDITIONAL SEVERE WEATHER INFORMATION
A text or e-mail alert service will typically tell you that your county or location has been placed in a severe weather warning. Due to character and text limitations, it is best to go to the television or your computer to verify where warnings, watches, and advisories have specifically been issued. Your text alert service may mention your county, but as discussed above, the National Weather Service issues severe weather warnings as polygons, not as a list of counties; this means that your location may not be in a warning, but another part of your county may be. It is important that you know and seek out this information; your life and property may depend on it.

sep6-wea

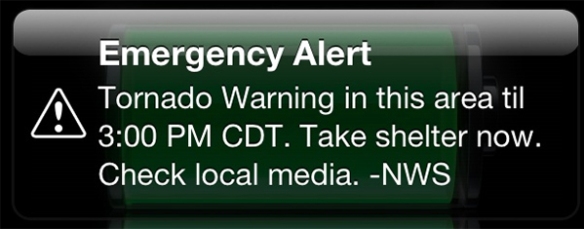
You may have seen an alert like the one above on your smartphone. These are called Wireless Emergency Alerts, a service created by FEMA, the FCC, the Department of Homeland Security, and the National Weather Service. While these alerts are great, they are incomplete due to text and technology limitations. “This area” is not specific. If you received this alert, you are encouraged to get additional severe weather information from another source and – as suggested – seek shelter immediately.

7) OUTDOOR WARNING SIRENS ARE MEANT FOR THOSE OUTDOORS
You should not wait until you hear an outdoor weather warning siren to seek shelter from a dangerous storm. These sirens are designed to notify those who are outdoors that threatening storms are approaching. Depending on location, these are usually issued for Tornado Warnings but may also be issued for Severe Thunderstorm Warnings. You should know when these sirens are sounded for your county. You should not consider outdoor warning sirens as the only way to get severe weather notifications, including if you are outside. As mentioned above, an outdoor weather warning siren should encourage you to seek shelter and additional information about where storms are, what threats they pose, and additional warning information.

8) TAKING ADEQUATE SHELTER IS ULTIMATELY YOUR RESPONSIBILITY
Severe weather alerts are great, but they mean nothing if you don’t take action. For example, this sign was displayed during the University of Cincinnati game this past Saturday night:

sep6-ucstadium

This was the student section on the opposite side of the stadium shortly after the photo above was taken:

sep6-studentsection

This is not the right response. With all due respect to U.C. Bearcat fans, there should be no students in the stands with that message on the screen. While a Tornado or Severe Thunderstorm Warning was not in effect (and didn’t need to be), there was frequent lightning in the area. That was the reason for the message on the scoreboard. I feel a personal responsibility for the safety of these students given that I was one of the meteorologists that worked with the University of Cincinnati to evacuate the field and the stands.

If a meteorologist on TV says to take cover, do it. If the National Weather Services suggests going to the basement in their warning, do it. If you see lightning during your outdoor activity, take cover, and don’t wait for someone else to give you a warning. Whether there’s a warning or not, you should take your safety seriously. If you feel your life is in danger, take shelter and get out of harm’s way immediately. There’s no going back once you are injured or killed by a storm.

Was Summer 2015 In Cincinnati More Humid Than Average?

Answering the question “How humid was it this summer?” requires an understanding of the dewpoint. The dewpoint is a temperature that indicates an absolute measure of how much moisture there is in the air. Knowing the dewpoint is helpful for gauging how humid Cincinnati was on a particular day or for a particular period of time.

There are extensive weather records for temperatures and precipitation in Cincinnati back to November 1, 1870. Reliable, hourly dewpoint records for Cincinnati, however, only go back to 1938. This period of record, however, is more than sufficient to create 30-year averages (1980-2010); these averages compared to the average dewpoint for each month this summer will give us an indication of how humid this summer was and when.

Here’s a comparison of average dewpoints by month in Cincinnati compared to the monthly average:

sep2-dewpointsmonth2

This graph shows June 2015’s average dewpoint was higher than the 30-year average, July 2015’s average dewpoint was higher than the 30-year average, and August 2015’s average dewpoint was lower than the 30-year average. June 2015 and July 2015 were both more humid than average, but August 2015 was not.

It is not uncommon to have dewpoints ranging from the 40s to 70s during June, July, or August. The dewpoint peaked in the 70s in June, July, and August; this peak, however, was well short of the all-time records (back to 1938) for each month near or above 80°:

sep2-maxdewpoints2

We expect the maximum dewpoint of each month to be below the record, and that was the case for each month this summer. The maximum dewpoint we saw June was on the average, just above average in July, and just below average August:

sep2-maxdewpointsaverages2

The minimum dewpoint we saw in June well above average, above average in July, and below average in August:

sep2-mindewpointsmonth2

All of the graphics above suggest that June and July dewpoints were – more often than not – above average, but August dewpoints were generally below average.

A Lack Of Heat In Summer, August 2015

Meteorological summer 2015 has come to an end, and it was 34th coolest, 112th warmest, and 17th wettest on record in Cincinnati. This summer finished 3.78″ below average for rainfall and about 0.74° below average for temperature. Based on the departure from average, this summer was actually cooler than summer 2013 and summer 2014 combined. Based on average temperature, this summer was the coolest in Cincinnati since 2009:

sep1-avgtemp

The average summer temperature for 2015 would be higher had it not even for a cooler than average July and August. July and August finished 0.49° and 2.59° below average, respectively. This may not seem like a lot, but remember the the average temperature is the average of the daily high and daily low averaged over the entire summer.

On average, there are 7 days each in both July and August with a high temperature of or above 90° in Cincinnati. So far this year, there have only been 9 90°+ days in the Queen City (5 in June and 4 in July):

sep1-90days

Cincinnati averages 21 days each year with a high temperature of or above 90°. The likelihood of hitting 90° drops very quickly late in September and is extremely low in October. Cincinnati will likely hit 90° at least once in the week ahead before cooler air returns.

It is unusual to not hit 90° at least once during August in Cincinnati. Even during a much cooler summer (2009), Cincinnati still managed to hit 90° once:

sep1-90augustdays

Since official records for Cincinnati began on November 1, 1870, there have only been 8 Augusts where the temperature failed to reach 90° at any point during the month:

sep1-no90saugustyears

I hope you enjoyed the break in heat during August. High temperatures will consistently be in the upper 80s to around 90° through early next week. Cooler air will return to the Tri-State by mid-September.