
Several people have reached out to me on social media recently about how cloudy this year, winter, spring, or month has been in Cincinnati. Does the data support it? How do we answer this question?
Quantifying cloud cover is difficult because clouds in the sky appear at different layers and with different opacities. One way to measure cloudiness for a period of time is by looking at the average sky cover between sunrise and sunset. This definition is particularly convenient since it is calculated daily by the National Weather Service for long-term climate sites like Cincinnati. For this analysis, we will use this average sky cover metric which is defined as:
The average sky cover between sunrise and sunset in tenths of sky covered. The minimum of “0” (0%) means no clouds observed, “10” (100%) means clouds covered the entire sky for that day. (Source)
Admittedly, data quality is not great from 2010 through 2013, but it is better for more recent years. Also, we’ll use 4pm on May 11, 2020 as cut-off time for this analysis
There are many ways to present the data, so let’s start with just the month of May:
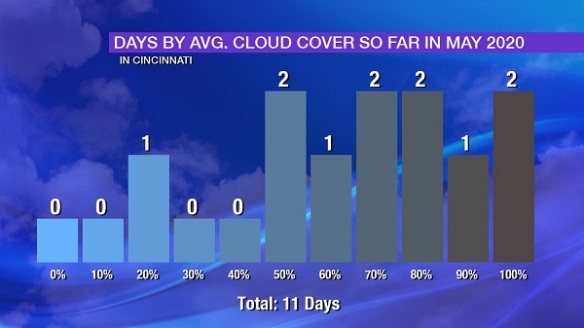
We’re 11 days into the month and 10 out of 11 days (91%) have had at least 50% cloud cover. Is May usually this cloudy? Does it seem more cloudy than last May? Here was the distribution of cloud cover in May 2019:
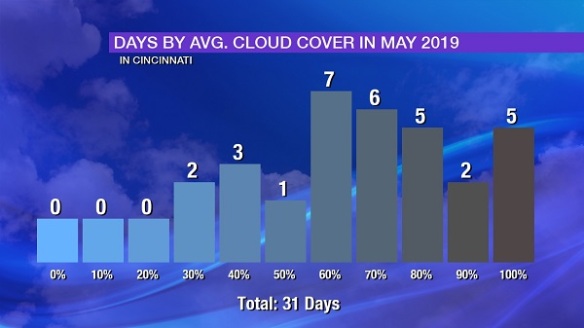
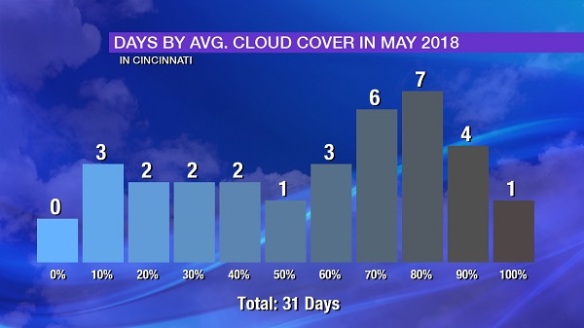
About 84% of all days last May had 50%+ cloud cover, and 22 out of 31 May 2018 days had at least 50% cloud cover:
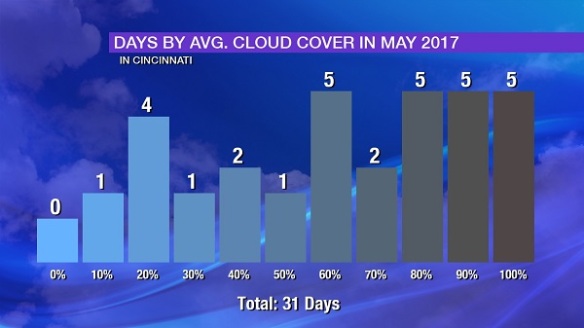
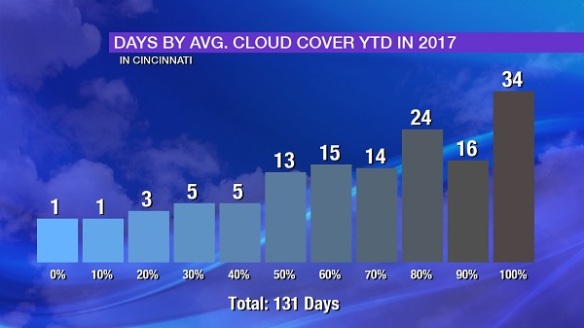
There were 23 days in May 2017 with more clouds than sun, and 15 of those had at least 70% cloud cover:
May 2020 is young, but if the month had ended today, it would be the cloudiest May in the last several years:
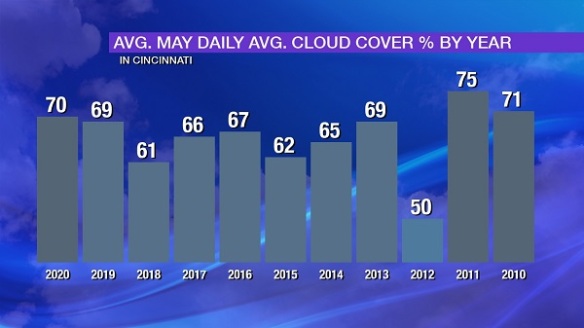
It is worth noting that early May tends to be more cloudy than late May with temperatures rising and a lean from stratus to cumulus clouds…so this average of 70% cloud cover is likely to change and will probably decrease.
How about the year to date so that we can make an apples-to-apples comparison of this year to previous years? So far in 2020, there have been 38 days with 100% cloud cover (Monday was one of them):
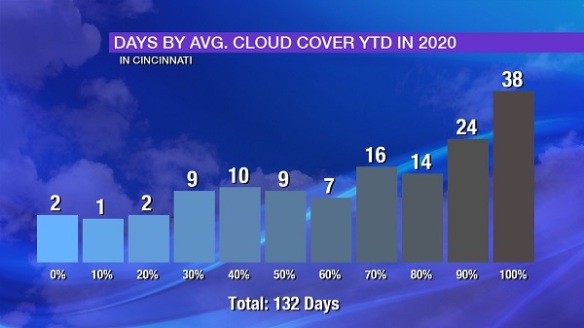
Also note the left-leaning tail on the data towards more cloud cover. 81% of days so far in 2020 have had 50% or more cloud cover. In 2019, about 82% of days through May 11th had 50% or more cloud cover; we also had 4 more days with 100% cloud cover through this point in 2019:
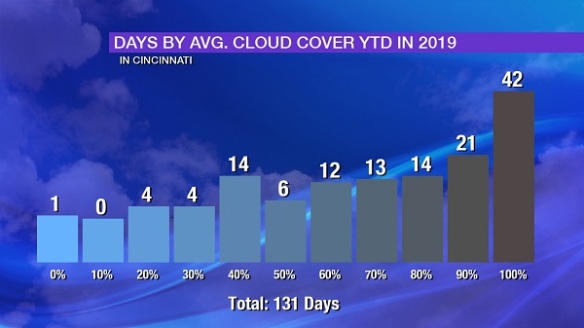
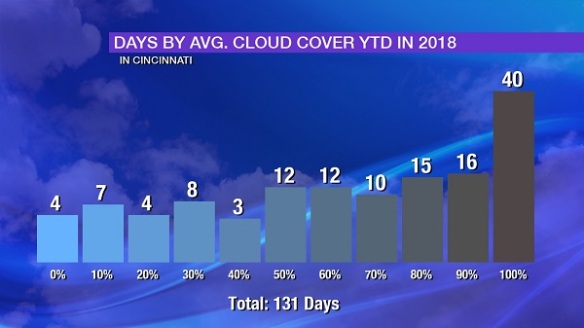
Through this point in 2018, there were 15 days with 20% or less cloud cover…compared to 5 days in that same time during 2019 and 2020:
From a year-to-date perspective, 2017 had more 50%+ cloud cover days than 2018, 2019, or 2020…but fewer 100% cloud cover days than those same years:
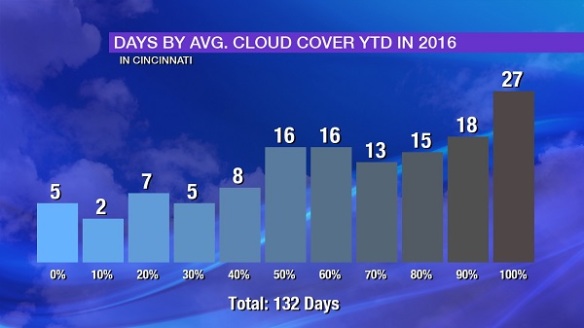
Finally, 2016 year-to-date had relatively few overcast days compared to 2020, 2019, 2018, and 2018:
How does the average daily cloud cover so far this year compare to other recent years? We’re averaging about 74% cloud cover each day in Cincinnati thus far in 2020; this is about the same as it was in 2017, slightly more than in 2018, and slightly less than in 2019:
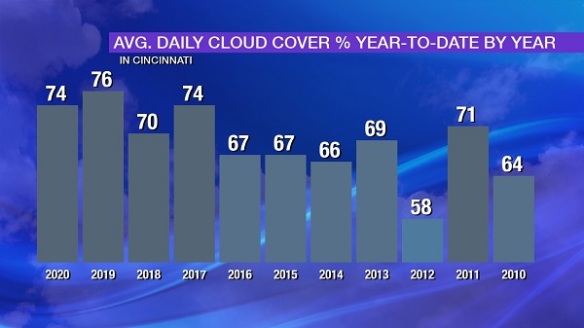
I will remind you that data quality issues affect the averages from 2010 through 2013, but it is clear that the last four years-to-date have been cloudier than the four that came before it. So what is driving this? This is not an easy answer, but here are some high-level thoughts:
- March 2020, 2019, 2018, and 2017 had 8, 10, 11, and 7 completely cloudy days respectively compared to 8 in March 2016, 8 in March 2015, and 2 in March 2014.
- March 2020 had no days with 0%, 10%, or 20% cloud cover.
- February 2020, 2019, and 2018 had 11, 9, and 14 100% cloudy days whereas February 2017, 2016, 2015, and 2014 each had 5 to 8 completely cloudy days.
- January 2020, 2019, and 2017 all had left-tailed cloud distributions, whereas 2018, 2016, and 2015 had more even distributions.
- Overall, cloud cover in January, February, and April between 2017 and 2020 was a couple to few percentage points higher than in those same months of 2014, 2015, and 2016
Relative to averages, precipitation surpluses are 2.85″ and 0.94″ since January 1st and March 1st, respectively. It makes sense that a wetter than average start to the year is likely a frequently cloudy start to the year as well.
The more complex answer is not as easy to pinpoint. Temperatures several thousand feet above the ground have an impact. The timing of weather systems, wind speeds at the ground and aloft, and snowpack can all influence cloud cover.
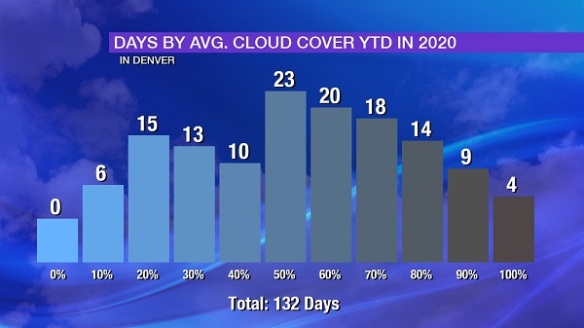
And, in case you’re wondering how Cincinnati’s 38 days so far in 2020 with no sunshine compares to other cities…
Denver has has 3 of those days:
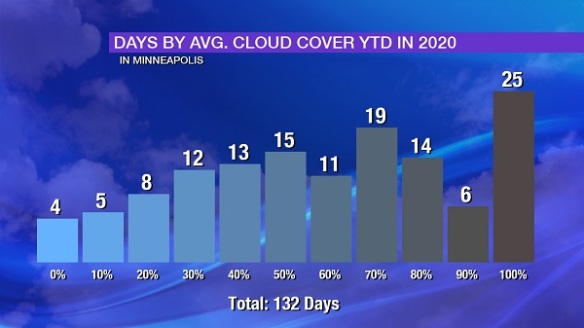
Minneapolis has had 25…
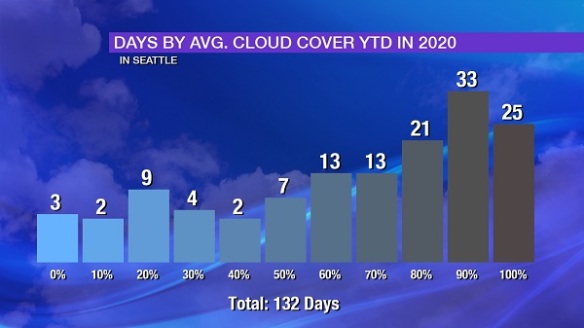
…and the infamously cloudy Seattle, Washington has had 25:
Brighter days are ahead, so hang in there!