Air Quality This Morning In Cincinnati Is Unhealthy This Morning. Here’s Why.

Have breathing problems? I would suggest limiting your time outside for the next couple of hours. There’s no Air Quality Alert in effect, but there’s something pretty interesting and unfortunate going on with the air quality around #Cincinnati now.

By accident, I happen to look at a map of air quality indices (AQI) this morning, and I notice the air quality was categorized as “unhealthy for sensitive groups” for many communities in and around Cincinnati, especially near I-71 and I-75.

These are government sensors, but citizen sensors – like those from Purple Air (I have one) – show the AQI is actually much higher in spots and even going into the unhealthy for everyone category:

The AQI index is 100+ in Middletown, Blue Ash, Mt. Auburn, and a couple of other local sites. Here’s the trend for Mt. Auburn:

…and Blue Ash:

…and Camp Washington:

Calculating the AQI is a bit weird because it’s not a true observed value like a temperature. The AQI is a forward-leaning 8-hour average, meaning it’s the currently function of the current AQI and forecast AQI values for the next 7-hours. As time goes on, values for previous hours are recalculated based on more observed values and less on forecast values.

So why is the AQI spiking? The AQI is based on a few different pollutants, including ozone and PM2.5. The graphics attached are the AQI based on PM2.5. What’s a common source of elevated PM2.5? Wildfire smoke. An explanation of PM2.5 can be found here, and the caption of an image from this link is important to review:

Emissions of combustion of gasoline, oil, and diesel fuel can drive up the AQI, so seeing “less than ideal” values around interstates is not unusual. But this morning’s spike is significant.

For days I’ve been talking about the wildfire smoke overhead being aloft. For the most part it is, but notice how the RAP model has elevated levels of near-surface smoke around #Cincinnati (black dot in the graphic below) this morning:

So how did this smoke aloft get to the ground? The answer is simple: it has rained. Rain – especially if it’s heavy – is a efficient way of bringing air/wind/energy aloft down to the ground. In this case, it was able to take a lot of PM2.5-laden air down to the ground.

So as rain moves out and the flow at and above the ground turns more northwesterly, smoke and higher PM2.5 concentrations will move south. Here’s an evolution of near-surface smoke from 8am to 5pm today.

Does This Year In Cincinnati Seem Unusually Cloudy To You? You’re Right.

If you’re thinking 2021 has been very cloudy, you’re right. Including today (which is likely to change with late day sun, but we’ll use data through 4pm today), today was the 10th completely cloudy day in Cincinnati:

We’ve not only had 10 days with 100% cloud cover in February; we also had 15 days with no sunshine in January:

This means we’ve had 25 days so far in 2021 with no sunshine:

That also means 47% of all days so far this year have been cloudy, and 88% of all days so far this year have had more clouds than sun. Is this unusual? It is. Through this date in 2020, we only had 20 completely cloudy days, but 86% of all days through February 22nd had 50% or more cloud cover:

2019 had a similar start through this point in the year; there were 21 days with no sun, and all but 5 days had clouds winning out:

2018 YTD had fewer 100% cloudy days, but only 9 out of 53 days had less than 50% cloud cover:

Compared to 2018, 2017 year-to-date had fewer days with more sun than clouds:

2016 had a more even distribution of days by average cloud cover and fewer overcast days:

Recent history would suggest that it’s not unusual to have more clouds than sun in February, but 2021 so far has been among one of the cloudiest. The average daily cloud cover for Cincinnati month-to-date is about 80%, and only one February – 2018 – has been cloudier:

…and the year so far is also quite cloudy compared to other recent years. Only 2019 – with 57% of all days through this point in the year having 90%+ cloud cover – beats 2021:

A big reason why it has been so cloudy recently is the amount of snowfalls. Despite being about 1/2″ behind average for total precipitation in February so far, nearly 22″ of snow has accumulated so far this month in Cincinnati…and when it snows like that, it will be cloudy:

The only next few days will be slightly brighter than the month so far, but a mix of sun and clouds is about as soon as it gets through the middle of next week.

What Happened To All That Snow You Had Forecast?

Just before 6pm on Monday, February 15th, I posted these words on social media: “Trolls and haters…this is your time to shine, and bring your worst.”

And they came.

There is no denying my forecasts for snow in the days leading up to the event were very different than reality. And just so we’re clear, here’s what I had forecast last night:

This is a large amount of snow for the Cincinnati area. But note that I have lower totals to the east where I felt sleet and freezing rain would be mixing in. Models become increasingly more aggressive with the presence of sleet – at the expense of snow – by midday Monday, and my forecast had changed:

By this point, sleet was falling, and I had accounted for the sleet and freezing rain rain accumulations…but I hadn’t cut snow totals significantly yet. But what was with the sudden change?

Over the last few days, it has been very clear that we would have moisture moving into the Ohio Valley on Monday. Here’s a total precipitation (all precipitation types melted down to liquid) forecast through Monday from the NAM model run early Sunday:

So we we’ll have precipitation Monday, but how much of this is going to be snow versus sleet versus freezing rain? That depends on the temperature. In meteorology, you multiply the liquid-equivalent amount by a factor to create a “snow-to-liquid” ratio. A temperature near freezing would align with a snow-to-liquid ratio of 10:1, but temperatures in the low 20s would support a ratio of 12:1-17:1. And remember, some of that liquid-equivalent could be rain, freezing rain, or sleet…or a mix of all of those. Let’s assume the 0.66″ is right and all snow, though. Here’s the snow-to-liquid ratio math for 0.66″:

If this 0.66″ is right, a forecast of 6 to 12″ is appropriate, but you want to be as specific as possible. 8-12″? 6-9″? But what if this 0.66″ isn’t right? What if it’s 0.40″ of total precipitation? Here’s the math on that:

That’s a lot less snow. If the models went from 0.66″ to 0.4″ (a drop in 0.24″) of precipitation, your snow totals are probably going to go down by at least a couple of inches. In reality, 0.2″ of liquid-equivalent fell at the Cincinnati/Northern Kentucky International Airport between 1pm and 8pm Monday! Many models – so far – are not close with this total.

Let’s revisit the temperature issue, including in the vertical. Here’s what the same model (Sunday’s 7am NAM model) is showing for the vertical temperature profile for 10am Monday morning:

This a complex graphic, but know that altitude increases moving to bottom to top in the graphic, and the red line is the temperature. The red line is left of the 32° line, and this mean the temperature is below freezing (and at least by several degrees) over a large depth of the atmosphere. This suggests we will see snow and avoid freezing rain, sleet, and rain.

Fast forward the clock to 7am Monday morning. Here’s the actual/observed temperature profile from Wilmington, Ohio:

The surface temperature is close to what is shown above, but note the temperature line (red) is closer to the freezing line (blue) compared to what is shown above. The temperature, though, is still below freezing, so snow is still the focus.

Let’s fast forward the clock to 3pm Monday. This is same model (NAM) but only looking 9 hours into the future from when the model was ran. It has a temperature near 32° just a few thousand feet above Cincinnati. This layer of air is warming.

Suddenly, our forecast for snow is not looking as good. Remember, this is a modeled temperature profile. Weather balloons only get launched early in the morning and early in the evening. Monday evening’s weather balloon launch from Wilmington, Ohio shows even warmer air aloft:

Courtesy: NWS Wilmington

Uh, oh. The temperature is a few degrees above freezing 6,000′ above the ground. This means snowflakes well above the ground are falling into this warm layer, melting, and then refreezing as they fall several thousand feet toward the ground. This is also known as sleet. Of the total precipitation that falls, more of it is falling as sleet (and less as snow) when this happens. This is a key reason many didn’t get slammed with snow. Many models were too wet with this system, and many did not capture the warm air invasion/advection aloft.

You may say: “Well, Scott, aren’t you a meteorologist? Isn’t it your responsibility to see this?” And to that I say…with what? How do I know what the temperature is at 7,000′ above the ground at every hour of the day? As I said above, weather balloons are launched twice a day in Wilmington, and the morning weather balloon was suggesting snow. How about data from an airplane? That data does exist, but it’s expensive and not publicly available. Plus…an airplane has to sample that air. So how would I know about this temperature change aloft as a forecaster? I must – in part – follow model guidance to see this. I can review guidance and compare it to reality (surface reports, satellite, radar)…but to a point. I can’t see, sample, or collect everything. And today, the things I couldn’t see….temperatures a few thousand feet above the ground and how much precipitation would fall…were not something I could understand without modeling.

The impacts of this system were good (roads were terrible, visibilities were reduced, accidents happened), but the precipitation type and amounts were off. And now you know why it’s not as easy as it looks.

Is January 2021 in Cincinnati Cloudier Than Most?

Does this month seem cloudier than usual to you…or does it just feel that way?

Tuesday was the 13th day of January 2021 so far with 100% cloud cover between sunrise and sunset:

In other words, half of all of the days this month have had no to extremely filtered sun. There have only been two days so far this month with more sun than clouds during the day. Is this unusual?

The average of the average daily cloud cover for January 2021 so far is 78%. Compare that to 80% for all of January 2020 and 2019…and the 85% average daily cloud cover for all of 2017. This month has been cloudy, but three January’s since 2011 have been cloudier. As a first pass, January 2021 actually hasn’t been that cloudy for January standards; this is because January is often a very cloudy month.

What’s the story with January 2020, 2019, and 2017? January 2020 only had 11 100% cloud cover days, but 90% of all days (28 out of 31) had 50% or more cloud cover:

January 2020 was quite wet, with 4.14″ of precipitation. January 2019 had 14 completely cloudy days but only 6 days with 50% or less cloud cover:

January 2019 was also an active weather month with 4.11″ of precipitation. January 2017 had less precipitation (3.67″, which is 0.67″ above the monthly average), but it was quite cloudy. 81% of all days in January 2017 had 80% or more cloud cover:

There is a loose relationship between monthly precipitation and cloud cover for the month overall (of course, it’s not that simple). Interestingly, there was less than an inch of snow accumulation in January 2020 and only 4.2″ of snow accumulation (that’s below the monthly average of 6.5″) in January 2017. January 2018 had more snow accumulate (6.2″) but had less cloud cover.

Hang in there; the average daily cloud cover will increase in the next few months. Over the last few years, average cloud cover in February has centered between 70 and 90%:

By May, percentages drop to the 60 to 75% range:

By July, these percentages drop into the 45 to 65% range:

Data confirms brighter days are ahead, but this will be a gradual transition spanning the rest of the winter and spring.

Thank You, John Lomax

John:

This post is long overdue, but I owe you – at bare minimum – a very large thank you for all you did for me years ago, especially from late 2015 to the end of my time working with you in late 2017.

It was clear both off and on-air that we respected each other from our first day working together in November 2011. We wanted each other to succeed, we wanted to laugh together, and we enjoyed each other’s conversation. Lunch time was went I usually saw you, but we would occasionally spend hours working together from the middle of the night to the middle of the morning. We were serious when we needed to be, and we were silly and fun when it was appropriate.

blog_apr26_john2

While your days and responsibilities have been fairly consistent over the years, my days and responsibilities in the 2010s were increasingly difficult and mentally challenging. You saw how I wanted to grow, but you also saw – first hand – the confines of my environment and situation. You knew that I was often unhappy and yearned to make a change in my life that would make me feel more successful.

In late 2015, I made the choice to pursue an MBA, and I was pleased when you supported me. When I was applying to Xavier’s Williams College of Business, I asked you to write me a letter of recommendation…and you did. The assistant dean for the College of Business later told me that your letter and recommendation was a one of high endorsement and played a key part in my admission. For this, I am forever grateful. Your words and support activated a new path in my life.

From the time I was applying to Xavier until the time I started a new job, I asked you to not share the fact that I was working on an MBA with our co-workers. Being the “camp counselor” that you are, you were true to your word. Along the way, I needed your mental support and coaching…and you were there. You listened, you encouraged, and were a friend. You often spotted me “over there in the weather center” sneaking a peak at case studies, reviewing flash cards, and posting on class messaging boards, but you never said a word. When others wondered why I was not pleased with coming in to assist for severe weather coverage in the middle of the night, you knew that it was because I had tough mid-term exam coming after a grueling shift ahead.

Amazingly, I made it to the end of my time as a broadcast meteorologist without any of our coworkers knowing I was working on an MBA; I don’t know how I kept 15 graduate-level courses a secret, but I did it. I left swiftly and suddenly, as I hoped I would. Not all friends would keep quiet, but you did.

It is a shame I don’t get to work with you on a daily basis anymore, but I was thankful we got to catch up in September 2019 over food and coffee.

blog_apr26-john1

I am looking forward to catching up with you again soon. Until then, I want to publicly thank you for years of support, recommendation, and friendship. There’s a reason so many in the Tri-State trust you; it’s because you’re one of the good ones.

Warmly,

Scott


Loving The Weather While Working In Business; Why I Partnered With WHIO Weather

Just over 2 years ago, I left my career as a broadcast meteorologist behind with an MBA in hand and a new career path in business intelligence beginning. I’ve found success in my second career, but – as you might expect – I still love the weather. Indeed, myself and everyone I know said I did the right thing by leaving where I was to go where I am now…but there’s still that love for meteorology that lingers within you…and you still wish things had worked out in weather.

When I finished up my MBA at Xavier in the summer of 2017, I suddenly found myself with a lot of free time. I was likely to leave broadcast meteorology by the end of the year, so starting projects at my current employer wasn’t the right choice. What should I do with all of this free time? How can I stay involved in weather? And then a path opened up.

blog_dec23_whio

Insert Kirstie Zontini – pictured above at the right. She’s a meteorologist at WHIO-TV in Dayton, Ohio. I’ve respected WHIO for a few years, especially given their history of hiring degreed meteorologists and having their meteorologists be certified by the American Meteorological Society. McCall Vrydaghs, pictured above at the left, is the chief meteorologist at WHIO. I had the chance to meet both of them just over a week ago after several months of virtual partnership.

In very late 2017, Kirstie reached out to me on Twitter with great praise for both my time in meteorology – including my graphics and the data within – and my success with getting an MBA. I was quite flattered and appreciated her comments…but the conversation about my career transitions eventually turned to a conversation about how I was creating social media graphics and finding the data often used within them, including these pavement conditions and power outage maps:

dec23-blog-pavement

dec23-blog-outages

Now the dots start connecting: perhaps there’s a path to working with Kirstie that brings some of our ideas to a platform where hundreds of thousands of people can see it. After all and keeping myself humble, my social media pages have a small fraction of the reach that a station like WHIO-TV has.

At first, I tried a “simple” programming route with Kirstie; maybe we can pull some data already on the Internet and let the on-air weather graphics machine do the heavy lifting. Well, that didn’t work…so it was time to move onto the advanced topics. Kirstie’s a great broadcast meteorologist, but – and even she will admit this – she’s not a computer programmer. The next step was to get resources, and Kirstie did just that after connecting with engineers and the IT department; this was no easy feat, and from my side of the fence this was a clear indication that she was passionate and dedicated to tackling some these weather projects.

Once we had resources, it was time for me to use computer programming to pull, clean, and process weather data that WHIO wanted. My first project was to pull Ohio Department of Transportation and Indiana Department of Transportation pavement temperature and wetness data. I found a way to pull the data, and Kirstie got the data into her weather graphics machine and built the graphic (formatting, colors, and all). Here’s the latest version of Kirstie’s graphic:

Next up: power outages. We started this in early 2019. Once again, I pulled the data from Duke Energy, DP&L, and Ohio Edison…and Kirstie did the data importing and graphic building. Kirstie had to color-code all of these counties one by one and for each outage category!

Ironically, Kirstie and I had completed this map and the automation behind it prior to the Miami Valley Memorial Day tornado outbreak in late May. While immediate attention went to the loss of life and property, the attention after those concerns goes to “when am I going to get my power back?” WHIO used the fruits of our programming labor immediately after the tornadoes:

That’s a powerful weather story following a tornado. Seeing this is like being a coach on the sidelines and watching the players on the field succeed. I may have retired from broadcast meteorologist, but it makes me happy to know I still have a stake in the game.

Kirstie and I have also automated a lot of behind-the-scenes processes, including automated river, UV index, and air quality forecasts just to name a few. We’ll be working together in the coming months to make additional data-driven graphics.

So why did I do this?

I still love the weather. When I left meteorology, I had a lot of “gas in the tank” and ideas; why let those go to waste? If someone wants to learn something you’re passionate about, why not support them and mentor them? If you have a chance for a partnership, why not take that chance to do something great? Perhaps most importantly, why sit on my ideas and knowledge when it can be used by others to help others – and in extreme cases – help keep people safe? Didn’t I make that commitment to the community as a meteorologist…and especially after tackling an ethics-based MBA?

I’m thankful for my partnership with WHIO, and I’m thankful to still be involved in meteorology…even if I’m cheering from the stands.

As part of this initiative, I came on McCall and Kirstie’s podcast – “Cloudy with a Chance of Podcast” – recently. Hear more about our partnership, changing, and my transition from broadcast meteorology to the business world here:

•WHIO On-Demand page: bit.ly/2GxtQWg
•iTunes: apple.co/2Gxu4g4
•Stitcher: bit.ly/2sJ4CCt
•Google Play: bit.ly/2BGOwMl

Why You Don’t Need Regular, Granular Forecast Updates

I woke up this morning to find the weather chatter centering on rain to snow from Monday night and Tuesday. Depending on what computer forecast model you believe, there’s also the potential for snow later this week, this weekend, and the start of the following week. How much snow and when? What will the impacts be on all of these rounds of precipitation? What about that shot of very cold air coming later this week? Then, as a I reached for my first sip of coffee, I saw this:

This tweet invites several questions about you, but mainly: how often do you – the customer – need forecast updates, on what, and why? This tweet also invites a lot of questions about me, meteorologists, and other forecasters, but mainly: after a review of the data, what do I need to share about the forecast while also being responsible, and what do my customers want?

As a meteorologist, I can confirm there is a lot of computer guidance out there. There are American models, European models, Canadian models, short-range models, long-range models, and even models that attempt to predict what the radar will look like in 15-minute increments. You could spend all day looking at guidance, but the benefit in reviewing all of this information is a forecast, or the best theory on what will actually happen.

The cold, hard reality is that customers don’t need to review all of this guidance. That is the job of a meteorologist. But not all meteorologists feel that way; some have become “model regurgitators.” They will give you a forecast, sure; they will also tell you what every single model run says along the way.

Let me give you an example of how this process plays out using one computer model runs over time. Here are recent 24-hour “snowfall” projections ending at 7am Friday from the GFS model:

jan27-blog-gfssnow.gif

Each snapshot here shows a “projection” (I put that in quotes because nearly all computer forecast models don’t directly forecast snow, so this is reality raw computer data with human logic that may or may not be correct layered on top of the data to get to a snow amount) from the GFS model. Each of these runs has different inputs of different quality. So which one of these models is right? If you watch the animation for long enough, you’ll see snowy runs and snow-less runs…and eventually you’ll realize that this model is not very consistent. This happens more often than you think.

Let’s go back to that potential for snow Monday night, and let’s see what type of precipitation the GFS “thinks” will be occurring (again, I’m using quotes here because the GFS doesn’t directly forecast what type of precipitation will occur at a given time. A human logic layer is applied here). Here’s the GFS computer projection for 10pm Monday night:

jan27-blog-gfsptype

What type of precipitation will be occurring in Cincinnati at this time? Blue is snow, and green is rain. Well…this is complex. More recent runs are faster with line of precipitation and quicker to change over to snow, but we can’t ignore the fact that some recent GFS model runs suggest rain is more likely. We could broad-brush this and say “rain and snow to snow Monday night” (and there’s nothing wrong with that), but time matters when we’re talking snow. A rate multiplied by time will get you to a snow total. I just posted output from one model here, but the job of a meteorologist is to evaluate all model data, outcomes, and trends then make a forecast on what will happen. This means there is little to no value in posting model data for customers to review unless the meteorologist believes that model data is correct. This also means sharing what each model run “says” as it comes in is pointless.

So why is this happening? I have some theories:

  1. Some meteorologists and forecasters want attention, likes, and shares, and they will share model output to get that attention. The concept of “involving the customer in the process” or “bring them along for the ride” is merely a grab for attention. This can easily be countered by saying “I’m informing my customers,” but you can inform them with a forecast, not an attention-grabbing, knee-jerk, likely conflicting series of updates.
  2. It’s easy or at least becoming easier for meteorologists to share attention-getting weather headlines. Computer graphic machines can print out a snow amount for a city from a given model run to the tenth of an inch out to 5-7 days. Find a model run that generates extreme temperatures, severe weather, or big snow…and you’ve got a social media hit and a watercooler conversation.
  3. Meteorologists and forecasters (including non-meteorologists who have access to raw model data and maps) who gather significant attention for their extreme scenario posts often – over time – get an increasing market share, often drowning out those who are advertising more reasonable, modest, or less extreme scenarios. This often fuels misinformation about weather systems and the misconception that “meteorologists are always wrong.” Just because one forecaster cries wolf doesn’t mean they all do.
  4. Many forecasters lack the experience or education to evaluate model data and forecast the weather. Anyone can make a forecast or post maps, but making an accurate, detailed forecast requires skill. Unfortunately, extreme scenarios – or at least the risk of an extreme scenario occurring – will often win out over the voice of reason. In other words, the source of the forecast (or even raw computer output) doesn’t matter.
  5. Forecasts – partly as a function of inexperience in those who forecast or share computer guidance – are becoming increasingly wishy-washy. There’s a “chance” of extreme weather this week. Snow of 0-10″ is “possible” later this week. A temperature of -5° is scary, but a wind chill of -25° is even scarier. That wind chill could become -30° tonight…check back for updates! It is possible it could get worse! And that potential keeps many hanging on.
  6. The potential for significant weather often surfaces 5-10 days out. That means you’ll be strung along with “updates” for 5-10 days on one or more significant weather events. The scenarios could range from good to bad to worse, and you’ll likely see the scenarios change every 12 hours. There’s a lot of whiplash in the model world, so why are you being taken along for the ride? More importantly, why do you want to be along for the ride?

I’ve had a long standing concern in meteorology: the specifics of the forecast usually don’t matter. Here are some 7 day forecasts from Los Angeles TV stations:

jan27-blog-abc7
jan27-blog-fox11
jan27-blog-ktla

So…a high of 76° and 78° today, and a high of 73° or 74° tomorrow. What’s the real difference here? Does it matter where you get your forecast from the next five days here? It doesn’t. It makes absolute sense that you get it the forecast from the easiest accessible place because there’s no significant difference between these forecasts. Additionally, there’s no need to check back for updates because if tomorrow’s high goes to 75°, who cares?

If there’s no risk for inconveniencing or hazardous weather in the next 24 hours, it doesn’t really matter where you get a forecast from. There are few weather scenarios (i.e. a blizzard, tornado outbreak) where you need to know what the forecast looks like beyond 24 hours. If you check your phone at noon to see what temperatures look like this afternoon and evening and you don’t see anything inconveniencing, that’s about all you need to do weather-wise for the rest of the day. If the forecast temperature for 8pm changes from 45° to 43°, was getting that update worth your time?

The best comparison I can make to this logic is like that of a sandwich shop. Let’s say you’re meeting a coworker for lunch 5 days from now. In reality, you just want a sandwich to be made when you get there. I believe it’s highly likely that you just want a sandwich to be there when you’re ready to eat 5 days from now; you’re not concerned with supply chain logistics, whether there will be a manager present at the store, whether the heater in the building will be working, and whether their shipment of meat and veggies will arrive at 4pm or 5pm on Thursday. I suspect you won’t be calling the sandwich shop every day until you meet your friend for lunch just to make sure everything is on track to get your sandwich. If the sandwich shop had a social media account, I don’t think you’d fine them posting about when their shipment of meat arrived at the dock, when their employees clocked in, and what temperature the thermostat is set at; even if they posted about this, you likely wouldn’t care.

Just like the sandwich, you just want a forecast. You go to a source of information that suggests what is going to happen. I suspect you aren’t going to a webpage and comparing what 5 different computer models say about the timing of precipitation and what the temperature will be for each hour in the next 5 days. I suspect you don’t care what the NAM model trend for the last 5 days has been, or what the median accumulation amount is from the latest SREF model. You just want the sandwich.

When you go to the doctor, you just want to hear his or her diagnosis. When you go to a mechanic, you just want to hear what the recommended repairs are and the associated costs. When your manager at work asks you to turn in a report, you don’t staple a separate sheet with your mathematical calculations to the report.

So why do it with weather? If it’s not a inconveniencing in the next 24 hours, go out and live your life. Forecast accuracy increases dramatically within 24 hours of active weather, so you might as well save your interest for that window and not go “along for the ride” on a computer model wild goose chase for days.

The Things They Never Told Me: An Open Letter To Penn State And Campus Weather Service Students

To The Students Of Penn State University And The Campus Weather Service:

Odds are good you have no idea who I am, but I was once like you. I graduated from Penn State 11 years ago with a Bachelor of Science in Meteorology from Penn State. I was a member of the Campus Weather Service. I was both on camera and worked behind the scenes at Weather World. I learned a lot at Penn State just like you, and I really enjoyed my last two years there.

jan21-blog-tv

I worked in broadcast meteorology for 10 and 1/2 years. I worked in three different cities, and I’ve worked just about every shift there is. I interned every summer during college (once for the National Weather Service and twice at two different Cincinnati TV stations). Additionally, I had a path to a career with the National Weather Service, but the opportunity just wasn’t right for me. I’ve recently earned an MBA (Masters in Business Administration) from Xavier University and work into the business world now as an analyst.

I tell you these things not to brag or boast but to tell you some things I wish I would have known 10 years ago about meteorology and give you a frame of reference. No one sat me down and told me how the meteorology industry works or the good and bad within it. When you’re focused on differential equations, atmospheric dynamics, finding a job, and having a social life…it’s easy to not have a focus on your career or what the next 10 years look like. I’m here to offer some advice with that.

I’ve come up with 15 things you need to know about the future, and they are all important. What I say may not carry a lot of weight with you because you’ve never heard it or experienced it before; take a leap of faith that what I say is more right than it is wrong. Let’s talk.

  1. Your #1 goal in your life and career is to be happy and successful. Happy and successful. Happy and successful. Happy AND successful. It’s so important that it requires repeating. You should always be or be working to be happy and successful. If the job offer you got doesn’t make you happy and successful, don’t accept it. If your first job doesn’t make you happy and successful, move on as soon as possible. If any aspect of your life doesn’t make you happy and successful, it’s time to move on.
  2. Study who is advancing and succeeding in meteorology and figure out why that is. When I graduated from Penn State, the boss of my first job said he hired me because I was a Penn State graduate, and he thought it was a good school for meteorology. What got me my second job? Being a Boy Scouts of America Eagle Scout helped me stand out. What got me my third job? The fact that I interned with my supervisor, and he liked the quality of my presentations and interest in data. Fast forward a couple of years into my third job, and I found myself wanting to advance. I saw people in my industry with half of my experience getting higher-exposure, more senior, and better paying jobs…and I wasn’t moving. I thought that my experience and education would be helpful to advancing.

    Until I started an MBA, I didn’t really get business. When you graduate from Penn State with a meteorology degree, you don’t know much if anything about business, and this is unfortunate. Thankfully, I can give you some insight. Successful companies create value for their customers. They do so by having a competitive advantage, and hopefully it’s a sustainable competitive advantage (one that other companies can’t replicate). Companies also care about profit, which is revenue (income) minus costs. How do companies make more profit? They either increase their revenue or decrease their costs. This helps retain their shareholders, stakeholders, and investors (people that own stock or a share of the company and expect a return on their investment).

    So let’s jump back to meteorology and the companies that depend on meteorologists. Take your pick on which vertical you want. Government, public, or private sector? It doesn’t matter. Now assume you’re the boss at one of these companies. Your investors want you to make more profit every year. You can only increase your revenue so much; your budget is only so big. You can cut costs, and you may even be incentivized by your company to cut costs. How can I cut costs? Salaries take up a big part of the budget, so maybe you look there. Experienced employees cost more, and less experienced employees cost less. Is it worth getting people with less experience? Some bosses will say yes, and others will say no. What kinds of people are willing to work for less? Really think about this question, then go back to the original question: why are the people who are advancing actually advancing? What about them gives them a leg up? Then look at yourself against this crowd. Can you have their same success? Can you get the education or knowledge they have…or is it something you can’t change? I remember getting advanced to a second round of a National Weather Service job years ago. I called the meteorologist-in-charge of the office, and he told me I wasn’t likely to get the job because he had two military veterans in the list of candidates. Could I realistically be a military veteran? I couldn’t…at least not easily. Perhaps there were other candidates who – after interviews – were willing to take a lower salary, and I wouldn’t have gotten the job (all veteran qualifications aside). The moral of the story here is that some people advance and get jobs for the right reasons, and some people get jobs for the wrong reasons. Sometimes you won’t get the job even if you’re the most qualified candidate.

  3. METEO 473 is the most important class you’ll take at Penn State. Remember that course you took on processing weather data and transforming it into an analysis? That’s the most important class you take at Penn State. Pick any large company that doesn’t employ meteorologists. If you’re struggling, think of Google, Macy’s, Apple, or Microsoft. These companies spend MILLIONS if not BILLIONS of dollars each year in research and development on products and services. You know what they use to make decisions? Data. Now go back to meteorology and rope in the comments I made about sustainable competitive advantage above. What are YOU going to do to stand out? Present the temperature map with a brighter and bubblier personally than anyone else? Please. Present the same information that everyone else has access to from a vendor? Please. You’re going to stand out because of what you can do with data. You could present the mold and pollen count, but can you automate a process to ingest that data into a computer so you can save time and avoid the potential for typos? Can you predict what tomorrow’s pollen and mold count will be. You can do a statistical analysis on it. Use a linear regression, and you’ll be surprised how easy it is. To stand out, you have to know where to find data that few can find, know how to process it and automate processes, and predict what others can’t. If you don’t know how to get the data you want, figure it out, and don’t give up!
  4. Stop looking like everybody else and be different. One of the worst parts about meteorology today is that everybody looks the same. Here’s your forecast, right?
    jan21-blog-tempsjan21-blog-radarjan21-blog-7day
    I would guess the phrases “good morning”, “those/these temperatures”, “just a few showers”, “weekend is always in view”, and other cliche phrases are peppered throughout the presentation. BORING. When you’re learning to present the weather, you shouldn’t be emulating other meteorologists and just learning to do what they do. You should be learning to talk about the weather in your own words with confidence. What are YOU going to present that isn’t just the same thing as everyone else in town? What’s your trademark? As I stated above, data and analysis is your best and easiest way to stand out.
  5. Minimize your “greenness”. I get it. You’re in college and soon to be entering the workforce. You’re excited. You want to leave out the dream of being a meteorologist. You’ve followed the weather since you were a kid. You’re wanting to hit the ground running, and you’ve got ideas. But don’t be a sucker. Of course your boss wants you to work all of the time and give 150%, especially if it’s not costing your boss a dime. As you get older and especially as you have more commitments (a significant other, a family, a child, etc.), you’ll see the importance of a work-life balance. You don’t want to spend your life at work. Talk to your parents or older mentors about limiting their time at work before you start working. Meteorology is already a industry that essentially requires you to look at the weather when you’re not working. 40 hours a week of meteorology is plenty, especially if part of it is spent in the cold, heat, or elements.
  6. When you graduate, you don’t have to go into meteorology. No one actually tells you this, but you don’t have to take a job in meteorology. You can do whatever you want for a career. A meteorology degree gives you many important life and career skills, including – but not limited to – critical thinking, problem solving, ability to use technology, and programming. Those are the skills you need to get just about any good job. You can market those skills and get into a lot of industries.
  7. The hours of meteorology suck and will have an impact on your life. You may have heard people complain about how “boring” 9am to 5pm Monday through Friday jobs are; I suspect those people have never worked the shifts that a meteorologist does. National Weather Service meteorologists that aren’t in management work different shifts; in other words, you may work overnights one day, evenings for another shift, midday for another shift, and then mornings through early afternoons for another shift. If you work in television and do weekday mornings, you’re likely up at 1-2am five days a week. If you’re working evenings in television, you’re in at 2pm and out just before midnight. If you’re working weekends in TV, your schedule is all over the place; in fact, many weekend meteorologists in TV work all of the morning and evening shifts. As a college student, it is highly likely that you have never had a job that required you to work crazy hours, so you don’t know the impacts it will have. The idea of working the weekday morning shift looks easy, but it will wear on you. Doing double shifts or early morning shifts isn’t too taxing on your body if you only do it a couple of days or even a week. After about two weeks, you’ll be tired. After a month, you’ll be exhausted. After 5 years of doing it (like I did), you’ll likely have health effects. You can cope with coffee and naps, but these are coping mechanisms. Coffee plus an unsettled mind due to getting up in the middle of the night don’t mix well. Your lack of sleep day after day becomes a compound issue; being tired one day makes you more tired the next, and after months and years of doing this, your mental and physical health easily slide. Now layer on the other pieces of life. You’re taking your personal time to nap. You’re tired, so will you make it to the gym? Now say you’re married with kids; you’re going to tell your your significant other and kids you have to go to bed at 5pm or work holidays and weekends? They won’t fully understand your shift or what it’s doing to you, and yet you’re still expected to be there and alert for your family.
  8. Advancing in meteorology often requires moving. This may not be a problem for you, but suppose you take a job then can’t advance. You may have signed a contract with a no-compete clause, so you can’t just work across the street. That means you’ll have to move. Then say you want to work a better schedule in a couple of years. Can you just advance to the new schedule you want because you are the best forecaster statistically? It doesn’t work like that. You’ll have to move. Then suppose your new employer is grooming you for a better job, but then you realize it requires going to a new town. At some point, you’re going to have to ask yourself: is it worth all of this moving? Moving often means finding new friends and moving your family along with you.
  9. Meteorology is a better hobby than it is a career. Meteorology is a public facing job. You get to tell everyone the weather. That means everyone, including the worst of the worst and the best of the best. When you forecast 2-4″ of snow, there will be trolls ready to say they got 4.1″ and “it must be nice to be wrong 70% of the time and keep your job.” Also, forecasting the weather is like drinking from a fire hose. There’s an endless supply of models to review, and you have to make decisions that impact people’s lives. It’s a lot to take on, and there will always be grief. Some people are mean; if you’re in the public eye, some will make fun of your looks, some will insult your knowledge, and some will even attack your race, weight, or gender. You can look at models all you want working out of the weather industry and without the attacks. Plus, how long do you want to spend your mornings, nights, weekends, and holidays away from your family? How long do you want to work in the cold, snow, heat, and other weather elements? Regardless of where you work, you have to think about how your job will impact the quality of your life.
  10. Be careful from whom you take advice. If your mentor is young and inexperienced, they likely haven’t been in meteorology long. You want to talk to mentors to have been in their business for many, many years. They have seen a few things. They’ve worked the shifts, they’ve seen people fired on the spot, and they’ve seen the industry trends play out. People that have been in the business a long time get “the long game.” Also, be careful getting your advice from senior or chief meteorologists that have been in their position for a long time. A chief meteorologist that has been in his or her spot for a long time likely hasn’t worked the more physically demanding early morning or “doubles on the weekend” shifts…or at least remember working them…or did the shift before the layers of mutli-platform demands.
  11. You’ll probably have to get a masters degree down the road. This is not what you want to hear with building student debt, but you’ll probably have to get another degree in the future. I don’t know of a company with meteorologists that will pay for you to get a masters degree, so you’ll likely have to pay for this degree out of pocket. Why do I say you’ll need a masters degree? Because if you want pivot to another career, you’ll likely need to prove to your future employer that you’re qualified and “not a meteorologist.” The National Weather Service also wants the best candidates, and your education matters and increases your odds of getting hired. Budget accordingly, and pace yourself.
  12. Research your employers extensively. Before you sign on the dotted line for a job, you should research your employer. What kind of company are they? What’s the culture there?  What are employees saying about the company? Have they recently gotten in trouble or hot water? Are they ethical? Are they fair? Do they treat their employees well? Do your research so you work for the right employer. Know that your employer may also be acquired or merge with another company. As news of that breaks, research the acquiring company. If they aren’t a good fit, it’s time to move on.
  13. Your looks may matter. It’s not right, it’s not okay, but it’s reality. If you’re in a public-facing role, your “beauty” comes into play. I’m not here to judge you, but some will. You’re far more likely to be judged based on your looks than forecast accuracy.
  14. Your opportunity cost may be better outside of meteorology. Opportunity cost is the loss of potential gain from other alternatives when one alternative is chosen. Suppose you go into meteorology. What’s the average salary of a meteorologist in their first job? I remember getting an offer to work as a broadcast meteorologist in the Midwest for $18,500 a year. As a college student, that may seem like a lot, but that’s not a lot of money. The poverty line for a single person is $12,140. I didn’t take that offer, but know that it takes a while to make a great salary in meteorology.Now consider a career in business or another field. What’s the average salary for a business person in their first job? It’s likely higher than a career in meteorology. Either way, you have to research. It’s not all about money either; which path gives you want you want in life faster?
  15. Your dream changes, not ends. Being a meteorologist is a dream, but the odds that you change careers in your life is high. You need to be prepared for change. People lose their jobs or get fired. What are you going to do if that happens? You likely have rent and loans to pay. How are you going to pay your debts? You’ll want job security once you have a job, especially if you have a family. Do you get your forecast on your smartphone or TV? If not, how many of your friends do? This should tell you about trends in meteorology, where people are getting their forecast, and how much people care about the quality of forecasts. Don’t ride out the storm until it ends; make moves before the storm hits.

I hope you find what I say relevant and beyond what others have told you. I encourage you to think a lot about your career choices, who you want to work for, who you don’t want to work for, and what will – above all else – make you happy and successful.

Warmly,

Scott Dimmich

Meteorologists Need To Be Data Scientists And Programmers. Their Future Depends On It.

Data is really, really important to any business that matters. Data is being used to not just get a heartbeat on what customers are buying and using; it’s being used to drive decisions within the business. As I highlighted yesterday, companies are spending large amount of money (and their profits!) to better understand their customers’ behavior and purchasing profile.

Alternatively, meteorology requires quality data. Looking at surface, radar, satellite, and upper-level trends is a very valuable part of creating a forecast, but it will only take you so far…perhaps 12 hours into the future in some but not all situations. Computer guidance is needed to make forecasts that are longer-term. Knowing where severe storms will develop, where that hurricane will go, and how much snow will accumulate requires data and an understanding of it.

Meteorology isn’t a rewarding science unless the results are shared with many; there is little value in knowing where a storm will go and what impact it will have if only you know what the forecast is. If emergency managers, state officials, and the public know where the tornado is moving and what impacts a city will get from a tropical system, the information is far more valuable and can be used to make and inform other decisions.

Unfortunately, meteorologists can’t just download their analysis and knowledge into other people’s heads. The world would be a much smarter, better place (I hope) if we could freely exchange information and insight by installing it directly in a brain…but that isn’t the case. This requires a meteorologist to communicate their insights, conclusions, recommendations, and the data that supports all of these decisions. The conclusions, recommendations, and insights are valuable, but people and decision makers want to see the data for themselves to make sense of it.

The best meteorologists I know use quality data to tell a quality story. With so many options to get a forecast, it’s important to stand out; this unique story requires unique data. So why do so many meteorologists struggle with getting this unique data?

I want to emphasize the word “unique” here. Radar data is everywhere. Satellite data is everywhere. Model data is everywhere. Forecasts are everywhere. I’ve seen the National Hurricane Center’s track of the hurricane, and odds are good most have, too. Basically, if all or most of the weather communicators have access to or use the information, it’s not unique and people have no reason or incentive to choose one source over another.

So let’s go back to the question: why do meteorologists struggle with getting unique data? As someone that knows a fair amount about statistics, data, computers, and weather…programming is difficult. To be a successful programmer, you – among other things – must know:

  1. Where to get the data
  2. How to scrape or gather the data
  3. Format and quality control the data
  4. Know the tools to process and analyze the data
  5. Output the data or insights into a specific format

This process is not easy. There’s a lot weather data out there, and there are many meteorology-specific and non-meteorology-specific tools out there. These tools have a learning curve, and these tools take time to learn.

Secondly, finding the source of the data takes skill, time, and patience.

Let’s look at this problem. What does weather impact? How about rivers? Here’s a recent forecast for the Cape Fear River near Wilmington, South Carolina:

sep11-blog-rivers

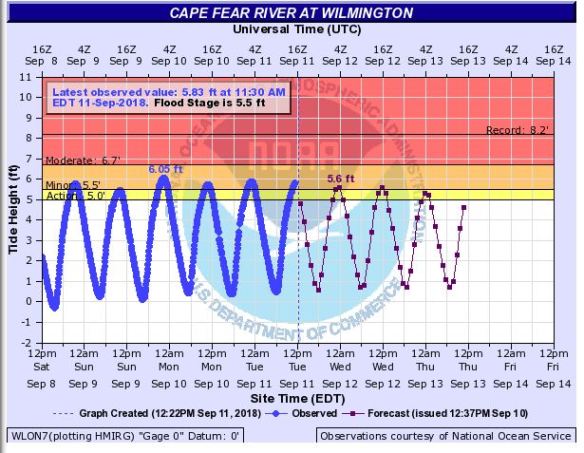
This is a helpful plot of information. It shows past, current, and forecast observations with tide information embedded. As I write this blog, Hurricane Florence is nearing the Carolinas, so flooding and river flooding information is even more valuable. So if I’m in the weather communication world, how do I share this information with my customers? I could screengrab it and share it out, but my bosses may not be happy with NOAA’s brand all over that data.

On the page where I pulled this data, there is an XML and RSS link to the underlying data in the plot above. Within the XML and RSS link, there are observed and forecast data points and corresponding times. We can download this raw data, process it, and export it to a weather communication computer system. So how do we get the data from where is it to where we want it? The answer is: figure it out! Don’t get defeated, don’t get overwhelmed, don’t get angry; instead, research:

  1. What programming languages read and process XML and RSS data
  2. How to use those languages to write code and transform the input data into desired output data
  3. The ways to automate the process.

Next, you have to take the output and use it as an input for your weather communication computer system. That’s where your knowledge of the latter gets used to finish the project and tell a unique weather story.

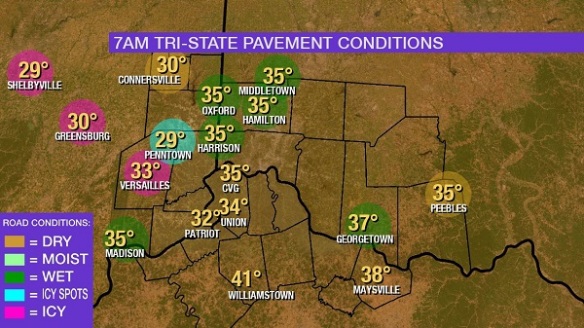
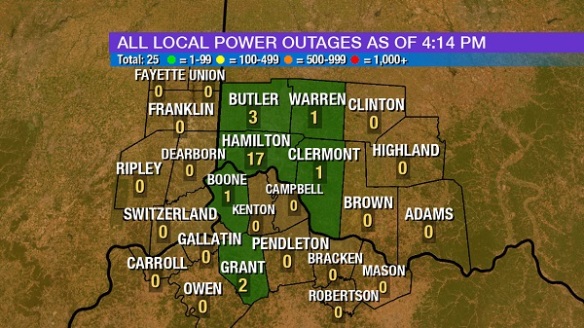
What else is impacted by weather? Power outages, air quality, river levels, road conditions, and more. Those who source the data (power companies, air quality agencies, etc.) typically publish their data in some form to the Internet. So how do you get that data from their final source to your final source? The answer is: figure it out! You can do this, but you have to have the passion, energy, and time to make it happen. It’s important to note that extra time to make a unique product today may save you a lot of time in the future.

Before you think that you can’t get information from that weather-related data website, you can. If you can get it in a browser, you can get the data. You just have to try harder to get it and transform it.

The ultimate goal here, as I alluded to in my blog post from yesterday, is to create a sustainable competitive advantage and cross-promote your product. If you own product A and B, you tell people on Product A to get a unique forecast on Product B, and you tell people on Product B to get a unique forecast on Product A, you’re likely to keep your company happy while also giving your company value.

Need an example of this in action? Try this:

This WTOL-TV’s real-time school delay and closing map. That’s data from an external source (a school closing/delay crawl system or the backend where schools districts report their delays) being inputted into a broadcast machine and colorized/formatted in the machine’s software. There is no doubt in my mind there is (automated) programming here to both export and import the data from one system to the next and to convert the output of one source to an input for another system. This is impressive work, and this is the only place I know that can show this type of data to customers! This took programming, weather communication system, and local school district knowledge plus time, effort, and – perhaps most importantly – passion.

This tweet from Ryan Hoke at WAVE-TV in Louisville, Kentucky shows rainfall data from Louisville Metropolitan Sewer District rain gauges. The data is freely available here. You could import the data straight into Microsoft Excel (which is NOT a programming tool!) and export it out, but there is likely programming going on in the background here to parse the table of rainfall totals. How did Ryan made this map? He saw the challenge, and he figured it out! It’s not incredibly easy to pull this data; some websites have easy access to data, and this site is not one of them. But you can do it!

These are two (rare) examples of importing unique weather-related data into a weather communications system. The company brand is intact, and the freely (well, seemingly) available data is natively flowing into a system where data is shared. This process took a lot of time, effort, passion, patience, and perseverance…but these data can now be promoted, cross-promoted among platforms, and used in real-time to inform the masses.

But wait; there’s more. You can archive this data and leverage of the power of statistics to model out river levels, air quality numbers, and power outages. I know it can be done because I’ve done it.

As I write this blog post, Hurricane Florence is moving west towards North and South Carolina, prompting people to fill up and move inland. Here’s an impactful tweet:

https://twitter.com/GasBuddyGuy/status/1039349719464652800

If you dig hard enough on the Internet, you can find the raw data for this map and bring it into a weather communications system. What a great weather story element!

You have to work hard if you want to tell a better story than everyone else. If customers see value in your product, they will come to you to get that value. But there’s a downside: if you look like everyone else, have the same data as everyone else, and tell the same story as everyone else…you’ll have the same market share as everyone else and be as valuable as everyone else.

The ability to program and use data to drive business decisions and profitability is becoming more important every day. If you can’t leverage weather data to your advantage, your potential as a meteorologist is severely capped.

Weather Communications Has A Problem And Business Thinking Can Fix It

As a meteorologist, a weather communicator, and someone to aims to be humble, I’ve come to accept and respect that the weather community has a critical issue that needs to be addressed. As a businessperson, I see business problems being solved daily, but I also see a solution to the mounting weather communications problem.

This problem is better shown than explained. It’s worth noting that there is a lot of great weather communication out there, and I’m not going to target specific people or companies as much as the product itself. To show this example, I will use New York City, a place I have never worked and with weather communications companies for which I have never worked.

As I write this, Hurricane Florence is a major hurricane in the Atlantic Ocean. Here’s what the New York City NBC affiliate has to say recently:

When I read this, I think to myself:

“What is the ‘breakdown’ coming up? You just gave me the whole forecast. Why do I need a breakdown?”
“What’s on the app that I can’t get here? You just gave me the current conditions of the storm and earlier you tweaked out the track.”
“What are the latest updates? When are these updates coming? Didn’t you just tell me 95% of what I need to know about the approaching hurricane?”

Here’s some of what CBS in New York has to say:

The screaming message here is it will be a cloudy, wet, breezy day in New York. But I’m left with the following questions:

“I could get this on my smart phone now. Why do I need to see your communication that takes up more than a minute of my time?”
“You just told me what was going to happen today. Why do you need to tell me again?”
“There’s a lot of information about others, but I just want the information about me.”

Here’s some of what ABC in New York has to say:

Again, I’ve grabbed some tweets that showcase local warnings, a snapshot of current conditions, and a link to a website where Florence is likely heading…but I’m left with the following questions:

“When is the greatest risk here and south of here from Hurricane Florence?”
“How is Florence going to impact me?”
“You showed me it’s raining now. When is it going to stop?”
“I see the radar and the warning. Where can I go for more information?”

There are other weather communicators out there talking about New York, and here are some of those tweets:

This is just a sampling of tweets (from Twitter). People can follow and trust who they wish, people can get weather from other social media sources, they can get weather information from non-social media sources, or they can – to be honest – live their live without getting informed on the weather at all.

As someone who used to work as a meteorologist (and still is one per my degree) but now works in business, I see the communications problem more clearly now.

Among other things, successful businesses have:
– A product or service people want to buy or use
– New products and services over time to create growth
– Profitability, especially if it’s increasing
– Good leaders, ethics, goals, and boundaries
– Create unique value, especially compared to others
– Have competitive advantages, especially sustainable competitive advantages

I would argue that the last three are perhaps the most important in business. What good is a company without leadership, growth, a bright future, and a moral compass? What good is a business without giving something valuable to customers? And what good is a company that has a product or service that others can easily replicate and scale?

Corporations in this country spend BILLIONS of dollars each year to gather insights about their customers that create value and generate sustainable competitive advantages. I work at one of those companies; every day, I look to create a unique product or service – either externally or internally – that gives the company for which I work value and advantage.

I think Kroger (the grocer) is one of the smartest companies out there. They bring groceries you buy to the store, sure…but that’s not half of the value. They were among the first to give you an incentive to have a shopper’s card; they got your information and purchasing profile, and you get discounts and free items. They give you an incentive to download and use their app; they get your information and additional purchase profile data, and you get access to coupons that you don’t have to carry around the store. Kroger also sends you coupons in the mail to incentivize you to go to the store. They have ClickList that, for a fee, has someone shop for you…and you just pick up the groceries outside of the store; the value proposition here is to save time. Then there’s fuel points: you earn them when you spend money at the store. When you’ve collected enough points, you get a discount on fuel at one of their gas stations. Plus, you get extra fuel points when you buy certain items – like gift cards – in the store. They have a large selection of “store brands” in their stores to save you more over name brands.

Kroger isn’t the only one with good ideas, but they have a value stream. They know how to get you in the store, to the gas pump, using their app, and using their services. They make money not because they create value for you, but also because they have many ways to get your money and connect the value from one place they own to another.

Amazon Prime is similar. You pay for Prime and get free shipping, but they also give you free streaming services, too. Other business have big time value, but the goal here – if you’re a business – is to make money ethically and fairly in as many places as possible and have a value stream that others can’t (easily) replicate.

I tell you all of this to highlight the weather communication problem: there is very little sustainable competitive advantage in weather communication right now. ABC, NBC, and CBS in New York (above) didn’t just give the same or similar forecast; they also:

– Have the same look and color scheme
– Have no information I can’t get on a free/ad-free smartphone app, from Alexa, or on the Internet
– Largely lack a link to easily get additional valuable information
– Largely lack a call to action or impact
– Don’t cross-promote
– Don’t incentivize

The other weather tweets :

– Largely lack a link to easily get additional valuable information (or don’t motivate)
– Largely lack a call to action or impact
– Take a significant amount of time to read or process
– Lack the locality of weather
– Don’t incentivize
– Don’t cross-promote

Marketing a weather forecast has accurate or the most accurate will only take you so far when convenience and value are in play. When all horses in the race run the same, the results will be the same. All of the above groups lack differentiation or sustainable competitive advantages.

New York isn’t the only place where this is an issue, and Twitter isn’t the only place where the problem occurs. So how do we beat the lack of differentiation, sustainable competitive advantages, and incentivization? With differentiation, sustainable competitive advantages, and incentivization, of course!

Weather communicators need to create forecasts, products, and services that no one else can easily create and can cross-promote. The “face” or “person” of reliability and accuracy is dying at the successes of convenience, the discovery of a more “reliable” source (perceived or real), and the fact that seemingly “all forecasts look the same, so any weather update is fine for me.”

Whether it’s power outages, river impacts, business closings, school closings, or some other proprietary forecasts/information and a way to communicate that forecast and drive people to that forecast and drive people to other forecasts on other places within the same brand, what unique value is the weather communication community giving customers?

Meteorologists and weather forecasters need to start thinking like a businessperson. If billion dollar companies are investing billions in creating value and finding a sustainable competitive advantage…why isn’t the weather community working to figure out what their customers want and create the intellectual property to give customers something they can’t get anywhere else?