How Humid Has 2022 Year-To-Date Been? Among The Most Humid Of Your Lifetime

The absolute measure of humidity – or how much moisture there is in the air – is the dewpoint. The highest the dewpoint goes, the more humid it is…and in 2022, it has been high more than it has been low.

But how do you answer the question of “how humid has 2022 so far been?” The answer is: it depends how you measure it, but by most measures, it’s been abnormally humid. For this analysis, let’s look at the hourly dewpoint in Cincinnati from when the airport opened

The average dewpoint based on hourly data at the Cincinnati/Northern Kentucky International Airport since June 1, 1948. We’ll use 8pm on August 5 as the cut-off time for 2022.

Since June 1st, the average dewpoint in Cincinnati (based on hourly data) has been about 65.7°. When you compare this same period of time against previous years at CVG, 2022 ranks as the 4th highest:

By this account, 2022 so far hasn’t been terribly humid, but there are different ways to measure how humid a period of time is. Here’s another way to measure it: “how many hours have we been in humid air?” If you say a dewpoint of 60°+ is humid like I do, we’ve had more than 1,600 hours (more than 66 days) in humid air so far this year:

This calculation, too, shows years like 2010 and 2011 were more humid, but turn the threshold up to 65°+, and 2022 climbs up the list:

That’s nearly 43 days in 65°+ air in the first 217 days of the year. Let’s keep going: 2022 is in 2nd place for the most number of hours year-to-date at CVG with a 68°+ dewpoint:

68° for a dewpoint means it’s very humid, but I consider a dewpoint of 70°+ steamy.

That’s more than 28 days in steamy air so far in 2022. That smashes the previous record of 512 hours year-to-date in 2010. This alone is impressive, but the dewpoint was in the mid 70s for most of Friday (August 5th)…so let’s keep going. CVG has had more than a week with a very steamy dewpoint of 75°+:

That’s also a record. But let’s go a little more. How about 78°+?

To give some perspective on this, of the 610,505 hourly weather observations I used in my calculations throughout this analysis, there were only 179 hours with a dewpoint of 78°+. Put another way, less than 0.03% of all weather observations to date at CVG have a dewpoint that high or higher.

There is no “top 10” list for dewpoint of 80°+ (extremely steamy) weather observations at CVG because a dewpoint that high as only occurred in Cincinnati for a total of 22 hours and across 4 years (2022, 1975, 2011, and 1955). Eight of those hours occurred in 2022, and that is a record for a single year.

The all-time record highest dewpoint for Cincinnati is 82°, set in July of 1943. This was observed at the Abbe Observatory in Clifton, where official records for Cincinnati were kept at the time (and airport to the International Airport opening).

By many measures, 2022 so far has been the most humid or at least among the most humid on record. August 2022 alone has begun with 5 steamy days (based on the average daily dewpoint):

…and Cincinnati is already up to 26 steamy (70°+ average dewpoint) days and 63 humid (60°+ average dewpoint) days so far this year:

To put these numbers in perspective, Cincinnati averages 17 steamy and 72 humid days each calendar year. The records are 98 humid days (1991) and 38 steamy days (1977) for a single year at CVG.

And summer is not over! Steamy air typically moves south in early to mid-September, and humid air is usually done for the year in late September to early October.

Is Cincinnati Cloudier Than Seattle This Year?

Think of the cloudiest place you know. Is it Seattle? Or Buffalo? Or Portland, Oregon? It may be your neighborhood.

There are different ways to measure cloudiness, but looking at the really cloudy days gives an idea of often we are truly gloomy. In Cincinnati, we’ve had 41 days with an average daily cloud cover of 90% so far in 2021, 49 days with an average daily cloud cover of 100%, and 90 days with a 90%+ cloud cover :

We’ll focus on these numbers here, but – as an aside – is this year cloudier than most? The daily average cloud cover so far in 2021 is 61%, but this is not as cloudy as 2017, 2018, 2019, or 2020 year-to-date:

But lets go back to the thought of 90%+ and 100% cloud cover days. Are we cloudier than other long-term climate sites near Cincinnati? For comparison, Cincinnati has had 90 and 49 days of each, respectively, so far this year. Dayton has had 87 90%+ and 49 100% cloud cover days so far in 2021:

Columbus, Ohio has had even fewer of those days (87 90%+ and 42 100% cloud cover days):

The counts for Indianapolis are even lower (76 90%+ and 43 100% cloud cover days):

It’s clear we’re in a local maximum for cloud cover, and I intentionally highlighted areas to the north that are closer to the Great Lakes and in colder air…suggesting the possibility for cloud cover, especially in the colder months of the year.

So maybe if we go north and away and far away from Florida, it’ll get cloudier than Cincinnati, right? Chicago’s 90%+ and 100% cloud cover day count is 40 and 40, respectively:

Maybe it’s cloudier in the tundra of Minneapolis?

Counts are even lower there compared to Cincinnati! Maybe downwind of Lake Michigan? Nope. There have only been 36% completely overcast days in Grand Rapids, Michigan so far in 2021:

Alright…clearly Cincinnati is a cloudy place. But what about the Pacific Northwest? It’s known for its gloom, right? Portland, Oregon has had 29 completely overcast days so far this year, and 78 days with 90%+ cloud cover:

Maybe Seattle is cloudier? While Seattle has had more 90%+ cloud cover days than Cincinnati, Cincinnati has had 11 more 100% overcast days than Seattle year-to-date:

So…where is it cloudier? There are cloudier places! Three cities in the United States that are cloudier than Cincinnati are…Rochester, New York:

…Pittsburgh, PA (with 101 90%+ cloud cover days so far in 2021):

…and Detroit, Michigan (with 107 90%+ cloud cover and 56 100% cloud cover days year-to-date):

So I suppose it could be worse, right, Cincinnati? We are – by some accounts – cloudier than Seattle, but there are at least a few places gloomier than the Queen City.

Has This Month And Year Been Cloudier Than Usual in Cincinnati?

Several people have reached out to me on social media recently about how cloudy this year, winter, spring, or month has been in Cincinnati. Does the data support it? How do we answer this question?

Quantifying cloud cover is difficult because clouds in the sky appear at different layers and with different opacities. One way to measure cloudiness for a period of time is by looking at the average sky cover between sunrise and sunset. This definition is particularly convenient since it is calculated daily by the National Weather Service for long-term climate sites like Cincinnati. For this analysis, we will use this average sky cover metric which is defined as:

The average sky cover between sunrise and sunset in tenths of sky covered. The minimum of “0” (0%) means no clouds observed, “10” (100%) means clouds covered the entire sky for that day. (Source)

Admittedly, data quality is not great from 2010 through 2013, but it is better for more recent years. Also, we’ll use 4pm on May 11, 2020 as cut-off time for this analysis

There are many ways to present the data, so let’s start with just the month of May:

blog_may11_may2020

We’re 11 days into the month and 10 out of 11 days (91%) have had at least 50% cloud cover. Is May usually this cloudy? Does it seem more cloudy than last May? Here was the distribution of cloud cover in May 2019:

blog_may11_may2019

About 84% of all days last May had 50%+ cloud cover, and 22 out of 31 May 2018 days had at least 50% cloud cover:

blog_may11_may2018

There were 23 days in May 2017 with more clouds than sun, and 15 of those had at least 70% cloud cover:

blog_may11_may2017

May 2020 is young, but if the month had ended today, it would be the cloudiest May in the last several years:

blog-may11-maycloudcover

It is worth noting that early May tends to be more cloudy than late May with temperatures rising and a lean from stratus to cumulus clouds…so this average of 70% cloud cover is likely to change and will probably decrease.

How about the year to date so that we can make an apples-to-apples comparison of this year to previous years? So far in 2020, there have been 38 days with 100% cloud cover (Monday was one of them):

blog-may11-ytd2020

Also note the left-leaning tail on the data towards more cloud cover. 81% of days so far in 2020 have had 50% or more cloud cover. In 2019, about 82% of days through May 11th had 50% or more cloud cover; we also had 4 more days with 100% cloud cover through this point in 2019:

blog-may11-ytd2019

Through this point in 2018, there were 15 days with 20% or less cloud cover…compared to 5 days in that same time during 2019 and 2020:

blog-may11-ytd2018

From a year-to-date perspective, 2017 had more 50%+ cloud cover days than 2018, 2019, or 2020…but fewer 100% cloud cover days than those same years:

blog-may11-ytd2017

Finally, 2016 year-to-date had relatively few overcast days compared to 2020, 2019, 2018, and 2018:

blog-may11-ytd2016

How does the average daily cloud cover so far this year compare to other recent years? We’re averaging about 74% cloud cover each day in Cincinnati thus far in 2020; this is about the same as it was in 2017, slightly more than in 2018, and slightly less than in 2019:

blog_may11_ytdaverage

I will remind you that data quality issues affect the averages from 2010 through 2013, but it is clear that the last four years-to-date have been cloudier than the four that came before it. So what is driving this? This is not an easy answer, but here are some high-level thoughts:

  • March 2020, 2019, 2018, and 2017 had 8, 10, 11, and 7 completely cloudy days respectively compared to 8 in March 2016, 8 in March 2015, and 2 in March 2014.
  • March 2020 had no days with 0%, 10%, or 20% cloud cover.
  • February 2020, 2019, and 2018 had 11, 9, and 14 100% cloudy days whereas February 2017, 2016, 2015, and 2014 each had 5 to 8 completely cloudy days.
  • January 2020, 2019, and 2017 all had left-tailed cloud distributions, whereas 2018, 2016, and 2015 had more even distributions.
  • Overall, cloud cover in January, February, and April between 2017 and 2020 was a couple to few percentage points higher than in those same months of 2014, 2015, and 2016

Relative to averages, precipitation surpluses are 2.85″ and 0.94″ since January 1st and March 1st, respectively. It makes sense that a wetter than average start to the year is likely a frequently cloudy start to the year as well.

The more complex answer is not as easy to pinpoint. Temperatures several thousand feet above the ground have an impact. The timing of weather systems, wind speeds at the ground and aloft, and snowpack can all influence cloud cover.

And, in case you’re wondering how Cincinnati’s 38 days so far in 2020 with no sunshine compares to other cities…

Denver has has 3 of those days:

blog_may11_den

Minneapolis has had 25…

blog_may11_msp

…and the infamously cloudy Seattle, Washington has had 25:

blog_may11_sea

Brighter days are ahead, so hang in there!

18 Ways To Become A Better Meteorologist

I’ve often reflected on my days working as a full-time meteorologist, and I wish I had learned some key lessons much earlier in my career. Alternatively, I wish there been someone to be honest and tell me these lessons of life years ago. Being a meteorologist is a challenge, a gift, a pain, and a reward. It’s easy to get lost in your career and model data, but after 10 years working as a meteorologist and 1.5 years working in the business world (and also time to reflect of my previous career), I wanted to share 18 ways to be the best meteorologist you can be:

1. Realize what your job really is. Suppose you’re an NBA player. What is your job? Is it to score the most points? Is it to be the game MVP? Is it to get the least number of fouls? It’s none of these. It’s actually to get the most number of people in the stands and watching you on TV as possible. It sounds selfish, but without tickets being sold and audiences watching you, you’re likely to be out of a job because your team needs to make money. Now suppose you as a businessperson at a local firm. What is your job? Is it to make the most numbers of sales in your peer group? Is it to give your customers a new product or service every month? Is it to build your resume? Just like the NBA, it’s none of the above…and it’s really to maximize the company’s profits and brand ethically, sustainably, and responsibly. Now you’re a meteorologist. What is your job? It is likely to increase your company’s profits. If you’re a operational meteorologist in the private sector, it’s to get people paying for your forecasts or seeing advertisements where they are posted. If you’re an National Weather Service meteorologist, you’re in a unique position: your job to to issue forecasts, outlooks, advisories, warnings, and watches that protect life and property…or create tools that fulfill this mission. If you’re a broadcast meteorologist, your job is to sustain or boost ratings through marketing and accurate forecasts (perceived or reality). You don’t have to have the best forecast to make the most money; you just have to have superior perception or superior value to customers.

OLYMPUS DIGITAL CAMERA

2. Start looking at those you forecast for as customers. Speaking of customers: those who see your products and forecasts are not “viewers” or “the public.” They are customers. If you think back to your summer jobs in high school and college, you served customers with a smile and by giving those who came into your business a product or service with value. People who read your forecasts or hear your weather presentation should be treated with respect and dignity; there’s no inferior customer, and you should work to give them what you want within reason.

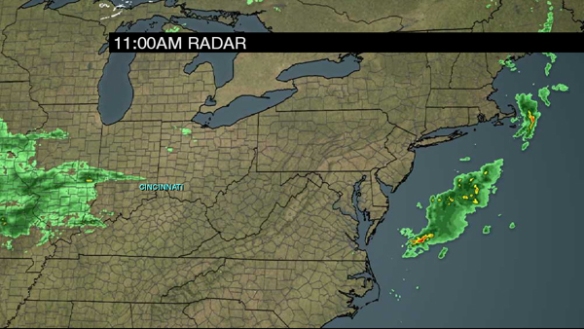
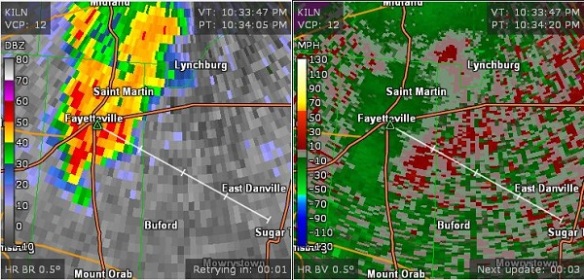
3. Data and insights are the best way to be different. So you have a good forecast, and you need to make the company money through your customers. What’s the best way to attract them to you? Your bright and cherry personality? Your good looks? Your wonderful smile? Your baritone pipes? Talking like you’re on old time radio? Try a more humble approach: data and perspective. You have storms moving through; they are threatening and strong. What do your customers want? They want to know where the storms are, where they are moving, and what impact they will have. Your shiny personality won’t save you; you need to know how to use radar (reflectivity, velocity, spectrum width, and all of the dual-pol products) and know the threats before the National Weather Service does. They want to know where power outages are. They want to know whether this is normal; that’s where your experience comes into play. They want to have minute-by-minute updates of what conditions are like; knowing where to find airport and local weather sensor data will enable you to tell your customers with confidence what is and isn’t happening. Knowing where to find field and model data that no one else can will give you an advantage over your competitors but will also inform your customers. Telling your customers is one thing; showing your customers is another. Are you getting that data that tells your weather story into your forecasting or weather presentation system? You should be. If you’re not, figure out how to make it happen! Learn and innovate!

4. Aggregate and organize data behind the scenes. This will save you a lot of time and enable you to focus more on what’s important. Programming will help you assemble model guidance and quality control it so you don’t have to waste time each day when you’re forecasting. Surprise! There’s an earthquake! Are you ready? How are you going to be a source of information to your customers? If they get valuable insight and information from someone else, you risk losing your reputation and credibility…and, more importantly, perhaps your job and company’s profitability.

5. Ask your customers want they want, and give them some of what they don’t. Let’s go back to that NBA game where you’re a point guard. What do your customers want? They want to be entertained! They want you to win the game, especially by a game-winning-buzzer-beating shot! But let’s say you’re not a big 3-point player; on occasion, take a 3-point shot. Your fans won’t be expecting it or even want you to take the long shot, but they will be happy if you make it. As a meteorologist, that means things like explaining vorticity at a very basic level and why it matters. It also means varying your style; take a dare to be different at least occasionally, even if your customers like a pattern.

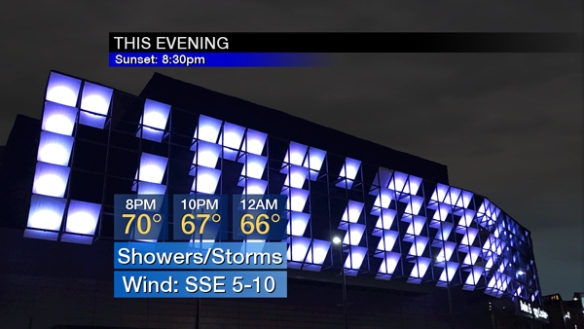
6. Forecast specifically, and lead with what you know. Your customers can get a wishy-washy forecast for “a chance of storms today” from anywhere. Lemme guess; you have the word “details” in the tease to your forecast? Your customers have seen that. Give your customers an accurate forecast. Say “scattered showers and thunderstorms between 1pm and 7pm” with confidence. Some days, you’ll have models that are out to lunch. Tell the people what you know. When is the most likely time for rain? Can you say with confidence that the rain will be light? How would you describe the coverage, even if you’re a little off? What will happen, and what is to be determined? Don’t focus on potential or what won’t happen; focus on what is certain.

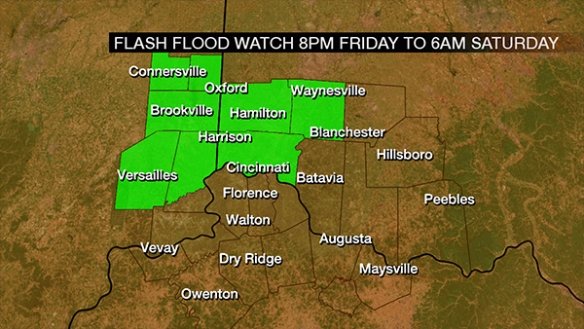
7. Don’t be a National Weather Service repeater. Be a meteorologist. If your prime responsibility is to just relay what the NWS says, you’re not using your degree in meteorology, and they are. You don’t need to tell your customers about every alert the NWS issues, including non-life-threatening alerts like Flood Advisories. If you feel that the National Weather Service is slow to the punch on an alert (or warning), tell your customers; you don’t need to wait for their blessing. They aren’t waiting for you, and you have the same degree (at least you should), so get movin’!

radar

8. The best starting forecast is the last shift’s forecast. It’s a lot easier to use the previous shift’s forecast as a starting point. Ask yourself: do I have justification to raise high temperatures 1° every day for the next 5 days. Think of your customers: do they care? Is it better to be consistent or forecast every shift not even considering the slew of model data the previous shift reviewed? Humble yourself, and recognize that there is value in your predecessors’ work. It’s also a lot less work to use the previous forecast as a starting point.

9. Don’t be so eager. If you’re willing to work turn-around shifts or go to work on a few hours of sleep, you’re likely too green. Don’t be a sucker. Say “no” at least occasionally. Do your job, and go home. Don’t get walked all over. If you’re working all of the holidays, weekend, and non-prime-time shifts, you’re getting the shaft. Over time, you should be advancing. You’ll look like on your “green years” and shake your head if you’re not careful.

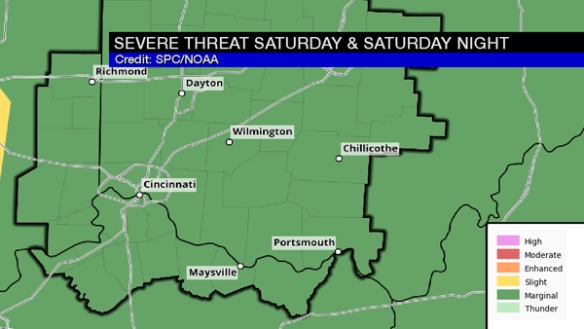
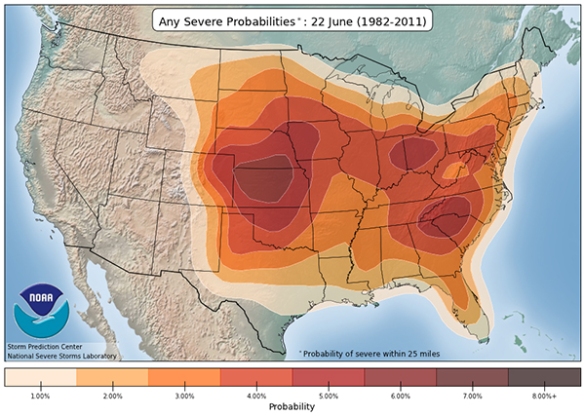
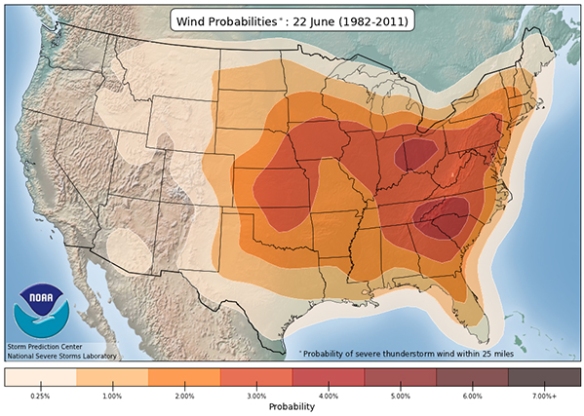
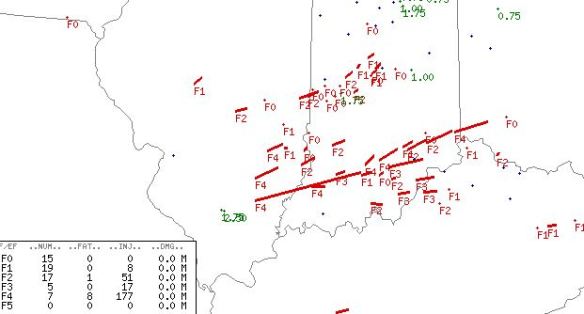
10. Perspective requires research. When you’re going into a severe weather event, do you know the last time a tornado was confirmed in your area of responsibility? Do you know how rare an EF-2 or EF-4 tornado is for your area? When an insurance firm says that the damage caused by storms in your areas responsibility is estimated at $1 billion, does that seem right? If you’re expecting a high of 100°, are you prepared to answer questions from your customers about how often your area of responsibility sees a high of 100°? Regardless of what you do as a meteorologist, you need to provide perspective on weather events. Being a smiling face and personally won’t cover for you when you have to explain weather to your customers.

jul22-blog-tracks

11. Force yourself to get away from work. You can’t work all of the time. Time out some of your social media posts. Get a good significant other. Make friends. You need distractions from work or you’re going to burn yourself out. If you must post on social media during your days off, however, use your office tools to post data to a website where only you (or others, if you want) can grab it and post it; this is a good way to post your brand while not at work. Your job should only be a part of your life.

12. Be ready to move at any time. Whether you’re a National Weather Service meteorologist, a private sector meteorologist, or a broadcast meteorologist, it is highly likely you’re going to have to move during your time as a meteorologist. You’ll likely need to do it to advance. Suppose you’re in broadcasting, and you want to be a chief meteorologist. Do you think you’re going to get the job from your current chief when he or she leaves? That’s probably not going to happen. It does happen, but it’s not likely. It’s far more likely that you’re going to have to move to Omaha, Boise, San Antonio, or Huntsville to get your chief gig. And then you have to love that town and city and connect with it. Are you willing to do that? Now suppose you’re an NWS meteorologist and want to be a lead forecaster. Are you willing to move to North Platte, Nebraska to do that? You may have to. There aren’t a lot of meteorologist jobs in any given town, so if you want to advance in the industry, you’ll need to pack yourself or your family up and move at least once…and likely a few times before you’re in a semi-permanent spot. Going back to the earlier example, even the best NBA players got traded or went to a new team after a while.

jul22-blog-moving

13. Corporate consolidation is not your friend. The modern way of doing big business – so it seems – is to buyout a company and collect their revenue while paying down the debt. Every good business, realistically, needs to monitor their cash flow (both revenues and costs) and increase profitability. One way to do this is to scale. If you stay with your company long enough, they will likely be bought. Even The Weather Channel got bought by IBM. The National Weather Service is likely exempt from this clause, but the broadcast and private sector will see this for years to come. When you get acquired, the rules change. Managers get fired and replaced with new ones. The expectations and demands of jobs are different. The culture changes, and – unfortunately – the ethics of your employer can change. If you don’t like your new company, there are a decreasing number of employers for which you can work (they are consolidating). If you leave Company A and go to Company B, there’s a chance Company A will buy Company B, and your soliloquy about “poor working conditions here at Company A” will come back to bite you. Leave on good terms as much as possible because the grass isn’t always greener and everyone is buying up land.

14. Ask yourself two questions frequently: “Do I enjoy doing this?” and “If not, how much longer am I going to do this?” When you first start in meteorology, you’re going to be bottom man or woman on the totem pole. You should be, but – in time – you should also advance. Unfortunately, some people don’t advance, and some – even worse – get demoted over time despite good performance. Meteorology and communication are inherently linked, and – despite what you may or may not know – companies often know who they want to communicate more than who they believe is the best meteorologist. With everyone marketing themselves as giving the “more accurate” forecast, companies need to position themselves to have an advantage. They will do that in any way possible. Your responsibilities may not be purely meteorology. Your schedule may be affected by what a company wants to do with you. You may be paired up with people that you like or don’t like. Your team may be great, or your team may not be great. Too few meteorologists regularly review their current situations and ask themselves if they are happy and successful. If you aren’t happy, set a time limit for how long you’re going to do what you’re doing. You’ll need to pay your dues early in the game, but you’ll also need to move on if you’re getting a raw deal.

15. Be careful what intellectual property you create for your company. If you’re not happy where you are, be mindful of what you’re building for your company. Do what is asked of you…but if you’re on your way out, don’t go sharing every idea you have or implementing new competitive advantage tools to make the company better. That idea you’re sharing or implementing may be the company’s once it leaves your lips. Instead, share your brainy ideas in a place and with a company that appreciates you and what you’re developing.

16. You aren’t ready for office politics, but you can and should learn them quickly. There is no high school or college course – that I know of – that prepares you for office politics. Careers in meteorology – like all forms of business – have politics. Companies put people where they want. Companies have their top picks and their bottom picks. You’ll have your days where you feel valued, and there will be other days when you feel very unimportant. Office politics is a complex game that you should not be a master at. Instead, I suggest distancing yourself from problematic people, not insulting others, and laying low. If you’re frustrated, don’t make a scene, and be respectful when solving problems. It is often better to be quieter and watch (and learn from) others who harm themselves and their career for fighting the law (and watching the law win).

17. There will always be someone younger than you who wants your job, and they will do it for less than you. It’s the truth. If you get greedy, companies will find someone else who will take less of a salary and fill your seat. Follow the trends of companies who hire meteorologists. Who are they moving and why? Who are they hiring and why? The trends will help you know whether you should stay or get out of the way.

18. The hardest thing to predict is human behavior. You will, however, be much better prepared if you look for clues and red flags constantly. Circling back around to the NBA player example above, being a basketball player is more than scoring points. You are part of a business, and if you aren’t giving what the business wants, your days are numbered. Understanding what the business wants you to do and mastering that goal is your number one job objective. Business needs, however, change…so you must be willing to listen, learn, and innovate. You must anticipate and monitor your company’s business goals and opportunities and prepare for them. If you’re the leagues best scorer, but the fans and business want close games to drive ratings and create a certain experience, you better strategize how and when you put points on the board. As a meteorologist, this means understanding your business, what they define as value, positioning yourself to fulfill the company’s goals.

Remember that most meteorologists that start their working life in meteorology usually end their working life in another field. It’s okay to evaluate your happiness and success frequently, and it’s okay to make a change. As long as you’re in meteorology, strive to stand out and be different in a positive way. Do they have “one of you?” If so, there’s a better fit for you elsewhere…or you should showcase a different talent. Michael Jordan wasn’t an actor, and he wasn’t in movies and getting endorsements because he was made for the big screen; he got the right kind of attention and he gave his customers want they wanted.

Let’s Talk About The Severe Threat Later Today

Are you aware that strong and severe storms are a possibility later today? You should! If not, let’s break down the threats and timing.

The Storm Prediction Center has placed the Tri-State in a slight to enhanced risk for strong to severe storms through sunrise on Saturday:

The risk is driven by the large hail threat, but the threat for damaging straight-line wind and flash flooding are still significant. The tornado threat is in play, but it is a secondary threat at this time. Here’s a breakdown of how I see severe threats for later today:

Notice that the threat for severe storms is focused after 5pm today and throughout the evening. Additional rounds of thunderstorms are likely after midnight, but the atmosphere will likely be worked over pretty hard by then. Even with this considered, you should be weather aware through the tonight, including through the overnight.

There is also a Flash Flood Watch in place for most of the Tri-State from 7pm Friday through 11am Saturday:

Temperatures are the in process of rising through the 50s and 60s as of 11am:

…and dewpoints are also rising:

These numbers are not supportive of severe storms, but dewpoints will be rising through the 50s and 60s this afternoon and evening. This will support an increasing threat for thunderstorms – including severe storms – as the day and evening progresses.

A visibile satellite snapshot shows why the threat for severe storms is highest over central Kentucky and southwest of the Tri-State…more sunshine:

The first wave of showers will float through the Tri-State this afternoon (especially between now and 3pm) and is already appearing on radar:

These showers and storms are moving northeast at 45mph.

Showers will develop this afternoon, but the threat for thunderstorms will wait until late this afternoon and evening. Notice temperatures will rise through the 60s and 70s this afternoon:

Showers and thunderstorms are likely from late afternoon through this evening in waves:

Some storms may be strong or severe through tonight. Also, note that the Tri-State is in a marginal risk for severe storms Saturday:

This is an evolving threat, so stay weather alert through the day, evening, and throughout the weekend!

Flooding And Severe Threat Through Saturday Night

A Flash Flood Watch has been posted for much of southwestern Ohio and southeastern Indiana, thanks in part to saturated soil after last night’s heavy rain:

sep9-ffw

While the coverage of showers will be low through mid-evening, scattered showers and thunderstorms will develop late this evening and early in the overnight. There is a risk for strong storms tonight, but the main concern is flooding and flash flooding in the watch area.

The Storm Prediction Center only has communities northwest of Cincinnati in the marginal risk for severe storms through sunrise:

sep9-spctonight

Even if storms aren’t strong or severe, they may produce heavy rain and frequent lightning.

While the Flash Flood Watch will expire at 6am, the threat for flooding and heavy rain returns Saturday afternoon and evening. The threat for strong and severe storms will also be higher Saturday, especially for areas east of Cincinnati:

sep9-spcsaturday

The most likely time for storms – including strong to severe storms – Saturday is 2pm to 9pm. Damaging straight-line wind is the main threat:

sep9-impacts

The key takeaways here are to be aware for flooding and strong storms through Saturday night. The risk for both of these is highest northwest of Cincinnati tonight and along and east/south of I-75 and I-71 Saturday afternoon and evening. Never drive through flooded roads!

A Threat For Strong And Severe Storms Thursday And Friday

While the threat is small, you should be alert for strong and severe storms Thursday and Friday, especially during the afternoon. Even if storms aren’t strong, some cells may produce heavy rain and lightning.

Models are quite sloppy with the coverage and timing of showers and storms Thursday and Friday. Wednesday morning’s NAM model has precipitation developing in the Ohio Valley around 2pm Thursday afternoon:

sep7-2pmthursday

The same model also has showers and storms developing in the Tri-State Friday afternoon:

sep7-2pmfriday

Other models and guidance is not as aggressive with the coverage storms both Thursday and Friday. My forecast for Thursday calls for scattered showers and storms developing, especially during the afternoon and ending in the evening.

The Storm Prediction Center has placed areas west and north of Cincinnati in a marginal risk for severe storms Thursday:

sep7-spcthursday

The marginal risk is farther west in SPC’s severe weather outlook for Friday:

sep7-spcfriday

At this point, all severe weather threats for Thursday and Friday are low and mainly during the afternoon and early evening. Here’s are forecast severe impacts for Thursday:

sep7-thursdaythreats

And here is the breakdown of threat for Friday:

sep7-fridaythreats

Be alert! This threat may change in the next 24 to 48 hours.

Why The Dewpoint Needs To Be A Part Of Official NWS Weather Records

Everyone knows the word moisture. It is a fundamental ingredient for making precipitation or even keeping it away. It is the reason why it was humid today; the more moisture there is in the air (the higher the dewpoint), the more humid it is. The dewpoint is critical for knowing whether clouds will form or whether they will break apart. The dewpoint has either a direct or indirect impact on the strength, positioning, and timing of all weather systems. The dewpoint (a temperature) can impact the air temperature and what type of precipitation falls at the ground and aloft.

For some reason, though, the dewpoint is not listed in official weather records (kept by the National Weather Service in the United States). When you look at weather records for the month of July 2016 in Cincinnati (so far), the maximum, minimum, or average dewpoint is nowhere to be found:

jul21-blog-cf6cvg

Records of air temperatures, precipitation, snowfall, wind speeds, and even snow depth are kept every single day. Yet the dewpoint is not here. Why?

The dewpoint is so important that is it listed not once, but twice in airport weather observations:

jul21-blog-metars

The red number is the dewpoint to the nearest whole number (°C), and the green number is the dewpoint (°C) in tenths (and the first “0” or 1″ here is used to indicated whether the dewpoint is positive or negative, respectively). It’s important enough to go here, but not in official weather records?

The dewpoint is so important it is measured vertically using a weather balloon (to the top of the troposphere, the layer of the atmosphere that we live in and where weather occurs) twice a day at numerous sites around the country and the world. Here’s the weather balloon “sounding” from 8pm Thursday night from Wilmington, Ohio:

jul21-blog-sounding

Guess what the green line is? It’s the dewpoint! It’s right next to the temperature in red! Wind directions and speeds (listed as barbs on the far right) are also listed. And that’s it for a weather balloon sampling! Every other variable is derived. If the dewpoint makes the variable list here, it should be in official weather records

You want to know what the record lowest or highest dewpoint was at a pressure of 850 millibars (about 5,000 feet above the ground) back to the early days of when weather balloons were launched? Here you go! It’s all here! Want to know how the average dewpoint this month compared to last month or last July? It’s not easy; even the most data savvy meteorologists will need time to make this calculation.

Keep in mind, temperature ranks for a week, month, year, decade, or ANY stretch of time are done by averaging the average temperatures for each day in that period. The average temperature for the day is simply the high and the low divided by 2. I can calculate the average temperature for a year or month and compare it to a similar length of time easily because high, low, and average temperatures are listed in official weather records. High, low, and average dewpoints are not. Comparing the average dewpoint for one year to another can take hours. It should take minutes.

Part of the argument is that dewpoint records don’t go as far back as temperature records. Hourly dewpoint records for Cincinnati go back to the late 1930s, but temperature, rainfall, and snowfall records go back to 1870, 1870, and 1893 (officially and respectively). So it’s not the same period of record…but so? Records are records. The first half of 1872’s temperature records in Cincinnati are gone; they were lost in a fire. We didn’t throw out the entire record on account of some records being lost. Jackson, Kentucky’s weather records (at the National Weather Service office there) began in 1981, some 100 years after Cincinnati’s records began. Still, we aren’t throwing out weather records from Jackson because their period of record is less than 40 years.

It’s time to add the maximum, minimum, and average dewpoint to official climate records for the United States. Moisture in the air is fundamental to understanding what type of weather occurs and how poor conditions will be. The public, not just meteorologists, should have knowledge of how weather conditions are changing so that we can see how moisture is moving over time and space. With a large enough period of record in place, dewpoint records will add to the ongoing discussion about climate change and give all a better indication of whether certain areas are more humid or less humid over time.

Update On Wednesday And Thursday’s Severe Weather Threat

As I highlighted in my Sunday blog post, there is a significant threat for severe storms Wednesday, Wednesday night, and early Thursday. Damaging straight-line wind was the main concern per yesterday’s guidance, and it still is the main threat. The tornado threat, though, has come up, but it is still a secondary threat at this time.

Just after 3am on Monday, the Storm Prediction Center placed the Tri-State in a slight to ENHANCED risk for severe storms Wednesday and Wednesday night:

jun20-spcday3

The highest potential for severe storms is focused northwest of Cincinnati.

This morning’s guidance has shifted the main area of severe weather farther north into the Great Lakes. Despite this shift, we are still in a significant threat for severe storms Wednesday and Wednesday night.

In yesterday’s blog, I discussed the derecho parameter. While I am not forecasting a derecho at this time, this parameter gives us an idea of how high the damaging straight-line wind threat is IF storms occur. Here’s what this morning’s NAM model thinks the derecho parameter will be at 2am Thursday morning:

jun20-blog-2amnamderecho

Clearly, these are high values (anything over 5 is very significant, really) over the Great Lakes and Ohio Valley. Here’s what this morning’s GFS model thinks for the same time:

jun20-blog-2amgfsderecho

While values are not as high, they are still high.

While computer guidance suggests the complex of storms may stay focused to our north, the Weather Prediction Center suggests there will be warm front (the leading edge of warmer air bisecting the Tri-State) Wednesday night:

jun20-blog-wpcsurface

The air mass lifting in from the southwest will be warm, humid, and unstable, and the front will help provide shear (the change in the speed and direction of the wind). All of these elements combined elevate the threat for tornadoes and damaging-straight wind locally (despite a higher threat closer to Chicago).

The Significant Tornado Parameter tells us where there is a elevated risk for tornadoes IF storms can form. Number greater than 1 are usually supportive of at least the potential for tornadoes. Here’s what Monday morning’s NAM model has the significant tornado threat at for 8pm Wednesday night:

jun20-blog-8pmnamtornado

This is elevated. Let’s see what Monday morning’s GFS model has for the same time:

jun20-blog-8pmgfstornado

This is also elevated. Notice that this does not guarantee tornadoes, but it does show us the magnitude of the tornado threat.

It is also important to note that model guidance is NOT is not a forecast. A meteorologist must review other guidance to make a forecast, and here is what I have come up with for now regarding late Wednesday and early Thursday’s severe weather threat:

jun20-severeimpacts

This forecast may change as model guidance changes and as we near the event. Know that the damaging straight-line wind threat and tornado threat are both in play for late Wednesday and Thursday. I’ll update this blog as needed.

What We Know And Don’t Know About Wednesday Or Thursday’s Severe Weather Threat

In the Ohio Valley, it is rare to be put in a severe weather risk area by the Storm Prediction Center more than 3 days out. This week will feature one of those rare occasions.

The Storm Prediction has put the Tri-State in the 15% severe storm risk for Thursday. The 15 percent risk means SPC feels there is a 15% probability of a tornado, severe hail, or severe wind event occuring within 25 miles of a point:

jun19-blog-spc

This is – essentially – a “slight” risk for severe storms on Thursday. The 30% area would be the equivalent of an “enhanced” risk. “Marginal,” “moderate,” and “high” risk equivalents are not issued on forecast days 4 through 8.

The takeaway here is that the Storm Prediction Center feels there is a significant severe weather threat in the Great Lakes and Ohio Valley Wednesday.

Or will it be Thursday? Models disagree on the timing of this mid-week storm threat.

There is already a buzz on social media about a complex of storms racing through the Midwest and Ohio Valley Wednesday. Some are predicting a “derecho” (a long-lived complex of storms that causes wind damage over a large area), which predicting at this range is not worth our time and ridiculous. The definition of a derecho is loose. The SPC believes a derecho must go 250 miles and contain separated 75mph wind gusts. Others disagree that a derecho needs to fulfill this requirements.

Regardless, let’s investigate this severe threat using the derecho parameter, which suggests where derechoes may grow or evolve IF storms are able to occur. The higher the derecho parameter, the better the support for them. Here’s what Sunday morning’s NAM model suggests the derecho parameter will be at 2pm Wednesday:

jun19-blog-2pmwednam

Clearly, there is a significant risk for storms with damaging wind to our west Wednesday afternoon if you believe this model. Let’s compare it to Sunday’s morning’s GFS model:

jun19-blog-2pmwedgfs

The GFS is not as impressed with the threat compared to the NAM, especially for Indiana. It is a model model with a different engine, but it is still showing a significant risk for storms with damaging straight-line wind. The GFS model actually holds the better threat off until Thursday:

jun19-blog-2pmthurgfs

The NAM model produces a future radar product. Here’s what Sunday’s morning’s NAM model suggests the radar might look like Wednesday morning:

jun19-blog-8amwedradar

…and here’s what it suggests the radar will look like 12 hours later:

jun19-blog-8pmwedradar

Even history suggests we need to watch for a damaging straight-line wind threat. The Storm Prediction Center’s database suggests the historical odds of seeing severe weather on June 22 is focused over the Tri-State, central Plains, and Carolinas:

jun19-blog-anysevere

When severe weather occurs in the Ohio Valley on June 22nd, it is very likely to be a damaging straight-line wind report versus a tornado or large hail report:

jun19-blog-wind

It is apparently that we need to monitor the damaging straight-line wind threat later this week, although tornadoes and large hail are possible with any storms that sweeps through the Ohio Valley. Our confidence, however, is muted when we see discrepancies in model guidance. The last two runs of the European forecast model (ECMWF) suggest the damaging straight-line wind threat will peak late Wednesday night or early Thursday. It is the “middle of the pack” right now.

Stay tuned. Wednesday and Thursday are days to be prepared for strong and severe storms.