10 (Relatively) Easy Steps I Recommend For Being A Better Meteorologist And Communicator

As I transition away from a chapter of my life centered on meteorology, I’ve realized I’ve learned a lot about what methods work in weather and which ones don’t. There are no hard-and-fast rules for success in meteorology or weather communication (and I’m continuously learning every day). After more than 10 years of weather, I wanted to share what I believe are 10 relatively easy ways to be a better meteorologist and communicator

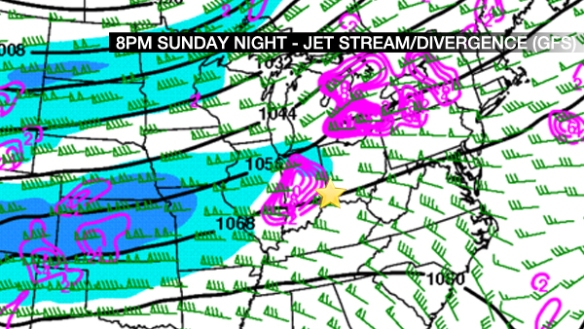
1. Look to see what is going on. It is a huge mistake to just jump into the model world without reviewing recent weather trends. Where are the clouds, which way are they moving, and what altitude are they at? Where are the upper-level troughs and ridges? Where is their surface convergence and upper-level divergence of air? How fast and in what direction are showers and storms to the west moving? Computer forecast models frequently suck, so blindly depending on them will get your feet to the fire frequently. You should be spending at least several minutes each time you forecast looking at radar, satellite, water vapor, weather balloon, and surface report data before you even look at a computer model. While it is a mistake to expect models to match reality (they shouldn’t match), you can better gauge a given model’s strengths and weaknesses if you know what has occurred recently. As my father told me when I was a child, “You’ve got to know where you’re at to know where you’re going.”

2. Stop being everyone else. Just because there are many meteorologists in the country using 4-panel computer forecast guidance plots doesn’t mean you have to. Just because there are many meteorologists in the country that frequently say “those temperatures” and “these temperatures” does not mean you need to. Just because there are many meteorologists in the country that make heavy use of the terms “tracking,” “watching,” and “alerting” doesn’t mean you need to. Just because someone found success in forecasting an event or communicating the impacts of that event effectively doesn’t mean you’ll have the same success nor does it mean he or she will have the same success during the next event. There’s nothing that says you can’t dress for the job you want even if everyone else is wearing business casual. There’s nothing that says you can’t use forecast tools that the veteran in your office refuses to use. There’s nothing that says you have to put your forecast slides in a specific order. You don’t have to and you shouldn’t forecast and communicate like everyone else. You have to respect the spirit of the previous forecast (see below) and the ideology of where you work, but part of what you gets you a meteorology gig is your technique and individuality (at least I hope that’s how you’re measured). Your time is best spent maximizing your potential – whether it’s telling a weather story through explainer graphics, using long-range forecast analogs to give your customers insight beyond the week ahead, or developing unique data sets that can augment weather coverage – and not comparing yourself to other people. If everybody looks the same, success (pick your metric) is more likely to be evenly distributed.

Think of it this way: if you really like a store that’s 10 miles away, and a new company opens nearly the exact same store 5 miles away, odds are good you’ll start going to the closer store and – over time – both stores will have about the same number of customers (all other factors equal). A third and fourth store may open up, and the pattern repeats. Now suppose the store that’s 10 miles away has the special sauce, the secret weapon, and the sustainable competitive advantage that their competitors can’t reproduce; odds are good you’ll continue going to or start going back to that store. The moral of the story here is that the store 10 miles away from you dared to be unique and not like everyone else and got the customer base, attention, and income they earned and deserved.

3. Look at the previous forecast. If a previous forecast is available, you should be looking at it every time you forecast. The last forecaster – hopefully – spent hours looking over information before you showed up; they probably saw a few things in model guidance that you don’t see in the first few minutes of being in the forecast chair. Additionally, when every forecaster in the group reviews the previous forecast, there is more consistency, which benefits the customer and reduces the amount of work (in the form of updating) for forecasters. Refusing or simply not being interested in the current, persistence forecast signals arrogance and ego, and these elements of your personality will surface in time whether you try to hide them or not.

4. Make an actual forecast, and don’t be wishy-washy. Models suggest fog late tonight; odds are good many meteorologists will forecast “patchy fog” or “fog possible.” One computer model says showers are coming Thursday, but another says we’re dry. What’s the forecast? “Showers possible.” Showers are on the far outer-edge of an area of low pressure are approaching. In these scenarios, I often hear “there’s a slight chance for a few scattered showers.”

These are not strong forecasts. These are the meteorological equivalents of a punt in football. If you spend some time in the models or know your climatology, you’ll know where the fog will be favored and – with time and the right education – you’ll be able to forecast what the visibility will be at several spots. Fog is more than possible; it’s something every meteorologist should be able to forecast. When it comes to clouds and showers, you have more than just the latest model runs to look through; you can look the runs before them and the previous forecast. You can review the model trends for a given forecast hour. You can look at ensemble models. You can look at individual ensemble models members. You can look at satellite and radar trends.

Regardless of what you use, you should always make a forecast and run the risk of being wrong just like every other meteorologist in the world. You’re far more likely to gain credibility and respect from a customer if you give them the information they want to hear and be as specific as you can.

In a world where all the forecasts are “chances,” “possible,” “something to watch,” or some other form of hedging a bet, you want to be definitive, honest, and to the point. If you want to stand out from the crowd, don’t be wishy-washy.

5. Be conversational. It’s easier said than done, but communicating a forecast is just talking…so just talk. Talk in the same way you would to a friend sitting next to you on the couch about the weather; if you do this, you’ll avoid all of the terrible forecast crutch phrases. I’ve never had a meteorologist talk to me about the weather and say “those temperatures are going to fall through the 50s overnight;” instead, they say “we will fall through the 50s overnight.” You don’t talk to your mother about “windy conditions,” but you will say “it’s windy, but the wind will relax this evening.” Have you ever seen two people describe the weather for the “nighttime hours tonight?” I haven’t, but I’ve seen meteorologists do it. Have you ever looked up outside and thought the skies were beautiful? You said the sky was beautiful. I still don’t know what a thundershower is. If a cell produces lightning, it’s a thunderstorm; if it doesn’t, it’s a shower. Did you ever learn about thundershowers when you first learned about the weather in grade school? I didn’t because they don’t exist.

Important parts of communication are subject matter knowledge and relaxing. If you’re using crutch phrases, you’re either nervous or not as familiar with current weather and upcoming changes as you should be. Treat the camera as a neighbor. Treat your customer in the forecasts you draft as a friend you’re standing next to.

6. Review recordings of what you communicate, and work to improve what you didn’t like. When I was early in my broadcast career, I would record weathercasts from different television markets off of TV station websites. Of the ones I liked most, I would transcribe what the meteorologist said to text. I found several great weather phrases just by reviewing and typing out these recordings. I got in the habit of doing that in my next two jobs for at least a couple of months. I learned a lot, and I realized something important:

In my opinion, the best weather communicators spoke in complete, full sentences that flowed together and connected their content back to the forecast.

When you speak to another person either in person or in writing, you write in full sentences that flow together and often tie back to a central theme. That’s what communicating a forecast is all about: flow and emphasizing key points with inflection.

Whether you produce written, audible, or visual forecasts, record it and watch it. See what you did well and what you could have done better. Do this process for your presentations until you strengthen the good and eliminate the bad. Use pauses in your presentation. Inflect your voice when you’re highlighting what is important. If nothing else, avoid cliches and replace them with something better.

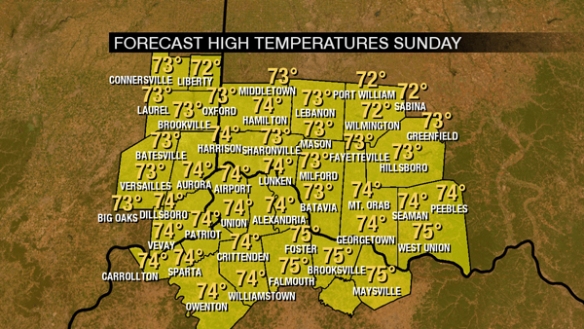
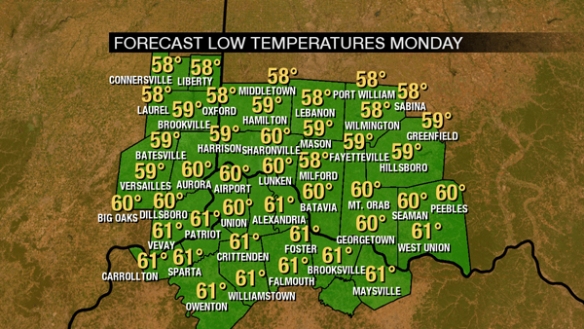
7. Don’t just be a “latest model” forecaster. When you forecast only using the “latest models,” you’re forecasting more of the noise and less of the signal. There will be anomalies, there will be large model shifts, and there will be situations – especially when a system comes ashore and is finally sampled by a weather balloon – when the forecast needs to be changed. Realistically, though, changing a low or high temperature by a degree gives your customer no additional value in most situations. What is the difference between 61° and 62°? Absolutely nothing. 31° versus 32° is a different story, however. Even with this acknowledged, though, remember the previous forecaster – assuming he or she reviewed the last forecast – carried over elements of the forecast before him or her.

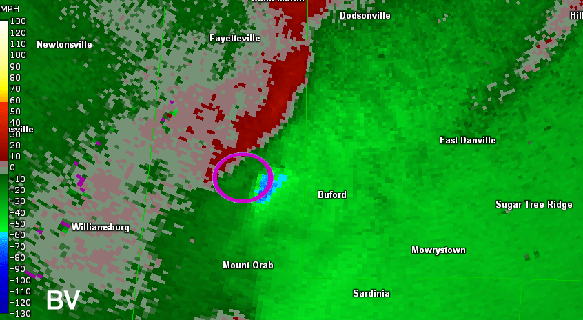
Being a “latest model” forecaster can prove costly. Here’s an example from this past Sunday using the NAM model. The latest model at the right shows a lack of clouds (tan, low relative humidity amounts) at 850mb or 5,000 feet above the ground. The model run before it had a significant amount of cloud cover (green, higher relative humidity amounts):

nov26-blog-clouds

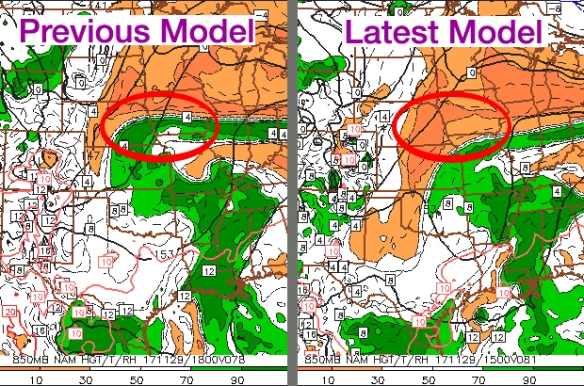
So which one is right? Of course, the real answer is a function of the previous forecast, what other models and their trends suggest, and what satellite and observed trends suggest (if anything at all). Blindly following the latest model here means you’ll likely remove and decrease clouds from the forecast. If this “latest run” isn’t a true trend, the next forecaster will just revert back to the cloudier solution; this will leave your customers are confused, show a lack of collaboration, and show your inability to make a reliable, accurate forecast.

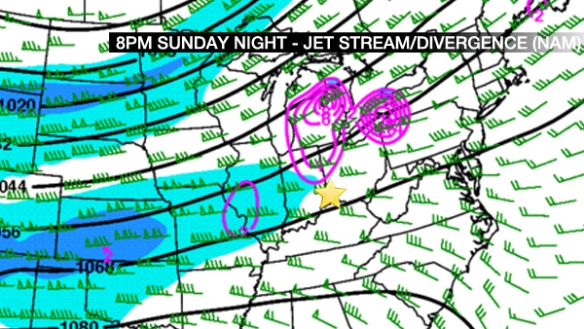
8. Don’t be a “mandatory pressure level” forecaster. Weather doesn’t just happen at 850, 700, and 500mb. When you’re first learning to forecast and getting introduced to models, you’ll see the classic 4-panel map like this.

nov26-blog-4panel

There it is: 500mb (18,000 feet) vorticity, sea-level pressure, 700mb (10,000 feet) relatively humidity, and precipitation. In reality, this is not that helpful for forecasting. How about boosting this up to 6-panels?

nov26-blog-6panel

The lower-middle panel showing 850mb relative humidity and the lower-right panel showing accumulated precipitation doesn’t really help us beyond what we had above. What if a shallow layer of clouds forms at an altitude of 3,000 feet developing in the afternoon? What if upper-level winds to the west carry a copious amount of high-level clouds to your forecast location? You’ll likely never see them if you are just focused on clouds at 700mb and 850mb.

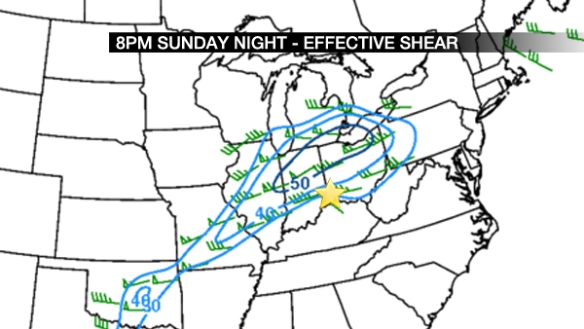
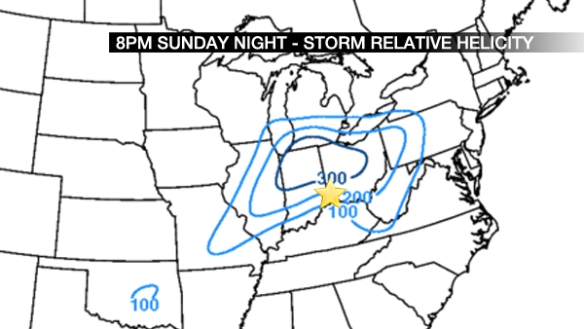
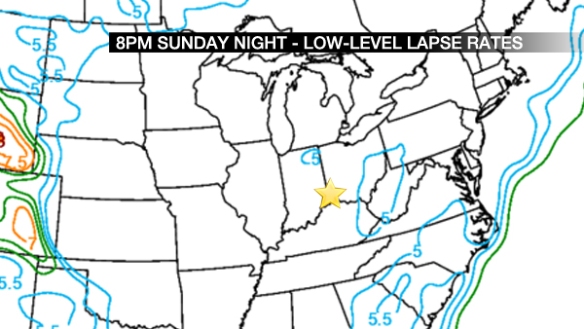
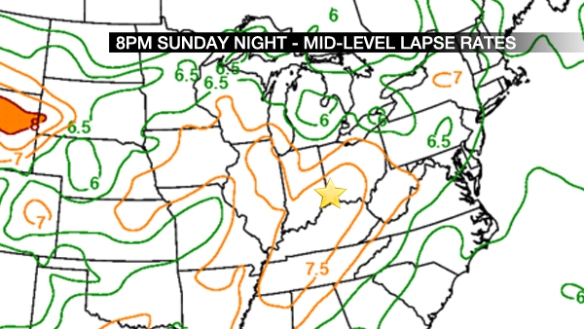
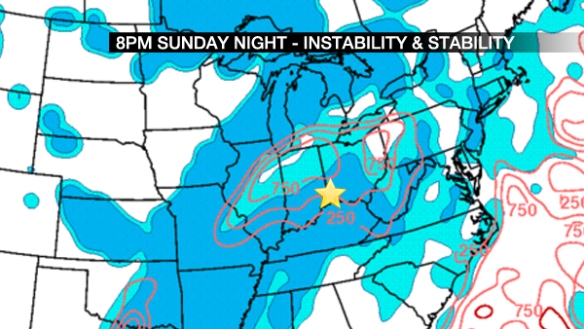
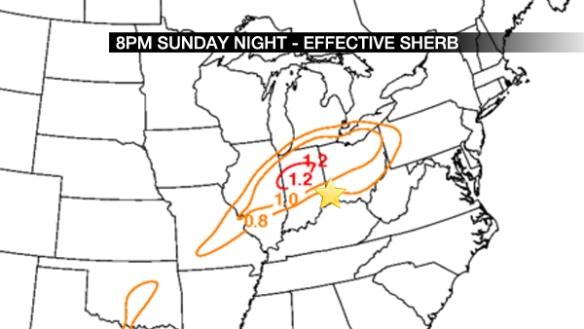
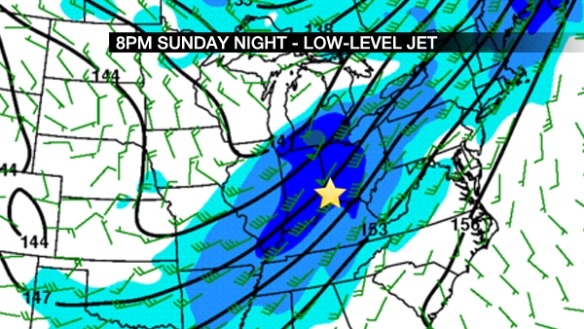
You need to know temperature and dewpoint profiles in the atmosphere. You need to know the magnitude of shear and instability to see if thunderstorms will form. You need to look at more than just the temperature at 850mb and the surface to make a snow forecast.

If you’re only focused on the main pressure levels, you’re missing most of the atmosphere. Find ways and tools that can give you a more comprehensive view of the atmosphere.

9. Stop saying – or never start saying – “um,” “uh,” “like,” “you know” and other crutch words. These words may be “conversational,” but they make you look unintelligent, unprepared, and immature in presentations. I have seen people “um” and “uh” through life-threatening weather situations, and it’s not just painful to watch; it’s suggesting the speaker can’t handle the situation and don’t take people’s safety seriously. When you present weather information, you should be able to pivot. If you speak a sentence with words in an order you didn’t intend, can you still complete the sentence? If not, I encourage you to master and refine this skill. Can you explain the same weather in more than one way? Doing this will help you avoid the killer crutch phrases. Instead of saying “uh” or “um,” just don’t say anything. There is nothing wrong with 1 or 2 seconds of silence. If you’re reading weather bulletins, make sure you know where the key information is so you are not tripping over words.

10. Don’t idolize communicators. Being the best forecaster you can be means being the best version of yourself. If you’re good at using metaphors when explaining how weather works, refine and perfect that unique craft. If you’re good at connecting current or future weather to climatology, make that your thing. If you’re good at tailoring the forecast to people’s lives and events, do that. With any forecasting job you have, there will be rules to follow and guardrails for which you’ll want to stay inside. If you’re a National Weather Service forecaster, you’ll have to make aviation forecasts to fit certain specifications. If you’re in radio, you’ll have to use company taglines and only give forecasts for certain times of the day. If you’re in television, you’ll have to cover certain types of forecasts and make relevant graphics. While you should follow the rules, you should do everything you can inside of the guardrails to make a unique, interesting, and captivating presentation that showcases your best talents and skills. If you look like every other forecaster and forecast the same way, where is your value? Do everything you can to do what you love and highlight your value add. What got someone famous isn’t necessarily what will work for you. Focus on building what you already have.

Scott Dimmich, MBA

I try to be a modest person, but today I want to share with you something for which I am tremendously proud and required months of hard work.

For the last 2 years, I’ve been very quiet about my accomplishment, but with a career transition imminent, now is the time to share my story.

nov25-blog-xu

I am a proud graduate of Xavier University’s Williams College of Business. From January 2016 through early July 2017, I began and completed a Masters in Business Administration with a concentration in Business Intelligence.

In the fall of 2015, I looked at my career options for the future. My choices were: 1) stay where I am at and hope to advance, 2) stay in broadcasting and look for advancement opportunities elsewhere, including in other cities, or 3) choose a new career path. Someone I knew suggested I consider pursuing a master’s degree – specifically an MBA – in late 2015. It took less than an hour of research to realize that I would need to take about 15 courses to complete an MBA, and if I wanted to get an MBA and both start and complete a job search in 2 years, I would have to get moving. I immediately applied to two MBA programs, and ultimately chose Xavier. I’m glad I did.

I took 2 to 4 classes (usually 3) per semester from the spring semester 2016 through the first summer session of 2017. For a year and a half, I essentially had one night each week away from classes and coursework. Most of my vacation days in 2016 were spent studying, writing papers, or in a library. Some classes – like marketing and managerial strategy – were manageable; others – like operations management, managerial accounting, and data mining/statistical analysis – were quite difficult, mathematically intensive, and time consuming.

Balancing a full time job and school was challenging, and it was even more difficult to mix in the other facets of life. After a while, I ran out of “100 percents” to give. Some people fell away as I pursued a degree that I knew would make me stronger and increase my likelihood of career options. I have a new level of respect for how difficult business decisions can be and how much impact they can have.

I didn’t have a concentration when I first started at Xavier, but a professor of mine – who I now consider a friend – saw my love for data and gathering insights from it. He encouraged me to pursue a Business Intelligence track, where I could learn everything I could about data, the systems that handle it, and the techniques used to understand it.

In the summer of 2017, I finished my last two classes and began a job search. At the end of that search, I found a job that was a perfect fit and allowed me to merge my business intelligence acumen with my work experience in communication and forecasting. This job will also enhance my quality of life and work-life balance; working regular business hours is a sharp contrast to waking up at 1am for work, working holidays, and working weekends. Lastly, there will be many opportunities to grow, advance, and learn in my new job; growing and advancing in a sustainable company and industry is important to me.

My job search confirmed the things I believed to be important to me two years ago; most importantly, I wanted to stay in Cincinnati where my friends and family are. I worked hard to come back home to Cincinnati in 2011 after years working elsewhere and at college. I’m thankful that I will be living in Cincinnati – my hometown – for the foreseeable future.

I think it is best that I not share specifically where I’ll be working. This is not for lack of pride, but – instead – in an effort to make elements of my life more anonymous. I’m not one that needs to be in the limelight to be happy. I have never been interested in being an on-air “talent” or “personality” (the terms make me cringe); I chose to be a broadcast meteorologist so I could forecast and communicate the weather. After all, it was the Blue Ash/Montgomery/Symmes Township tornado of April 9, 1999 that caused be to revisit my career path.

I make this career transition with my head held high and with a lot more self-confidence and self-worth that I had years ago. I am working in my hometown with more than 10 years of experience and as an American Meteorological Society Certified Broadcast Meteorologist. I have the honor of being recognized, interning with, and being hired directly by Cincinnati’s greatest meteorologist. I’ve worked alongside some talented people who genuinely want to make the people around them better. I’ve worked some severe weather events I will remember for the rest of my life – most notably the deadly tornado outbreak of March 2, 2012. As an MBA graduate, I see businesses differently. I appreciate the impacts of business strategy. I see the difficulty and value in creating a sustainable competitive advantage. Perhaps most importantly: I see the ethical side of decisions and know when to spot poor ethics, unfair practices, and caustic behavior.

The weather will always be a part of life. I assure you I am still very connected to meteorology and will not be abandoning it. I still love the weather, and I always will.

I am thankful for the relationships I now have as a Xavier MBA graduate and for the friends I have made in the program. I am thankful to my friends and family for being patient and supportive of me in my career transition. Having the people I love, trust, and respect standing with me means a lot. I hope my late father is proud of me.

This is not a goodbye. This is simply a fresh start, and I hope you’ll celebrate with me.

nov25-blog-xu2

When A Tornado Debris Signature (Apparently) Isn’t A Tornado


This is a mind bender. Imagine you’re nearly certain something is happening and is a threat to someone’s life…then after an additional investigation, nothing happened.

There was a rotating thunderstorm in northern Brown County Sunday night around 1am. It needed a Tornado Warning, and it got one. Shortly after the warning was issued, there was a tornado debris signature, which essentially confirmed a damaging tornado was occurring (based on radar).

I put my own credibility on the line to highlight what I saw on Facebook:

I did the same on Twitter…once to highlight the original warning:

…and the second to emphasize the radar confirmation of a tornado:

This is the “usual” shower and thunderstorm mode of radar – formally called reflectivity – during the warning:

nov6-blog-z

If you look carefully and near Buford (north of Mount Orab), you might see a hook-like feature, signaling a possible tornado. This isn’t easy to see, so let’s look at the Doppler part of Doppler radar, which will tell us how winds are moving relative to the radar:

nov6-blog-bv

In pink, I’ve circled what is called a couplet, or an area where winds are moving towards and area from the radar in close proximity. Red here means winds are moving away from the radar, and green colors means winds are going towards the radar. The environment around this storms has to be supportive of tornadoes in order for us to see this as a tornado; in this case, there was support for strong, severe, and tornadic storms. Let’s subtract out the overall motion (speed and direction) of the storm so we can see the storm relative motion. If you’re still confused, think of it like this: it’s easier to assess the rotation of a toy top on a table if it’s nearly stationary versus moving rapidly across a table. Here’s the storm relative velocity animation:

nov6-blog-srm

Again, I’ve highlighted a couplet with a pink circle. That’s strong rotation slowly weakening as it goes east.

Modern, dual-polarization radar can tell a meteorologist about the size and the shape of objects it scans, relatively speaking. If a radar scans a “bin” of the atmosphere and finds objects of varying shapes and sizes, that bin’s targets will have a low correlation. If a radar scans a “bin” of the atmosphere and finds objects of similar shapes and sizes, that bin’s targets will have a high correlation. To quantify this, we’ll turn this correlation into a correlation coefficient. Here’s the animation of this correlation coefficient just after 1am Sunday night:

nov6-blog-cc

I’ve circled a consistently low correlation area moving east. This area is basically the same area with strong rotation and a strong thunderstorm. As a meteorologist, this area low correlation coefficient within the area of a strongly rotating thunderstorm signals that a damaging tornado has occurred. The higher up in the atmosphere this low correlation coefficient goes, the more likely there is a damaging tornado and the more likely the tornado is to be strong. That low correlation coefficient area went up to about 5,200 above radar level:

cross

The actual altitude is greater when you consider the height of the radar and the curvature of the Earth.

This signature (the combination of the storm, strong rotation, and low correlation coefficient) is called a tornado debris signature. Now you see the reasoning for my Facebook post and tweets above. This is clearly a dangerous situation.

The Tornado Warning ends in about 30 minutes. The storm weakens, and order is restored.

Let’s fast forward to this morning. The National Weather Service plans to survey the area for damage. The damage is surveyed, and the NWS has a verdict:

4

What? What happened here? We had a tornado debris signature last night.

I asked a radar expert for a second opinion:

Professor Matt Kumjian of Penn State makes a good point: it’s a blurry area. A low-level circulation with leaves in it is not a tornado. Another broadcast meteorologist – Ryan Hanrahan – suggested a drone may be helpful in a damage survey. Joey Picca of the Storm Prediction Center also has some thoughts:

I don’t know how “exhaustive” the search was by the NWS, but apparently they didn’t see anything of interest. Maybe it is a false positive. But the radar in this case is like a camera witnessing a crime where police later find nothing at the scene. Or the radar shows a series of facts but the jury says not guilty.

What do you think? I think I’m frustrated.

Let’s Talk About The Severe Weather Threat Late In The Weekend

It’s November in the Tri-State, which means we are entering a secondary severe weather season. 11 tornadoes have been confirmed in the Tri-State during November since 1950. On average, 7 Severe Thunderstorm Warnings and 2 Tornado Warnings are issued in the Tri-State each November. The jet stream is getting stronger this time of the year, and the amount of instability in the air is getting lower as temperatures and dewpoints drop.

There’s a threat for severe storms late in the weekend, specifically Sunday night and early Monday, as a cold front sweeps into and through the Ohio Valley. While the Storm Prediction Center does not issue severe weather categories (marginal, slight, etc.) 4 or more days out, they have highlighted an elevated risk for severe storms in the Ohio Valley Sunday night:

nov2-blog-spc

Think of the yellow area as a “slight risk” of severe storms and the orange area as an “enhanced risk” of severe storms. Cincinnati is – more or less – in a slight risk for severe storms Sunday night and early Monday.

The environment that these storms develop and evolve in is important. It will be warm Sunday with high temperatures in the 70s:

nov2-blog-highsunday

Low temperatures Monday will be around 60°, and it appears we’ll hit our low temperature at least a couple of hours after sunrise Monday:

nov2-blog-lowmonday

Temperatures will likely fall through the 70s and 60s Sunday night. This is warm enough to support thunderstorms.

Moisture is another important ingredient for storms. Dewpoints will be in the 60s ahead of Sunday’s front:

nov2-blog-dewpoint

This is sufficient moisture for thunderstorms, including severe storms. Wind shear, the change in the direction and speed of the wind with increasing altitude, supports organized storms and the threat of severe storms. Here’s what the Thursday morning’s NAM model thinks for effective speed shear Sunday evening:

nov2-blog-effshear

Numbers over 40 (knots) here support thunderstorms and severe storms. How likely are storms to rotate? Here’s what the same run of the NAM thinks for helicity (storm relative, indicating the likelihood for storms to rotate):

nov2-blog-effheli

Number of 200 (m2/s2) here are significant, but we need other ingredients present. We need bubbles of air near the ground to rise rapidly if severe storms are to form; one way to do this is having a high low-level lapse rate, or a fast drop in the temperature going from the ground to a few thousand feet above the ground. Here’s what the NAM model thinks of that for Sunday night:

nov2-blog-lllr

Those are low values, working against the thunderstorm and severe threat. How are the mid-level lapse rates looking?

nov2-blog-mllr

These higher numbers are supportive of storms and severe storms if bubbles of air close to the ground are able to get higher up in the atmosphere. 

How about instability and layers of stable air aloft? Here’s what the NAM model thinks:

nov2-blog-cape

The warm colors are instability, and the blue colors are stability. If severe storms are to form we want a lot of the former and less of the latter. Instability is modest, and stability is generous here. This works against the likelihood of storms and severe storms, but these ingredients are less important in the colder months of the year and more important in the warmer months of the year. 

For lower-instability, higher-shear scenarios, I review what is called the SHERB parameter. As I discussed back in 2015:

While instability can often have a big influence on the chance for thunderstorms, it isn’t as important this time of the year. If thunderstorms are likely […], the SHERB parameter or index can be very helpful to a meteorologist in the colder months when looking a threat for severe weather. The SHERB parameter is helpful for getting a handle on a severe weather threat in the colder months because it focuses on temperature changes near the ground, lift in the atmosphere, and wind shear instead of instability (instability tends to be low in the winter even when we get severe weather).

Why is SHERB important? Unlike summer severe weather events which are driven by high instability and less of everything else, cold season events are driven by everything else and not often by instability. SHERB is a special blend of “everything else” that is important when gauging a severe weather threat…which makes it valuable when we don’t have summer-like heat and humidity. When SHERB values are high and the chance for rain and storms is high, severe weather is often a concern.

So what does the NAM model think of SHERB Sunday evening?

nov2-blog-effsherb

I’m looking for values of 1 or higher, which are focused northwest of Cincinnati. The 0.5- 1.0 values west of Cincinnati at this will likely drop slowly and translate east later Sunday night.

Wind speeds 5,000 feet or so above the ground are important, too; heavy rain can drag these winds aloft down to the ground. What does the NAM model think of these wind speeds?

nov2-blog-llj

These are significant, but not off the charts. If you’re of the math variety, these values are about 2-3 standard deviations above normal. This is enough wind to support storms and severe storms.

The positioning and strength of the jet stream is very important in the colder months of the year. Where does the NAM have the jet stream Sunday evening?

nov2-blog-jetnam

This is not ideal for thunderstorms and severe storms. The highest wind speeds are to the west (but still moving east) at 8pm Sunday night. Divergence (rising air) is in purple and positioned west and north if Cincinnati. What does Thursday’s morning’s GFS model say?

nov2-blog-jetgfs

It has a lot more lift Sunday evening, and it has it stronger compared to the NAM model as it progresses east. There are clearly some strength and timing differences to resolve.

In summary, here’s what I’m thinking for Sunday night and early Monday:

nov2-blog-severeimpact

This is still a wishy-washy threat at this point. We have good mid-level cooling, plenty of wind shear, and sufficient lift…but the lift timing and positioning are uncertain, instability and stability forecasts work against the storm threat, and we’ll need sunshine (even if filtered) to get the storm threat maximized.

There is plenty of time for conditions to change. Stay tuned!