Notice: Function wp_enqueue_script was called incorrectly. Scripts and styles should not be registered or enqueued until the wp_enqueue_scripts, admin_enqueue_scripts, or login_enqueue_scripts hooks. This notice was triggered by the nfd_wpnavbar_setting handle. Please see Debugging in WordPress for more information. (This message was added in version 3.3.0.) in /home1/scottich/public_html/wp-includes/functions.php on line 6078
February 2021 - Meteorologist Scott DimmichMeteorologist Scott Dimmich
If you’re thinking 2021 has been very cloudy, you’re right. Including today (which is likely to change with late day sun, but we’ll use data through 4pm today), today was the 10th completely cloudy day in Cincinnati:
We’ve not only had 10 days with 100% cloud cover in February; we also had 15 days with no sunshine in January:
This means we’ve had 25 days so far in 2021 with no sunshine:
That also means 47% of all days so far this year have been cloudy, and 88% of all days so far this year have had more clouds than sun. Is this unusual? It is. Through this date in 2020, we only had 20 completely cloudy days, but 86% of all days through February 22nd had 50% or more cloud cover:
2019 had a similar start through this point in the year; there were 21 days with no sun, and all but 5 days had clouds winning out:
2018 YTD had fewer 100% cloudy days, but only 9 out of 53 days had less than 50% cloud cover:
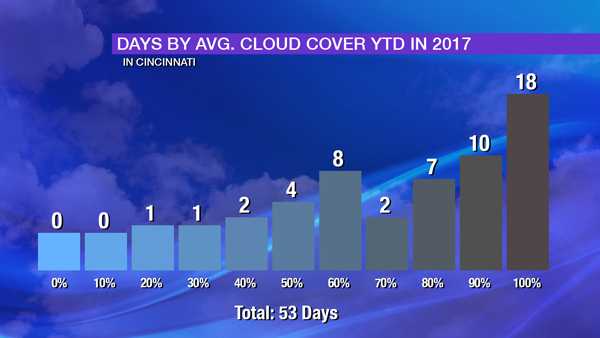
Compared to 2018, 2017 year-to-date had fewer days with more sun than clouds:
2016 had a more even distribution of days by average cloud cover and fewer overcast days:
Recent history would suggest that it’s not unusual to have more clouds than sun in February, but 2021 so far has been among one of the cloudiest. The average daily cloud cover for Cincinnati month-to-date is about 80%, and only one February – 2018 – has been cloudier:
…and the year so far is also quite cloudy compared to other recent years. Only 2019 – with 57% of all days through this point in the year having 90%+ cloud cover – beats 2021:
A big reason why it has been so cloudy recently is the amount of snowfalls. Despite being about 1/2″ behind average for total precipitation in February so far, nearly 22″ of snow has accumulated so far this month in Cincinnati…and when it snows like that, it will be cloudy:
The only next few days will be slightly brighter than the month so far, but a mix of sun and clouds is about as soon as it gets through the middle of next week.
Just before 6pm on Monday, February 15th, I posted these words on social media: “Trolls and haters…this is your time to shine, and bring your worst.”
And they came.
Nice modelcast. Must be nice being paid to report what garbage models say. Try forecasting Not reading models. Sunday this scenario became apparent with a layer above freezing at 850mb
yep, total bust. but then again, it isn't my profession. biggest issue I see is the hype for marketing purposes. No one wants to say "we really only blend models and with these storms we really don't know what will happen because the result is within our margin of error."
There is no denying my forecasts for snow in the days leading up to the event were very different than reality. And just so we’re clear, here’s what I had forecast last night:
This is a large amount of snow for the Cincinnati area. But note that I have lower totals to the east where I felt sleet and freezing rain would be mixing in. Models become increasingly more aggressive with the presence of sleet – at the expense of snow – by midday Monday, and my forecast had changed:
By this point, sleet was falling, and I had accounted for the sleet and freezing rain rain accumulations…but I hadn’t cut snow totals significantly yet. But what was with the sudden change?
Over the last few days, it has been very clear that we would have moisture moving into the Ohio Valley on Monday. Here’s a total precipitation (all precipitation types melted down to liquid) forecast through Monday from the NAM model run early Sunday:
So we we’ll have precipitation Monday, but how much of this is going to be snow versus sleet versus freezing rain? That depends on the temperature. In meteorology, you multiply the liquid-equivalent amount by a factor to create a “snow-to-liquid” ratio. A temperature near freezing would align with a snow-to-liquid ratio of 10:1, but temperatures in the low 20s would support a ratio of 12:1-17:1. And remember, some of that liquid-equivalent could be rain, freezing rain, or sleet…or a mix of all of those. Let’s assume the 0.66″ is right and all snow, though. Here’s the snow-to-liquid ratio math for 0.66″:
If this 0.66″ is right, a forecast of 6 to 12″ is appropriate, but you want to be as specific as possible. 8-12″? 6-9″? But what if this 0.66″ isn’t right? What if it’s 0.40″ of total precipitation? Here’s the math on that:
That’s a lot less snow. If the models went from 0.66″ to 0.4″ (a drop in 0.24″) of precipitation, your snow totals are probably going to go down by at least a couple of inches. In reality, 0.2″ of liquid-equivalent fell at the Cincinnati/Northern Kentucky International Airport between 1pm and 8pm Monday! Many models – so far – are not close with this total.
Let’s revisit the temperature issue, including in the vertical. Here’s what the same model (Sunday’s 7am NAM model) is showing for the vertical temperature profile for 10am Monday morning:
This a complex graphic, but know that altitude increases moving to bottom to top in the graphic, and the red line is the temperature. The red line is left of the 32° line, and this mean the temperature is below freezing (and at least by several degrees) over a large depth of the atmosphere. This suggests we will see snow and avoid freezing rain, sleet, and rain.
Fast forward the clock to 7am Monday morning. Here’s the actual/observed temperature profile from Wilmington, Ohio:
The surface temperature is close to what is shown above, but note the temperature line (red) is closer to the freezing line (blue) compared to what is shown above. The temperature, though, is still below freezing, so snow is still the focus.
Let’s fast forward the clock to 3pm Monday. This is same model (NAM) but only looking 9 hours into the future from when the model was ran. It has a temperature near 32° just a few thousand feet above Cincinnati. This layer of air is warming.
Suddenly, our forecast for snow is not looking as good. Remember, this is a modeled temperature profile. Weather balloons only get launched early in the morning and early in the evening. Monday evening’s weather balloon launch from Wilmington, Ohio shows even warmer air aloft:
Courtesy: NWS Wilmington
Uh, oh. The temperature is a few degrees above freezing 6,000′ above the ground. This means snowflakes well above the ground are falling into this warm layer, melting, and then refreezing as they fall several thousand feet toward the ground. This is also known as sleet. Of the total precipitation that falls, more of it is falling as sleet (and less as snow) when this happens. This is a key reason many didn’t get slammed with snow. Many models were too wet with this system, and many did not capture the warm air invasion/advection aloft.
You may say: “Well, Scott, aren’t you a meteorologist? Isn’t it your responsibility to see this?” And to that I say…with what? How do I know what the temperature is at 7,000′ above the ground at every hour of the day? As I said above, weather balloons are launched twice a day in Wilmington, and the morning weather balloon was suggesting snow. How about data from an airplane? That data does exist, but it’s expensive and not publicly available. Plus…an airplane has to sample that air. So how would I know about this temperature change aloft as a forecaster? I must – in part – follow model guidance to see this. I can review guidance and compare it to reality (surface reports, satellite, radar)…but to a point. I can’t see, sample, or collect everything. And today, the things I couldn’t see….temperatures a few thousand feet above the ground and how much precipitation would fall…were not something I could understand without modeling.
The impacts of this system were good (roads were terrible, visibilities were reduced, accidents happened), but the precipitation type and amounts were off. And now you know why it’s not as easy as it looks.