Understanding The Difference Between Dewpoint And Relative Humidity

The dewpoint is not the relative humidity. The relative humidity is not the dewpoint. Unless you are a meteorologist, you could go your entire life without knowing the relative humidity again. Meteorologists use relative humidity for forecasting clouds and for specific fire weather purposes…and that’s about it. If you only follow one of these two variables, choose dewpoint.

The dewpoint is an absolute measure of how much moisture there is in the air. The higher the dewpoint is, the more humid it is. When the air temperature cools to the dewpoint, the air comes saturated. Any dewpoint above 60° suggests it is humid outside; a dewpoint of 70° or higher means humidity is oppressive.

The relative humidity is different than the dewpoint. The relative humidity describes the relationship between the temperature and the dewpoint. More specificially, the relative humidity is the amount of atmospheric moisture present relative to the amount that would be present if the air were saturated. If the temperature is close to the dewpoint, the relative humidity will be high; if the temperature is far away from the dewpoint, the relative humidity will be low.

The relative humidity does not describe how humid the air is; the dewpoint does. The relative humidity can be 100% in the winter when the air is far from humid. Likewise, the relative humidity can be below 50% when it is very humid outside.

Let’s look at the relationship between the temperature and dewpoint and how it affects relative humidity. If the temperature and dewpoint are equal to each other, the relative humidity is 100%. For example, if the temperature is 65° and the dewpoint is 65°, the relative humidity is 100%:

aug12-65t65td

If the temperature is 30° and the dewpoint is 30°, the relative humidity is still 100%:

aug12-30t30td

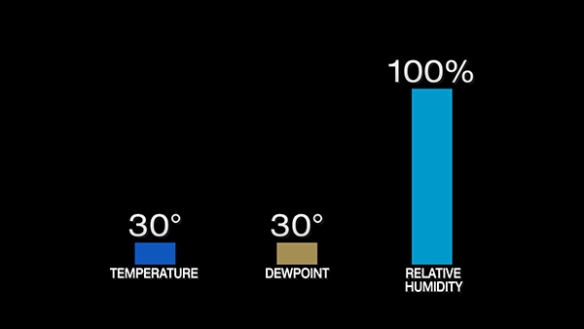
Regardless of what the temperature and the dewpoint are, if the two are equal, the relative humidity is 100%. The relative humidity can be 100% on a humid summer morning or on a very cold winter day.

Let’s go back to the first scenario. Suppose the temperature rose from 65° to 80° on a summer day, but the dewpoint remained at 65°. Because the difference between the temperature and dewpoint increased, we expect the relative humidity to decrease. In fact, it dropped to 60%:

aug12-80t65td

Did the air become less humid? The answer is no. The dewpoint did not change, but the relative humidity dropped significantly; because the dewpoint is over 65°, however, it is humid. In fact, you didn’t even need to know the relative humidity to know whether the air became less humid or not; you just needed to know if the dewpoint rose or fell.

Suppose later that day the temperature kept rising, the dewpoint didn’t change, and the relative humidity fell:

aug12-90t65td

Did the air become more humid or less humid? The answer is neither. The dewpoint did not change, so the air is not more or less humid.

As an aside, the air may feel more humid when the temperatures rose through the day (even when the dewpoint did not). This apparent temperature – called the heat index – rose because the temperature increased. The heat index is only calculated between the temperature is greater than 80° and the dewpoint is greater than 54°.

Let’s make another change. Suppose the temperature did not rise again, but the dewpoint and the relative humidity both increased:

aug12-90t70td

Did the air become more or less humid? The dewpoint rose, so the air became more humid. The relatively humidity rose only in response to the dewpoint rising; because the difference between the temperature and dewpoint went down, the relative humidity increased.

It’s time for one more change. Suppose the temperature of the air remained the same, but the dewpoint and relative humidity dropped:

aug12-90t50td

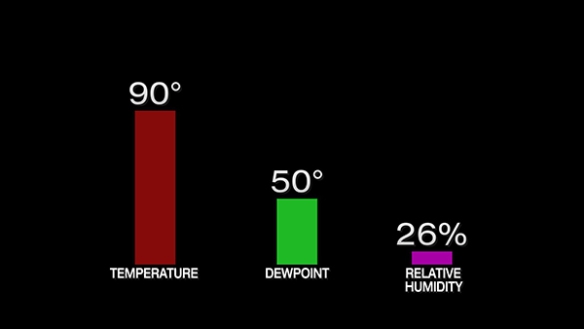
The air became far less humid because the dewpoint dropped 20°! The relative humidity dropped only because the difference between the temperature and the dewpoint increased.

In summary, the dewpoint is an absolute measure of how much moisture there is in the air. The relative humidity does not tell you how humid the air is; the dewpoint does. The relative humidity describes the relationship between the temperature and dewpoint. The relative humidity can drop and fall rapidly through the day even if the dewpoint remains the same. Despite “humidity” in its name, relative humidity is not a good judge of humidity as you feel it; it is a measure how far apart the temperature and dewpoint are.

Don’t fall into the relative humidity trap! Relative humidity almost always rises and falls more quickly than the dewpoint. Stick with the dewpoint; it is your absolute guide to absolute humidity!

More Storms Than Usual This Month, Summer, And Year?

Many in the Tri-State feel that this has been an abnormally stormy month, summer, or year. Perhaps it is the intensity of the rain, the frequency of the storms, or the lack of days with abundant sunshine that have people thinking there have been more storms than usual this year.

I keep a database of Severe Thunderstorm, Tornado, and Flash Flood Warnings for the area. The records go back to when the National Weather Service Forecast Office in Wilmington, Ohio first began issuing warnings in 1995. While we are not halfway through the month of August, the Tri-State Tornado and Flash Flood Warnings counts (from January 1st to August 31st) are below the averages and records for the same time period. The Severe Thunderstorm Warning count is above average:

aug10-warnings

These numbers suggest this has been a stormy year in some ways, but not in all. Many forget how stormy 2011 was. 2011 was also the wettest year on record in Cincinnati (with yearly records dating back to 1871).

Many have said that this August has been abnormally stormy. One way to measure this is by comparing the August Severe Thunderstorm Warning count from one August to others:

aug10-augsvrs

On average, there 12 Severe Thunderstorm Warnings are issued in the Tri-State each August; so far in 2015, 17 have been issued. By this measure, it has been a stormy August, but more warnings were issued in 2007 and 2010. It is worth noting that August 2015 has not yet ended, so that count is not final.

Has this been an abnormally stormy summer? If you compare the Tri-State Severe Thunderstorm Warning count from June 1st to August 31st, there have only been 3 years since 2007 with more warnings:

aug10-summer

On average, 59 Severe Thunderstorm Warnings are issued in the Tri-State each summer (June, July, and August combined). While we are ahead of the average, we are unlikely to break the summer record of 103 warnings set in 2008.

For all intents and purposes, 2013 and 2014 were somewhat quiet severe weather years. No tornadoes were confirmed in the Tri-State during 2013, and 5 were confirmed in Tri-State during 2014. For perspective, the yearly average (1950-2014) is roughly 3 tornadoes. Flash Flood and Tornado Warning counts were below the 1995-2014 average in both 2013 and 2014. The Tornado Warning count was below average in 2013. If you remember the last couple of years, 2015 is a stormy year. Calling 2015 “stormy” compared to 2011 or 2012 is a much harder case. There were 16 confirmed tornadoes in the Tri-State during 2012.

I’ve found that when people compare seasons, they often compare it to last year or the previous season. 2011 and 2012 were stormy years and – in many ways – stormier than 2015.

There are also dozens of ways to measure how stormy a period of time is. 2015 has been a stormy year for Brown County, where three flash flood fatalities occurred earlier this year. Those are the first storm-related deaths in Brown County since March 2, 2012. Where you live, what you see, or what you doing see influences your memory of storms.

A Sycamore Story: Putting A Weather Station On The Roof

Since I returned back home to Cincinnati in late 2011, I’ve been connected with Sycamore Community Schools in a lot of ways: through teachers, through friends, and by getting involved in district activities. Sycamore is a district with award-winning education, and Sycamore is working on some new initiatives to make sure students are better prepared for the workforce.

Before a weather station and camera network was created at Local 12, I spoke at a STEM (science, technology, engineering, and mathematics) meeting with Sycamore staff in 2012. I discussed the value of having a weather station at a school. First, the data collected by the weather station can be used in the classroom to teach math, science, technology, and computer programming. The data can also be shared with the National Weather Service and media to show current weather conditions; these data are especially important during active and severe weather.

Sycamore recent initiatives opened up an opportunity to put a weather station at Sycamore High School. With the backing of the district, the weather station arrived at the high school last week, and the installation began on Wednesday:

aug7-weatherstation

Mr. Chad Husting, a science teacher at the high school, Ashwin Corattiyil, the Dean of Students at the high school, and I set up the weather station on Wednesday. Mr. Husting was nothing short of MacGyver connecting the pieces together. He even came in Friday to secure the station’s pole and tripod!

The weather station is away from wind blocks and obstructions and also away from where animals and people can influence the measurements with it:

aug7-roofshot1

The wind speed and direction are measured at the top of the weather station, and rainfall and temperature measurement are taken in the black and white-colored units, respectively.

It is important that the station is positioned away from walls, buildings, and trees that can block the wind. That makes the roof a great spot!

aug7-roofshot3

Note the cinder blocks holding the weather station down. Derrick Richardson (assistant principal), Ms. Haverkos (high school science teacher), two custodians, Ashwin, and I put those there to make sure the station was secure (they did most of the work)!

aug7-weatherstation2

The weather station has a wireless connection to a console in the building. From the console, the data are uploaded to the Internet and to various sources:

aug7-wxstationconsole

While at the school, students will be able to see the data on the console, but the data will also flow to several places online, including:

http://www.weatherlink.com/user/sycamorehs
http://www.wunderground.com/personal-weather-station/dashboard?ID=KOHCINCI139
http://mesowest.utah.edu/cgi-bin/droman/meso_base_dyn.cgi?stn=E7726 (coming by mid-August)

This is an exciting time for Sycamore not just because I see a weather station on the roof but because students, staff, and the community benefit from having that data. Science teachers at Sycamore High School, including the ones listed above, seem to be very excited about this new teaching tool, and I’m hopeful that the success of this weather station is so big that it spreads to other schools throughout the district.

Ironically, Sycamore High School is across the street from a neighborhood heavily damaged by an F4 tornado back on April 9, 1999. Those who have lived in Blue Ash, Montgomery, and Symmes Township for years know that a simple weather station is more than just education; it’s safety.

All I Really Need To Know I Learned From My High School Physics Teacher

Meet Mr. G. Some call him Mr. Gutekunst. Some (not me) call him Mike.

aug2-mrg

Regardless of what you call him, he was my physics teacher junior year of high school. I have seen him twice since I graduated. One of the best luxuries of working in your hometown – especially as a public figure – is that you can connect with people from your past fairly easily. The picture above shows we have both managed to keep our youthful look after many, many years.

I learned a lot from Mr. G. He basically set a foundation of science that I use daily as a meteorologist. Sure, all sciences – biology, chemistry, and others – are connected to meteorology, but physics is one of the most important.

While a love for science can connect two people, I remember Mr. G most for what he taught me about life. It is cliché, but what he taught on the last day of class was revolutionary and an appropriate foreshadowing for the reality of life.

I had lunch with Mr. G this past Thursday. We spent over two hours discussing our lives. We discussed everything from our families to our journey.

This blog post is not about a lunch reunion that many of us frequently have. I recognize many of us catch up with friends and colleagues, and that this meeting over lunch doesn’t seem unique.

I share this lunch meeting story because Mr. G discussed a message about life from which we could all learn.

When I was a junior in high school, Mr. G shared the “Mr. G Story” on our last day of class. With me being in his first ever class, he was in his early 20s giving his students – just a few years younger – some valuable lessons on life. Being a Purdue University physics and engineering major, a lot of his story was about keeping the pace going, fighting the urge to stop, and finding time to enjoy what makes you happy.

Part of our lunch conversation on Thursday was about the gist of the Mr. G Story, which had become grayer and fuzzier in my mind with time. I asked Mr. G to share the gist with me, and he deferred answering my question until he could look at his notes. He told me his story had changed some over time, but the overall principles were still the same. The gist of the Mr. G Story is to answer key questions about your life, and – yes – you must answer them:

1) What do you enjoy doing most?  When are you most satisfied in your life?

2) What are your best attributes, according to you?

3) How did you get to this point in your life?  Do you like where you’re going?

4) What do you want your life to stand for?  What do you want your name to mean?

5) If money was no object, what would you do with your life?

6) What will constitute you being a success in your life?  How will you know when you’ve succeeded?

7) Will your intended career path pay you a salary that lets you live the lifestyle you prefer? (put simply – will you make enough money to be happy?)

These seem like simple questions, but if you revisit them a time or two, you realize they aren’t as simple as they seem. Even if one of these questions seems simple, the next one may not be so simple. Some of these questions make you question what you are doing with the limited number of days you have on Earth.

Some could look at me, a meteorologist working at a great station in my hometown, and say I was successful. There are, however, so many things in my life that are incomplete or could use a change. I know I’ve made my mother proud, and I believe my late father would be proud of what I have done with my life. Both of them either say or would say my life is not about them though; it’s about me being in charge of my own life.

Question 6 hits me the hardest. How do you know when you are a success? What do you do once you’ve achieved success? What’s next?

I hope these questions have meaning to you, and I hope you revisit some of them before you close this webpage, end your day, or end your week. The answers to these questions can take a lifetime. If a man inspired me to contact him and have lunch years after I left his classroom, the questions he poses to all his students can be asked of all of us.

Ask yourself the tough questions. I’ve already printed the questions above and placed them over my desk at home. When a tough decision comes, I’ll be asking myself these questions until I know the answers.