
Everyone knows the word moisture. It is a fundamental ingredient for making precipitation or even keeping it away. It is the reason why it was humid today; the more moisture there is in the air (the higher the dewpoint), the more humid it is. The dewpoint is critical for knowing whether clouds will form or whether they will break apart. The dewpoint has either a direct or indirect impact on the strength, positioning, and timing of all weather systems. The dewpoint (a temperature) can impact the air temperature and what type of precipitation falls at the ground and aloft.
For some reason, though, the dewpoint is not listed in official weather records (kept by the National Weather Service in the United States). When you look at weather records for the month of July 2016 in Cincinnati (so far), the maximum, minimum, or average dewpoint is nowhere to be found:
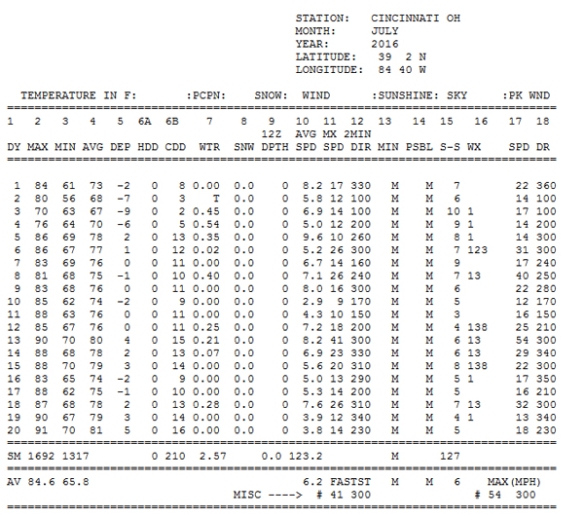
Records of air temperatures, precipitation, snowfall, wind speeds, and even snow depth are kept every single day. Yet the dewpoint is not here. Why?
The dewpoint is so important that is it listed not once, but twice in airport weather observations:
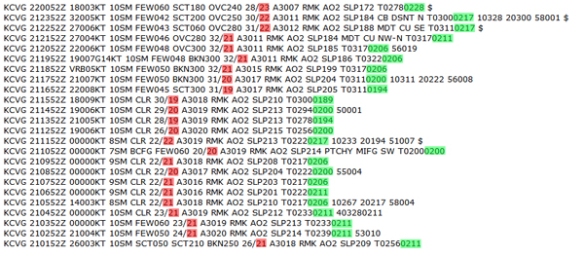
The red number is the dewpoint to the nearest whole number (°C), and the green number is the dewpoint (°C) in tenths (and the first “0” or 1″ here is used to indicated whether the dewpoint is positive or negative, respectively). It’s important enough to go here, but not in official weather records?
The dewpoint is so important it is measured vertically using a weather balloon (to the top of the troposphere, the layer of the atmosphere that we live in and where weather occurs) twice a day at numerous sites around the country and the world. Here’s the weather balloon “sounding” from 8pm Thursday night from Wilmington, Ohio:
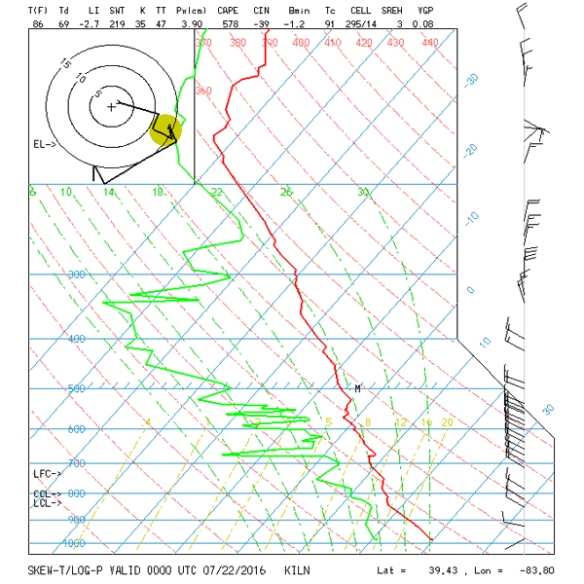
Guess what the green line is? It’s the dewpoint! It’s right next to the temperature in red! Wind directions and speeds (listed as barbs on the far right) are also listed. And that’s it for a weather balloon sampling! Every other variable is derived. If the dewpoint makes the variable list here, it should be in official weather records
You want to know what the record lowest or highest dewpoint was at a pressure of 850 millibars (about 5,000 feet above the ground) back to the early days of when weather balloons were launched? Here you go! It’s all here! Want to know how the average dewpoint this month compared to last month or last July? It’s not easy; even the most data savvy meteorologists will need time to make this calculation.
Keep in mind, temperature ranks for a week, month, year, decade, or ANY stretch of time are done by averaging the average temperatures for each day in that period. The average temperature for the day is simply the high and the low divided by 2. I can calculate the average temperature for a year or month and compare it to a similar length of time easily because high, low, and average temperatures are listed in official weather records. High, low, and average dewpoints are not. Comparing the average dewpoint for one year to another can take hours. It should take minutes.
Part of the argument is that dewpoint records don’t go as far back as temperature records. Hourly dewpoint records for Cincinnati go back to the late 1930s, but temperature, rainfall, and snowfall records go back to 1870, 1870, and 1893 (officially and respectively). So it’s not the same period of record…but so? Records are records. The first half of 1872’s temperature records in Cincinnati are gone; they were lost in a fire. We didn’t throw out the entire record on account of some records being lost. Jackson, Kentucky’s weather records (at the National Weather Service office there) began in 1981, some 100 years after Cincinnati’s records began. Still, we aren’t throwing out weather records from Jackson because their period of record is less than 40 years.
It’s time to add the maximum, minimum, and average dewpoint to official climate records for the United States. Moisture in the air is fundamental to understanding what type of weather occurs and how poor conditions will be. The public, not just meteorologists, should have knowledge of how weather conditions are changing so that we can see how moisture is moving over time and space. With a large enough period of record in place, dewpoint records will add to the ongoing discussion about climate change and give all a better indication of whether certain areas are more humid or less humid over time.