Data is the food of a meteorologist. Dozens of weather balloons are launched each day in this country and across the world. Satellites and radars can scan the globe and the sky on the order of seconds. High-resolution models can provide forecast data in 15 to 30 minute intervals. The best forecasts – especially in active weather patterns – require an understanding of this data; unfortunately, trying to get a handle on all of this data is a lot like drinking from a fire hose.
Despite the latest advances in technology, nothing beats confirmation of knowing what the weather is like (or not like) in a certain area. Radar may suggest a strong storm is moving through a town, but are the winds really as bad as radar indicates? Is it really raining that hard, or is most of the rain evaporating before it reaches the ground? There are only a few ways to know for sure: see it firsthand, get a spotter report, see it on a live camera, or get a weather station report. Meteorologists and spotters can’t be everywhere, and live camera networks are expensive. For these reasons, meteorologists often rely on weather stations across the country to gauge the strength of storms, verify computer model accuracy, and understand weather differences at a city or county level.
Airport weather stations are often most accurate, since they are used for aviation safety and the FAA and National Weather Service help to fund this equipment. However, few people live near airports and extreme or severe weather often happens away from airports. Thankfully, there are thousands of other weather stations in this country that meteorologists can access; most of them are owned by everyday weather enthusiasts.
Outside of major airports, most of the weather data that television meteorologists show on-air comes from NOAA’s MADIS (Meteorological Assimilation Data Ingest System) data stream. Personal weather stations are fed into MADIS through the CWOP (Citizen Weather Observer Program) data stream. Without the MADIS and CWOP data streams, localized temperature differences would be hard to see, especially in real-time.
Background
When I was working for WEHT-TV in Henderson, Kentucky a couple of years ago, I wrote code to bring MADIS data into our on-air system (even before our weather graphics vendor supported it). Localized weather data was important there, and it is important everywhere. Upon moving back to Cincinnati to take a job with WKRC-TV, I took it upon myself to get localized data into our weather graphics system. Here is what WKRC-TV’s temperature map looked like in early November 2011:
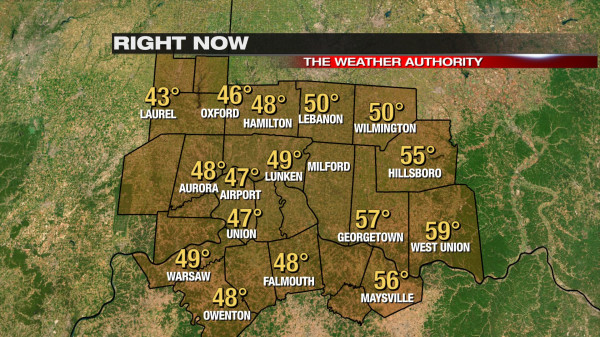
At the time, there were only five personal weather stations on the map (Warsaw, Aurora, Union, Milford and Laurel); all of the other stations were weather stations at airports, owned by the Ohio Department of Transportation, owned by the Kentucky Transportation Cabinet, or were a part of the Kentucky Mesonet. As time permitted, I slowly added new weather stations to the map and shifted things around, but there were still communities left off the map. As a television meteorologist who wants to include viewers from every city and county in the viewing area, what could I do to make sure I could get current weather conditions from as many places as I could?
The Challenge
As a meteorologist, you quickly become familiar with websites that have computer model or weather information. While stumped with where to find other local weather station information, I realized that Weather Underground allowed people with weather stations to freely upload data to their website; in turn, Weather Underground displays these weather stations on their website – including on the WunderMap – and make money through advertising. Weather Underground doesn’t allow you to take weather station data from their website, but it does allow you to message people on the website. After sending out a bunch of messages to people who sent their data to Weather Underground but not to MADIS, I got a couple of replies. I was able to get the people that replied to my message to send their data to CWOP (and therefore MADIS) so we should show it on-air. Unfortunately, only a couple of people replied to my messages. So how could I get the attention of the people that didn’t check their Weather Underground message inbox?
After a while, I figured out a way to contact these weather station owners. On the individual weather station pages, Weather Underground provides the latitude and longitude of each weather station:

There are several websites – including at stevemorse.org – where you can take latitude and longitude coordinates and get a street address. If I had a street address, I could mail someone a generic “To Whom It May Concern” e-mail about noticing their weather station on Weather Underground, some background about CWOP and MADIS, and my contact information if they were interested in sharing their data with us. At first, I was unsure whether I should send out letters in the mail saying I found their address by finding their latitude and longitude coordinates online. Eventually, I convinced myself to sent out 20 snail mail letters, and I was impressed with the number of replies (especially from rural areas where there was only one known weather station in the county). While not everyone was reporting at the time I pulled this image, here is the temperature map you’ll see often now on WKRC-TV:

Several stations on the map – including Vevay, Seaman, Peebles, Foster, Brookville, Liberty, Batavia, and Fayetteville – were added as a result of mailing a letter to someone I didn’t know. More stations (that can’t fit on this map) were added in the Cincinnati metro and northeast of Cincinnati along I-71 as result of sending letters out.
Some may look at the map above and say, “it’s busy.” I look at the map above and say, “nearly everyone is covered or is covered more than they were before.” On clear nights, it’s easier to see temperature differences from the river valleys to the higher elevations and areas in the Cincinnati urban heat island. When a line of severe storms is sweeping through the area, it’s nice to have a wind observation from near or in the storm instead of miles away from the storm. For the man or woman that just wants a simple forecast and current conditions on the way to work, it’s nice to show people what the weather is like in their town instead of in the town one county away.
Call To Action
I wish that every broadcast meteorologist in this country would look at Weather Underground’s WunderMap for their area, see which weather stations don’t show up in the MADIS stream (which are displayed in MesoWest), and write a letter to owners of weather stations that aren’t in it. Being the first to reach out to a weather station owner almost guarantees you’ll be the first your viewing area to put that town on the map (and gain the interest of their viewers because the competition won’t know about it). In times of severe weather, you’ll be able to show temperature drops and wind gusts using weather stations the competition doesn’t know about. Television is becoming more and more about local coverage, individual communities, and subdivisions. When it comes to weather on television, highs and lows are helpful, but the hour-by-hour forecast is becoming more and more important. It’s much harder to make a forecast for a town if you don’t know what the weather is like there now.
With time, more weather stations will come online, personal weather stations will become more affordable, and weather will become more and more focused on local conditions. When it comes to the weather, the future – in many ways – is now. Real-time, local weather data is important, and being on the leading edge of this change is the place to be.
My step-dad has one of those weather stations. I’m checking them out now. Might as well upgrade. My indoor/outdoor stations outdoor transmitter quit on me.