Strong and severe storms on Friday have been a threat in the Ohio Valley since Sunday. That threat is still there, and the Storm Prediction Center has highlighted much of the Ohio Valley and lower Great Lakes in their latest severe weather outlook, which was released before sunrise Tuesday:
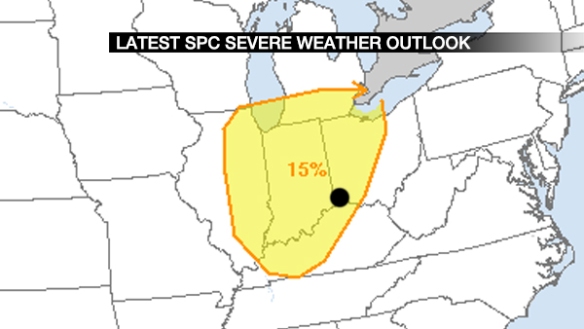
What does 15% mean? It shows the risk of a severe weather report within 25 miles of point. 15% is the equivalent of a slight risk. The Tri-State is in this risk.
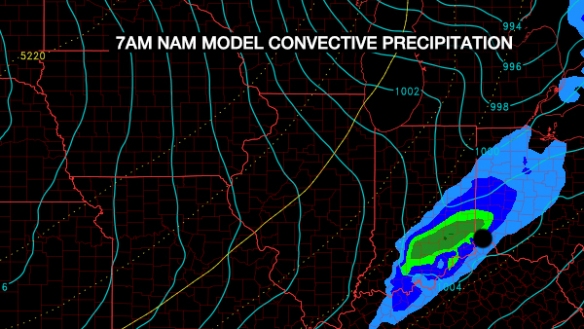
What time am I expecting storms? It depends on which model you believe. Here’s how much thunderstorm-related precipitation Tuesday morning’s NAM model (I’ll just call it NAM from now on) is predicting between 7am and 1pm Friday:
But Tuesday morning’s GFS model (I’ll just call it GFS from now on) is predicting little if any thunderstorm-related precipitation in the Tri-State from 7am to 1pm Friday:
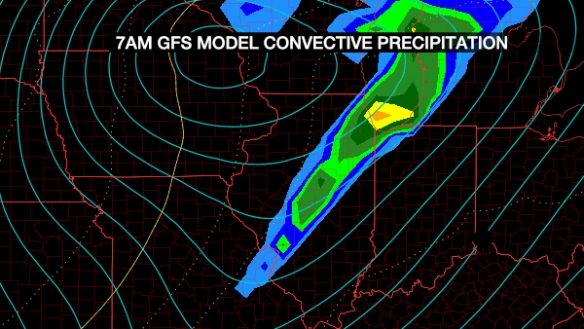
Notice the GFS develops the line of rain and storms to the west of the Tri-State Friday morning and early Friday afternoon. It actually has it over the Tri-State Friday evening, between approximately 9pm Friday and 2am Saturday.
Clearly, there are timing differences that need to be worked out. For now, let’s not worry about the timing. Instead, let’s focus on the environment at 1pm Friday for all of the graphics below based on Tuesday morning’s NAM and GFS. Cincinnati is the black dot in all of the graphics below.
Where will the upper-level disturbances be? Remember: when it comes to Friday storms, the NAM is the faster model, and the GFS delays the onset of storms until the evening. Here’s where the disturbances will Friday afternoon per the NAM:
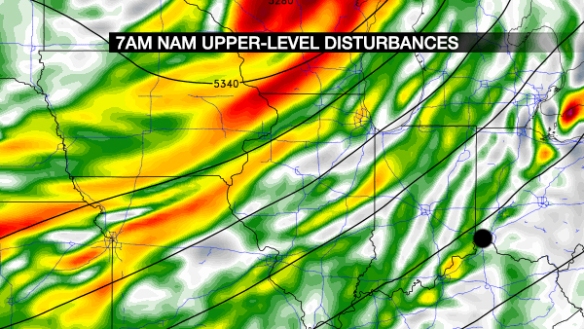
The best lift in the atmosphere is on the nose of these disturbances (green, yellow, and red) moving east and northeast. The NAM shows small disturbances over the Ohio Valley (triggering storms) with a bigger disturbance over Wisconsin.
What does the GFS think?
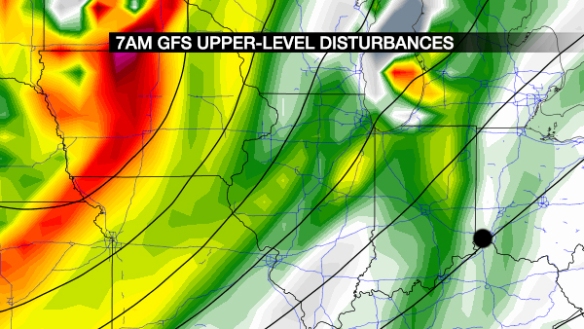
It has a similar idea to the NAM over the Ohio Valley, but it has the large disturbance to the west farther south larger (deeper red).
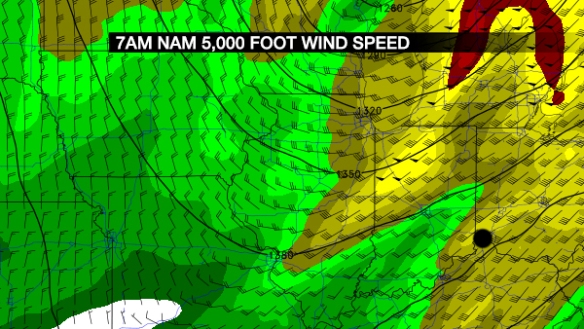
Wind fields differ for the NAM and GFS models. The NAM has a strong wind (45-60mph) 5,000 feet over the Ohio Valley Friday afternoon:
…but the GFS suggests a stronger wind field:

The red colors are severe wind speeds 5,000 feet above the ground, not at the surface. These strong speeds, however, can be brought down to the ground in heavy rain or strong downdrafts.
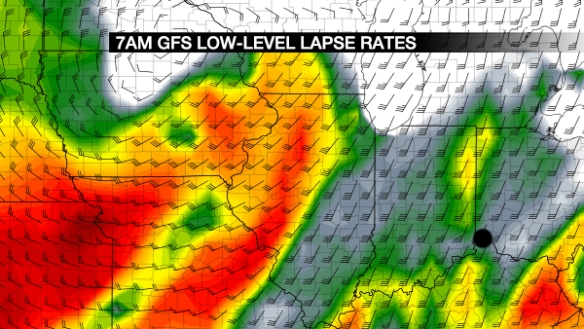
A lapse rate is the rate at which temperature decreasing with increasing altitude. High low- and mid-level lapse rates support storms, including strong and severe storms if values are very high. Here are the low-level lapse rates for Friday afternoon from the NAM:
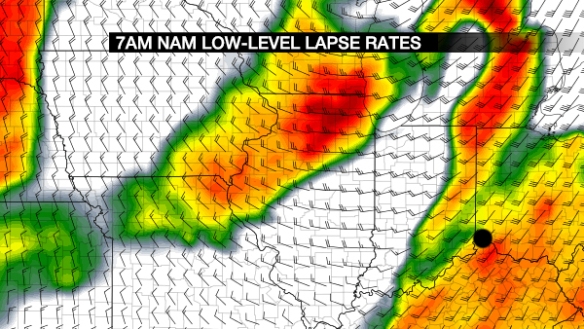
These are high values. Does the GFS agree?
No, it does not. It strengthens lapse rates slightly late Friday but not to the levels of the NAM at 1pm Friday. How about the mid-level lapse rates? We want those high, too, if we’re getting severe storms. Here’s what the NAM thinks:
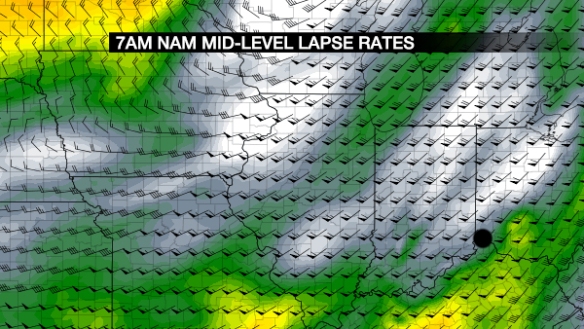
This are okay, but not high. What does the GFS think?
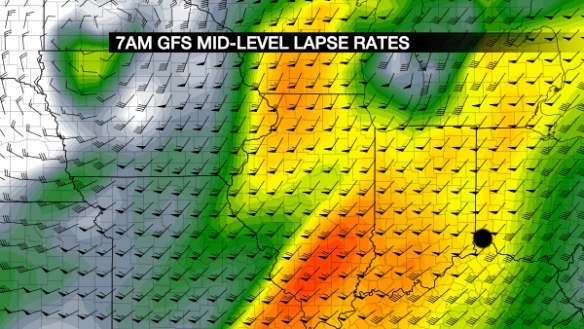
These are higher than the NAM. Clearly, there is uncertainty in the strength and timing of the highest lapse rates. The lapse rate is important when assessing storm strength.
How about the SHERB parameter? First, what is SHERB? To review from one of my previous blogs:
While instability can often have a big influence on the chance for thunderstorms, it isn’t as important this time of the year. If thunderstorms are likely […], the SHERB parameter or index can be very helpful to a meteorologist in the colder months when looking a threat for severe weather. The SHERB parameter is helpful for getting a handle on a severe weather threat in the colder months because it focuses on temperature changes near the ground, lift in the atmosphere, and wind shear instead of instability (instability tends to be low in the winter even when we get severe weather).
Why is SHERB important? Unlike summer severe weather events which are driven by high instability and less of everything else, cold season events are driven by everything else and not often by instability. SHERB is a special blend of “everything else” that is important when gauging a severe weather threat…which makes it valuable when we don’t have summer-like heat and humidity. When SHERB values are high and the chance for rain and storms is high, severe weather is often a concern.
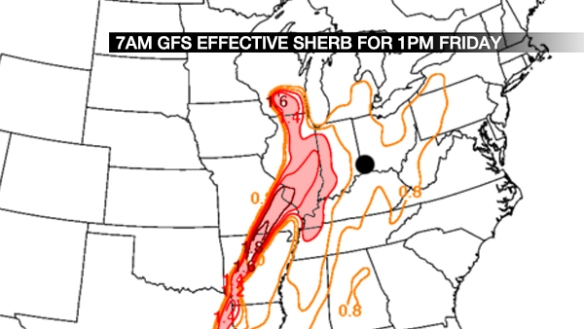
Here’s what the NAM thinks for effective (storm-based) SHERB at 1pm Friday:
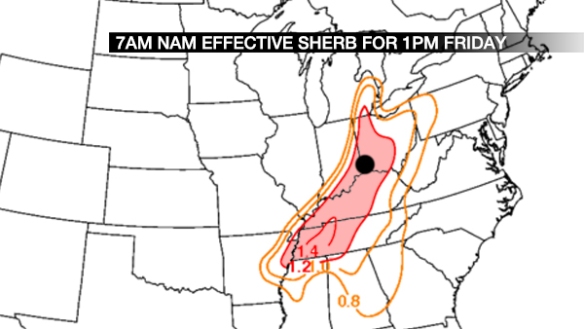
In low-instability, high wind shear environments (like Friday’s), the SHERB values greater than 1+ often signal support for strong and severe storms. What does the GFS think for SHERB values at 1pm Friday?
Again, the GFS develops the line of rain and storms to the west later Friday, whereas the NAM develops them closer to Cincinnati earlier Friday. What does SHERB look like later in the day Friday per the GFS?
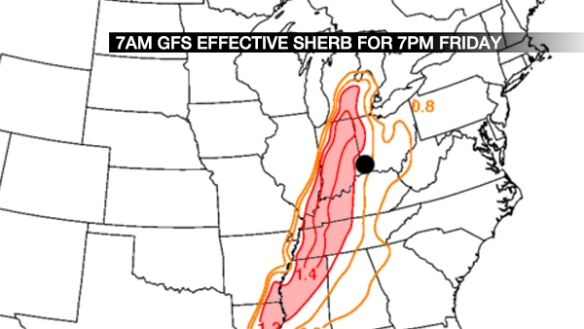
We’re almost in the sweet spot (1+), but most of those values stay west of the Tri-State through Friday night.
Clearly, there are timing and strength issues with Friday storms, but the environment is supportive of strong and severe storms near or west of the Tri-State. The SPC has pinpointed the most likely area for storms well.
Here’s my overall thinking on Friday’s severe threat:
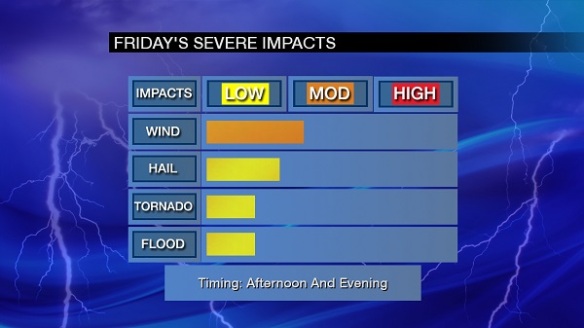
The timing is open-ended on purpose…for now.