The Problem With Sunday’s Highland County Tornado

On Tuesday afternoon, the National Weather Service in Wilmington, Ohio confirmed an EF-0 tornado in central Highland County that lasted approximately 4 minutes (from 8:39 to 8:43pm) Sunday evening. According to the damage survey, the tornado produced wind speeds up to 85mph and created a swath of damage 2.5 miles long. The tornado length is the 9th highest on record for any EF-0 Tri-State tornado since 1950.

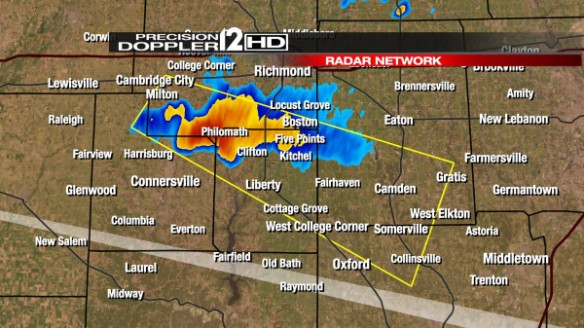
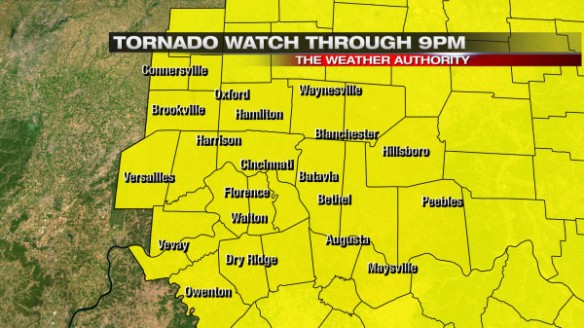
At 1:45pm ET on Sunday, the entire Tri-State was put under a Tornado Watch:

jul28-tornadowatch

In addition to SPC’s slight to moderate risk for severe storms issued days in advance, this was an early indication that tornadoes would be possible Sunday afternoon and evening. Many – including me – weren’t buying into the need for a watch Sunday afternoon. Afternoon clouds only allowed spotty showers to form. Showers and storms finally started to move into the Tri-State and intensify slightly after some late day sunshine. There was one Severe Thunderstorm Warning issued for a part of the Tri-State Sunday night: A Severe Thunderstorm Warning for Fayette, Union, and Butler County issued at 6:26pm…

jul28-severe

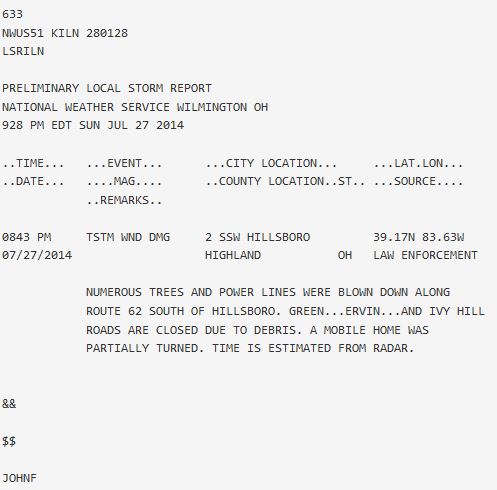
This warning did not verify. Showers and storms were spaced out for much of the evening and were not particularly strong. There was a report of a tree down on a house in Independence, Kentucky around 8:30pm, and that was the only report of damage for quite a while. Reports of damage came in late from Highland County; the first report of damage from Highland County came about 45 minutes after the damage had occurred:

jul28-lsr

This is not an uncommon report to have after a severe storm. It was a bit surprising to see the report given that no Tornado or Severe Thunderstorm Warning was issued for Highland County and radar data suggested there would be some areas of strong but sub-severe winds.

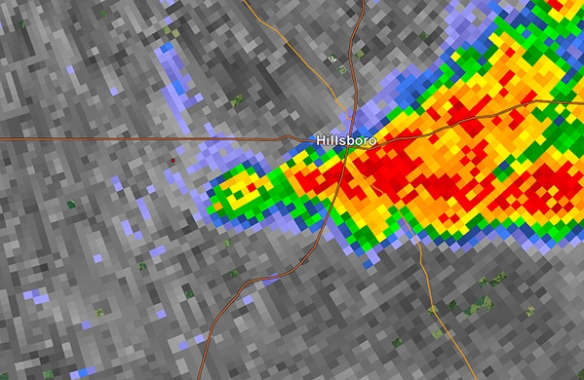
What exactly did radar data show? Here is the reflectivity scan (showing shower and storm intensity) from the NWS Wilmington, Ohio radar at 8:38pm Sunday night:

jul28-reflectivityedit

The tornado was confirmed southwest of Highland County, and it is clear that showers and storms in the area were intense. These showers and storms had good inflow, but there was no pronounced hook echo. What did the Doppler part of Doppler radar show?

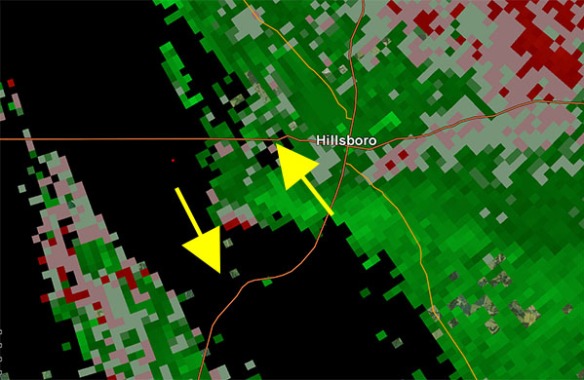
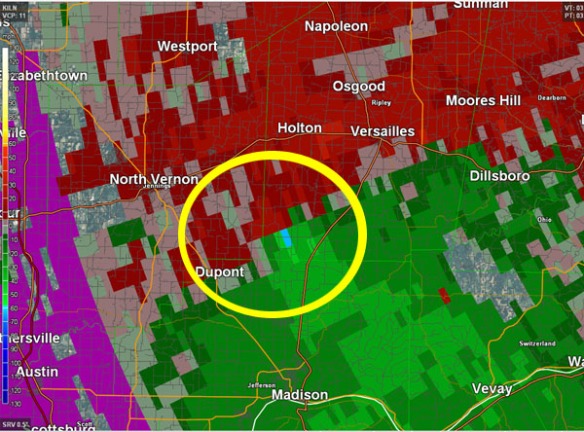
jul29-velocityedit

Storm relative velocity data from NWS Wilmington’s radar showed strong winds moving toward from the radar (green) south of Hillsboro around 8:40pm. The red pixels on the southwestern flank of this storm showed winds on average moving away from the radar in Wilmington. These red and green colors are not close together or bright, suggesting little or no rotation. Some storms in the Tri-State had stronger rotation Sunday night, and they did not produce tornadoes. What made this storm a troublemaker?

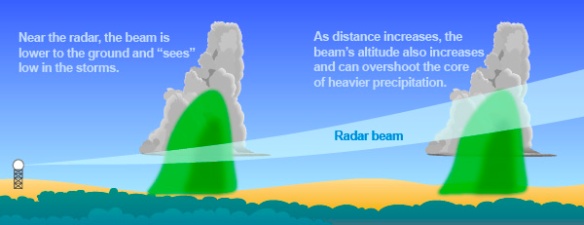
The real problem here is the radar data. This graphic from NOAA shows why this storm likely didn’t receive a warning:

jul28-radarbeam

Where the tornado began, NWS Wilmington’s radar beam was scanning about 1,100 feet above radar level (the radar is about 100 feet off of the ground in Wilmington). Despite being one county away from the radar site, the beam was likely too high to see the tornadic circulation or any parent circulation. Even with a recent upgrade – called SAILS – to the radar, the upgrade does not allow the radar to scan closer to the ground. The upgrade allows low-level scans to come from the radar during times of active or severe weather, but the upgrade does not give meteorologists the ability to see all tornadoes, including if they are far from the radar site.

The lowest scan from nearly all of the NWS radars covering this country is 0.5° above the ground. Why? Honestly, it’s fear of people getting blasted with radiation from these radars. The sun gives off a lot more radiation every day, but people aren’t constantly lathering up on sunscreen every time they go outside.

For years, the FAA has operated a radar in Kenton County, continuously scanning at 0.1° above the ground. To my knowledge, I’ve seen no complaint about this radar emitting radiation even closer to the ground than the NWS’ radar. Why should we be so considered with an NWS radar scanning at 0.1° instead of 0.5°? This fear of radiation and the bureaucracy surrounding it may actually be putting lives at risk. Lower-level scans will likely improve lead times on Tornado Warnings and Severe Thunderstorm Warnings. Lower-level scans will allow us to track hazardous weather with more accuracy. Why would we not want this?

Despite all of the improvements made to radars over the years (from more frequent updates to higher resolution to even more radars), the lowest-level scan is not getting any lower; this needs to change. The benefits of lower-level scanning outweigh the consequences; an upgrade that involves lower-level scan angles will allow us see tornadoes like the one that hit Highland County Sunday night with ease.


Why Tornado Warnings Should Be Issued For Every Tornado

One of the tenets of meteorology is debate. Computer forecast models are consistently at odds with each other about the timing of intensity of weather systems. There are disagreements between meteorologists about the differences between what a mostly sunny, partly cloudy, and partly sunny day looks like. Some weather-related topics, like climate change, are politically charged and constantly challenged.

Of all of the debates I’ve heard, the one that surprises me the most involves when and how the National Weather Service should issue Tornado Warnings. A Tornado Warning is issued when spotters see a tornado, funnel cloud, or rotating wall cloud or when weather radar suggests (or in some cases, confirms) rotation in a thunderstorm is strong enough to produce a tornado. Based on the limitations of technology and the density of the spotter network, many Tornado Warnings do not verify. Radar is a tool designed to track rotation, but radar does not always match what a spotter in the field sees. Some spotter reports are unreliable or misleading, occasionally prompting warnings that did not need to be issued. Even with these considerations, however, the threat of a tornado should not be ignored for any reason. Whether weak or strong, all tornadoes are dangerous.

While there are certain situations and environments which will undoubtedly support and create tornadic thunderstorms, most tornadoes form in far less supportive environments. Most weak tornadoes last on the order of minutes, and larger, upper-level circulations in a tornadic thunderstorm usually don’t last much longer. Many of these weak tornadoes form from thunderstorms in a larger complex of storms. Meteorologists often call these MCSs or QLCSs (mesoscale convective systems or quasi-linear convective systems, respectively). Areas of rotation in a complex of thunderstorms can be hard to see due to the number of storms and given that most tornadoes in a QLCS are short-lived (on the order of minutes).

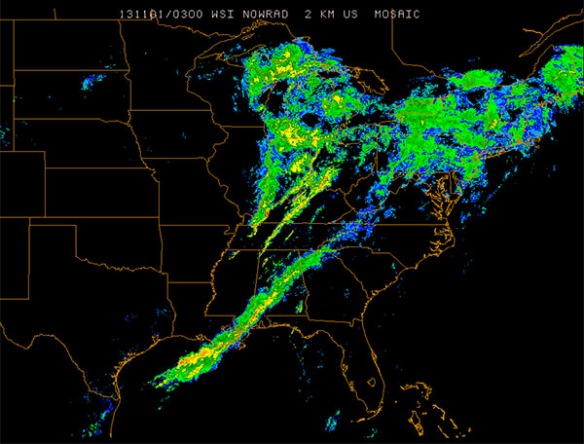
Consider the scenario we had on Halloween night of 2013. Here’s a radar snapshot late in the evening on October 31, 2013:
jun22-qlcs

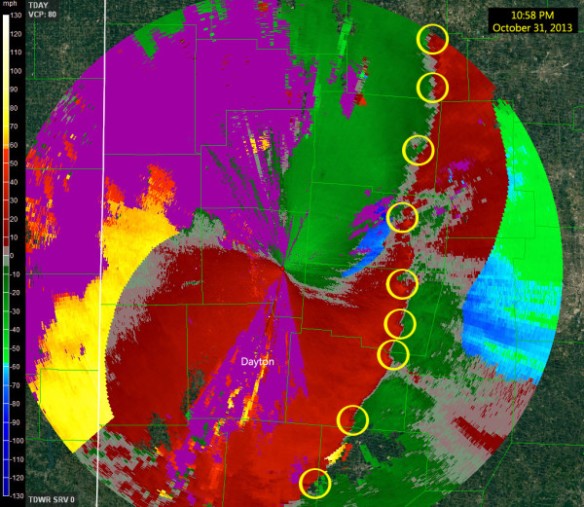
While it is very clear in this imagery that lines of showers and storms look strong and well-defined, using radar imagery some multiple radars is not very helpful for detecting rotation in thunderstorms. Using radial velocity data from a single radar site will be far more helpful for assessing how winds are moving relative to the radar. A snapshot of radial velocity data from the Terminal Doppler Weather Radar near the Dayton International Airport at 10:58pm on October 31, 2013 shows several areas where winds were moving towards and away from the radar in close proximity (circled):
jun22-tdwr

There was adequate support for severe storms and tornadoes (especially weak ones) that night. While instability was not strong, the jet stream, upper-level flow, and upper-level support was. Knowing that that this entire area was in an area where severe storms are possible, which areas of rotation circled in the image require a Tornado Warning? Some couplets (zones of rotation) are stronger than others, but you’d have a lot of false alarms if you issued on every couplet.

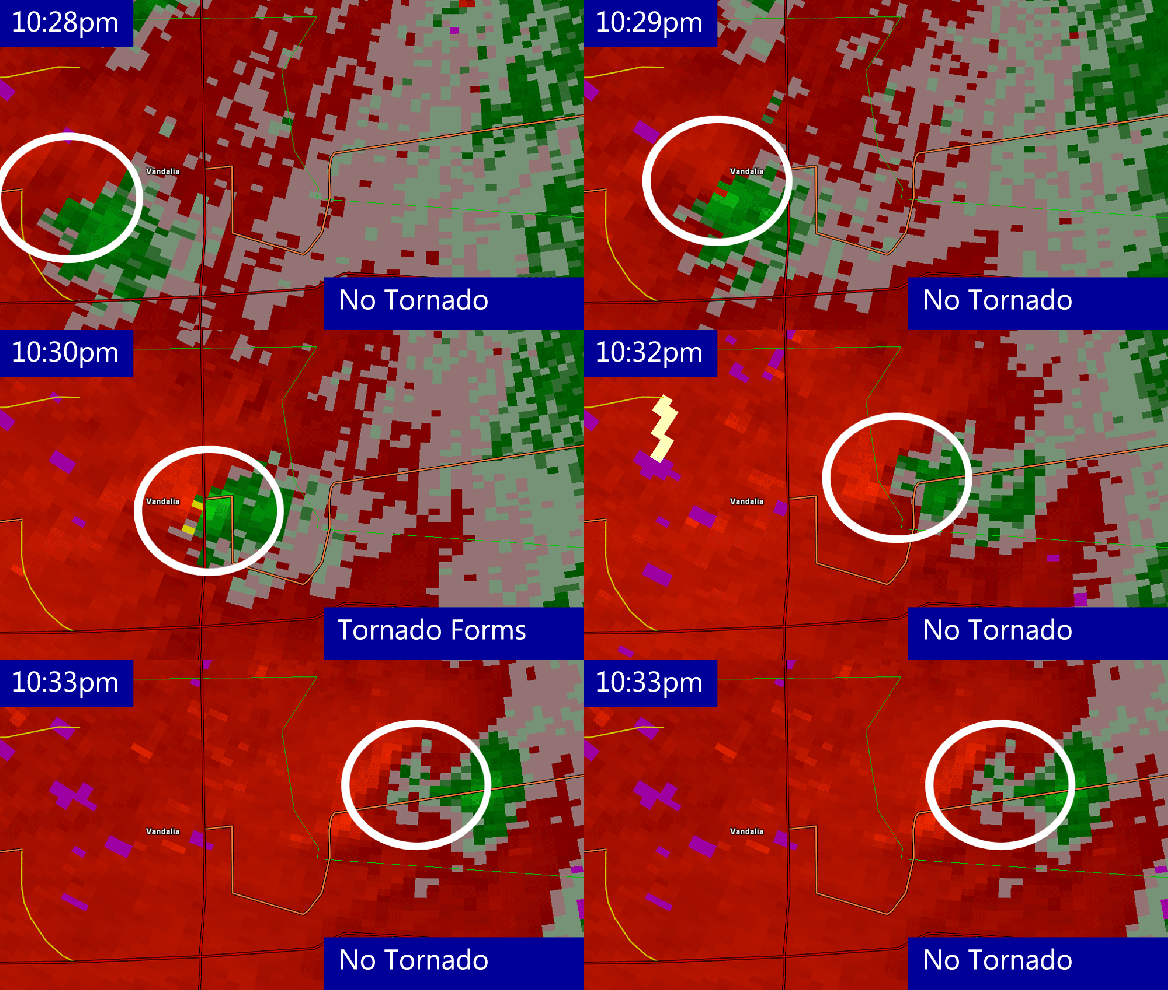
One tornado confirmed that night in the Ohio Valley occurred near Vandalia, Ohio. Even with a radial velocity scan produced by the radar every minute, the rotation the vicinity of the tornado is suddenly strong then suddenly weak in less than 5 minutes:
jun22-vandaliator

Even with high-resolution radar data, it is difficult to warn this community that a tornado is coming. It takes time for the National Weather Service to issue a Tornado Warning. It takes time for the media to break into programming to explain why a Tornado Warning was issued, show which communities are affected, and track the storm. It takes time for people to react and take cover. In this case, by the time all of this happened, the tornado had already dissipated.

While the tornado confirmed near Vandalia, Ohio on the evening of October 31, 2013 did not kill anyone, it injured 8 people. Unfortunately, many Ohio Valley tornadoes have killed people.

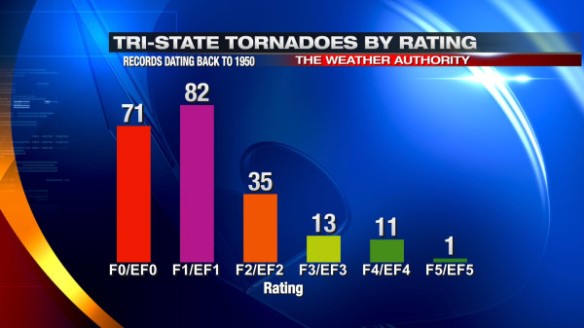
Historically, most tornadoes in the Tri-State since 1950 have been weak, receiving an F0, F1, EF0, or EF1 rating. For the sake of simplicity, I’ll classify “Tri-State tornadoes” as tornadoes since 1950 where any part of the tornado path is in the Tri-State. I’ll also count injuries, deaths, and damage caused by the entire tornado in my calculations even if part or most of these totals occurred outside of the Tri-State; odds are these “boosted” totals will be from stronger, longer-track tornadoes. Most tornadoes that have occurred in the Tri-State, however, began and ended in the Tri-State, so I will allow for this approximation.

The graph below shows that stronger tornadoes in the Tri-State have occurred less often than weaker tornadoes:
jun22-torratings

This is no great surprise; stronger tornadoes almost always require strong shear, instability, lift, and moisture. But do Tri-State tornadoes with a higher rating kill more people? Historical records suggest “yes,” but to a point:
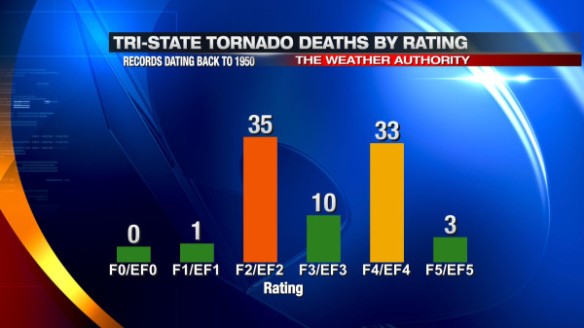
jun22-tordeaths

It is important to note that weak tornadoes (tornadoes with an F0, F1, EF0, or EF1 rating) have only killed one person in the Tri-State since 1950, while strong tornadoes (with an F2+ or EF2+ rating) account for roughly 99% of all Tri-State tornado deaths.

I won’t go into great detail about it here, but I believe the spikes in F2/EF2 and F4/EF4 fatalities are more about what, when, and where the tornadoes hit and less about the strength of the tornado.  The time of day, the time of year, population density in the path of the storm, and other factors likely contribute to the “spikes.” The F-scale and EF-scale are two different rating scales, and lumping and EF- and F-scale rated tornadoes into bins may also affect how the graph looks. The point I am highlighting is that stronger tornadoes tend to be killer tornadoes.

Injuries are more common than deaths with tornadoes, and – locally – more injuries have occurred with stronger tornadoes than with weaker ones:
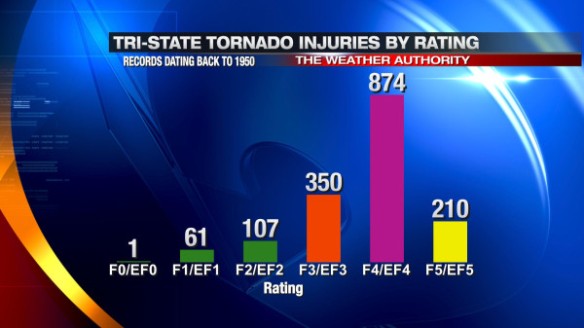
jun22-torinjuries

There has only been one Tri-State tornado given an F5 or EF5 rating since 1950: the Boone County/Sayler Park tornado on April 3, 1974; this is likely the reason for a large drop in the injury count from F4/EF4 to F5/EF5 tornadoes.

So why issue Tornado Warnings for weaker tornadoes if they kill and injure fewer than F2/EF2+ rated tornadoes? If this were the case, fewer Tornado Warnings issued would lead to a lower false alarm rate, and fewer people would ignore Tornado Warnings. Why not just worry about the big tornadoes and ignore the small ones?

There are two big reasons. Here is the first:

jun22-nwsmission

The Mission of the National Weather Service is to protect “life and property.” While protecting lives is of utmost importance, the Mission Statement also includes the words “and property.” The warnings that come from the National Weather Service and the tracking and alerting that broadcast meteorologists do is all in an effort to protect you and what you own. Regardless of whether they work for the NWS, in the media, academia, or the the private sector, meteorologists – as a whole – are committed to the NWS’ mission.

Some of the strongest tornadoes that have ever occurred in the Tri-State caused thousands if not millions of dollars in damage:
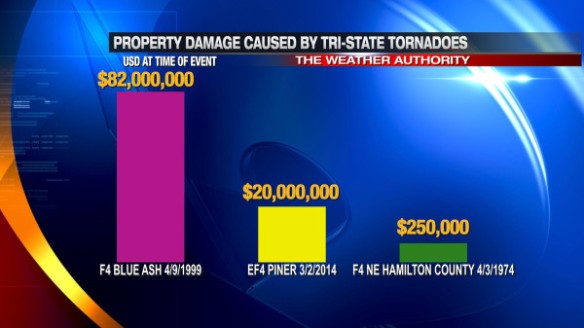
jun22-tordamages

Even weak tornadoes can cause hundreds of thousands of dollars in damage. An F1 tornado in Dearborn County in the early morning hours of April 9, 1999 caused an estimated $250,000 (in USD at the time) worth of damage. Should we – the weather community – inform viewers when there’s an imminent threat of a tornado, regardless of whether it will injure people, kill people, or cause damage? Absolutely. People deserve the right to know what is coming for their them. Should the National Weather Service not issue a Flash Flood Warning if it will only cause homes to be damaged but not kill anyone? Should a broadcast meteorologist only cover a winter storm if it has the potential to be life threatening? Should meteorologist in the private sector only create a product or service that prevents injuries but doesn’t work to prevent deaths? The answer to all of these question is a resounding “NO.”

The second – and just as important – point is that discerning weak from strong tornadoes isn’t easily done in real-time. Despite incredible improvements in technology in the last 50 years, there will always be limitations to what a radar and spotter network can give a meteorologist. Radar doesn’t scan at the ground, and there will always be cases where a radar sees strong circulation but there is no tornado. Spotters are important for being the “ground truth” in the field, but spotters are not everywhere. Spotters can report a tornado and/or describe it, and radar can – in some cases – confirm a damaging tornado in progress. This, unfortunately, is where radar and spotters reach their maximum effectiveness.

Spotters and radar can’t rate a tornado. The EF-scale is based off of damage. In order for a tornado to get an EF rating, a National Weather Service survey team must survey the damage. Books and binders worth of documentation are often brought to the scene damage site so that the National Weather Service can compare what they see to a specific set of guidelines and give the tornado a rating. These surveys can take hours or even days.

As time goes on, we will learn more about how tornadoes form, how they dissipate, their environments, how to track them, and how to detect them with more accuracy. We will not, however, gain the ability to rate tornadoes on the EF scale in real-time. In other words, trying to rate a tornado as it cuts through a community is not worth our time. If we can’t definitively predict the rating of a tornado in real-time, why should we attempt to gauge which tornadoes will kill or injure people and which ones won’t? This is a dangerous game with no winners.

Tornado Warnings were created to warn those in the path that a tornado is imminent. Whether a tornado is radar indicated or confirmed by a spotter in the field, the threat for a tornado is real when a Tornado Warning is in effect. Some tornadoes will cause damage; others will kill and injure people. A meteorologist’s job is to warn, prepare, and educate. Daring to guess which storms will play nice and which ones won’t is best left to those who create the weather instead of forecasting it.

A Personal Reflection Of The April 9, 1999 Tornadoes

It was the loudest thunderstorm I’ve ever heard in my life.

There was a cadence of thunder. Lightning resembled a strobe light. The lightning and thunder was so intense that you couldn’t sleep through it if you tried. It didn’t last a minute; it lasted 10 minutes. It wasn’t constant thunder and lightning; it was loud, bright, and constant. Based on the thunder and lightning alone, you knew something was wrong. And there was.

I woke up the next morning really not remembering what had happened hours ago. Sun was coming through the window, and the storms had moved out by 7am when I woke up. Sycamore Schools had been called off, and I remember hearing it on my alarm radio. Family members called asking if we were okay. There were tree branches down in my area, but there was nothing suspicious going on outside. I remember wondering who had moved our gas grill to the other side of the deck that morning; no human moved it.
It was clear once the TV was on that there was extensive damage on the other side of Blue Ash. It was likely a tornado based on the severity of the damage, but it was not confirmed at that point.

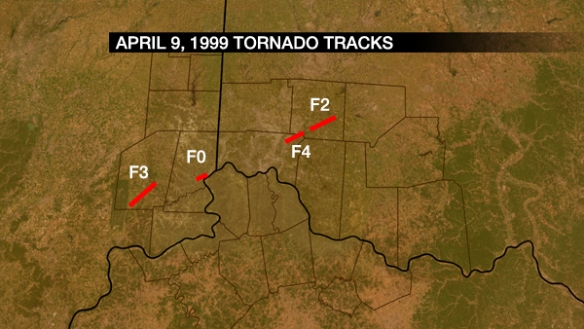
There 5 tornadoes in the Tri-State in the early morning hours of April 9, 1999. The map below shows 4 of them; an F1 tornado near Addyston is not shown:

apr9-tornadotracks

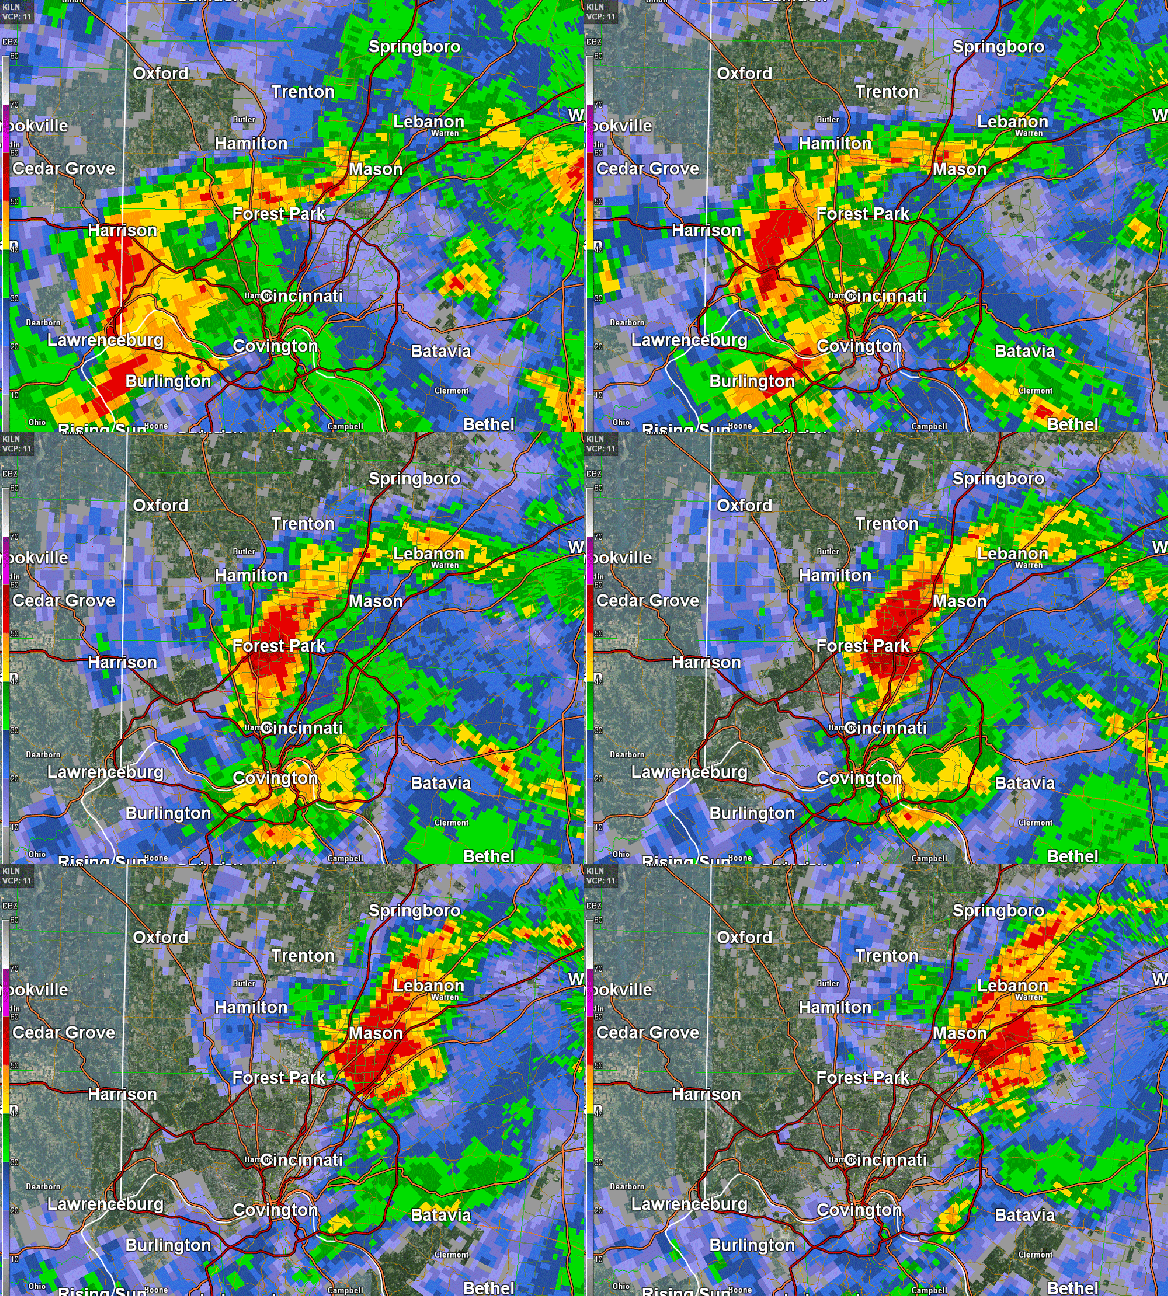
A pair of thunderstorms were out to make trouble that night. One storm created two tornadoes in southeastern Indiana. Another caused damage in northeastern Hamilton County and southern Warren County. While the southern storm started strong, the northern storm would win out and cause the most damage that morning:

april9

The first tornado of the night was an F3 in Ripley County, touching down near the Big Oaks Refuge and dissipating before it moved in Dearborn County. The storm relative velocity product showed strong inbound and outbound motion (in green/blue and red, respectively) in southern Ripley County just before 4am on April 9, 1999; the storm-relative velocity product is essentially the raw radar velocity product with the motion of the storm subtracted out.

apr9-ripley

While this tornado was significant and killed 3 people, a much larger, powerful tornado would develop less than one hour later from a separate thunderstorm.

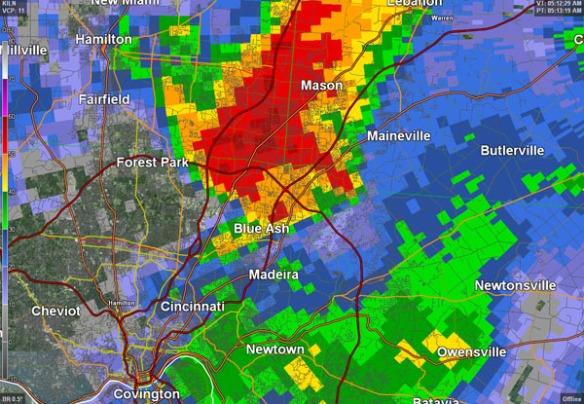
The 5:12am radar scan that night from the National Weather Service in Wilmington showed the classic “hook echo” forming just west of I-71:

apr9-refl

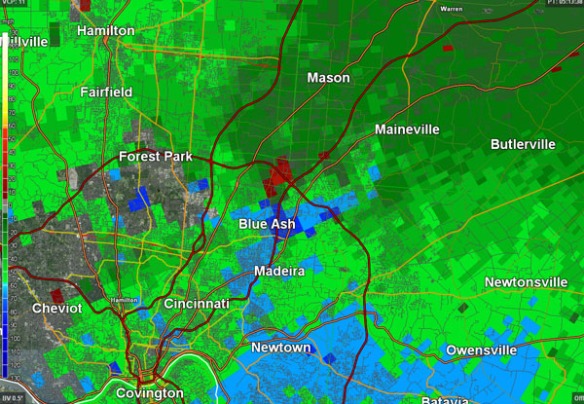
The radar velocity scan showed intense rotation near Blue Ash at that same time. Blue colors in the image below show strong winds moving towards the radar, and red colors show winds moving away from the radar; the tornado is very close to where these colors meet:

apr9-velocity

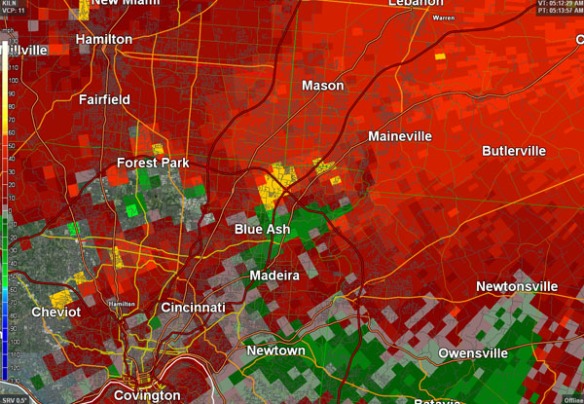
The storm-relative velocity scan at 5:12am below shows the rotation as well:

apr-srm

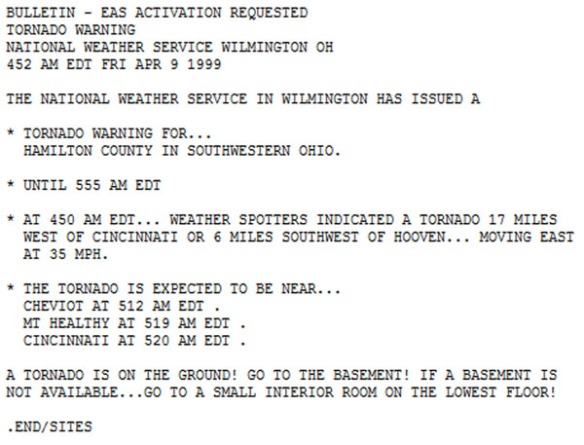
4 people were killed and 65 were injured as a result of the Blue Ash/Montgomery/Symmes Township tornado on April 9, 1999. More likely would have been killed or injured from this tornado had it not been for reports of a tornado and damage from trained weather spotters in Ripley and Dearborn County. This report was received by the National Weather Service at a critical, warning decision making time. The Tornado Warning issued for Hamilton County in the early morning hours of April 9, 1999 acknowledges a report of a tornado in southeastern Indiana minutes before Hamilton County was put under the warning.

apr9-warning

These spotters saved lives that night.

There have only been 11 tornadoes in the Tri-State since 1950 to be classified as a violent tornado (given a rating of F4, F5, EF4, or EF5). The tornado that hit Blue Ash, Montgomery, and Symmes Township was one them. These communities had roughly 30 minutes of warning lead time to take cover, but this warning occurred on a night where the severe weather threat was not excessively high. Two Tornado Watch boxes were issued for the Tri-State that night, but there was no imminent threat of a tornado during the late local news. Most went to bed hours before the hours not expecting a tornado to crash into their house. The Internet was not used like it is today, and NOAA Weather Radios were not used as often. After seeing the damage firsthand, it is surprising that more weren’t killed or injured.

The event was also a game changer for how storms were covered by local TV stations. While tornado coverage was there, it revitalized the sense of urgency that storms bring. The loss of life that morning changed TV severe weather policies and how storms were tracked and covered.

With the tornadoes from April 9, 1999 included in the count, April is the most common month for tornadoes in the Tri-State (41 in total since 1950).

April 9, 1999 reminds us that tornadoes can and do strike how and when they want. They don’t wait until the sun comes up, and they don’t discriminate. Nighttime tornadoes are dangerous, and they are among the deadliest types of tornadoes because they cause damage when people are most vulnerable. Lessons were learned that morning 15 years ago; my hope is that we are better prepared for the next round of storms.

A Review Of Meteorological Winter 2013-2014

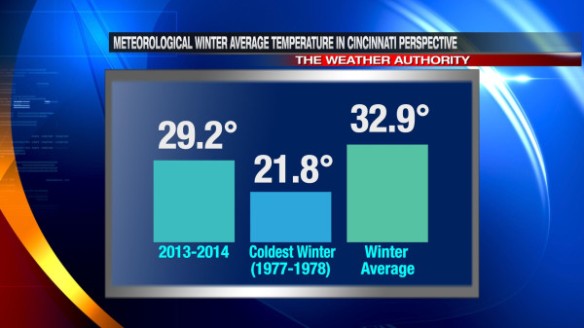
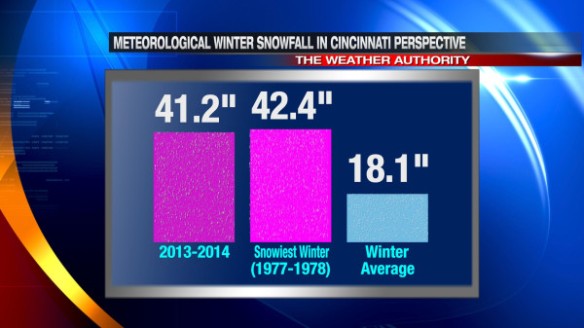
Winter is far from over, but the core of the winter season – December, January, and February – was among the snowiest and coldest on record. In fact, meteorological winter 2013-2014 was the 2nd snowiest and the 18th coldest on record in Cincinnati.

To ensure that meteorologists compare apples with apples, meteorological winter is defined as December, January, and February. Astronomical winter’s start and end date varies each year and often ends and begins at a different time each year. Meteorological winter is always 3 months long, so it’s simple to compare seasons.

To measure where a season ranks compared to other years, we must know the average temperature of each day in that season. The average temperature of a day is the high and low temperature divided by two; the average temperature of a season is the average of all of the daily average temperatures in a season. When you crunch these numbers for the winter of 2013-2014, it ranks as the 18th coldest:

feb28-averagetemp

Meteorological winter of 2013-2014 ranks as the 2nd snowiest on record in Cincinnati; we were close to the number one spot of 1977-1978!

feb28-snowfall

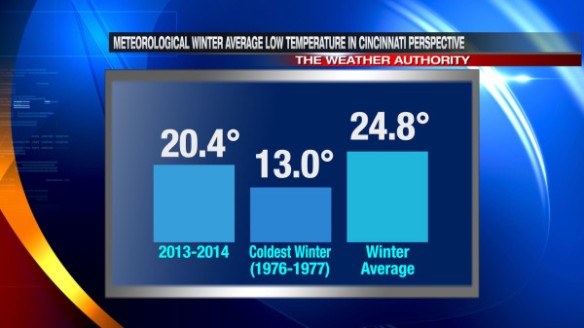
While those are the two most common ways to measure a winter’s might, there are other ways. Ranking as the 14th coldest, the average low temperature this winter in the Queen City was 4.4° below average, but it was nowhere near as cold as 1976-1977:

feb28-averagelow

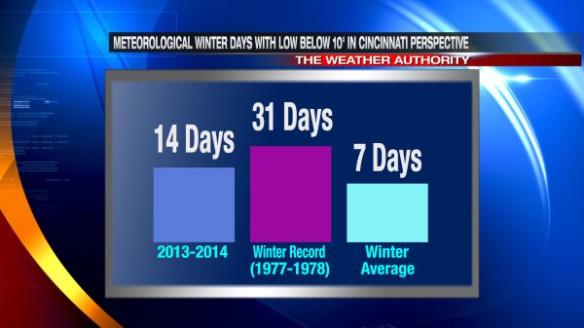
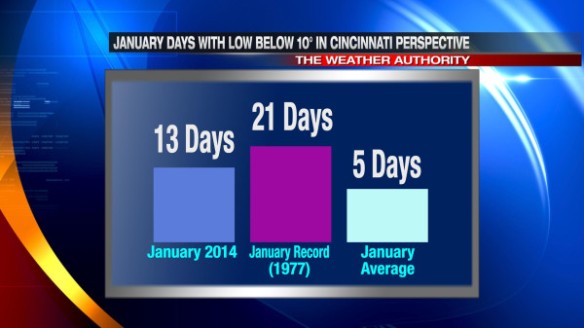
The number of nights where we dropped below 10° in meteorological winter was double the average but well short of the record set in 1976-1977:

feb28-lowbelow10

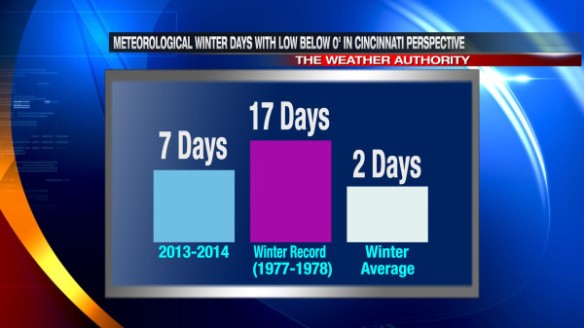
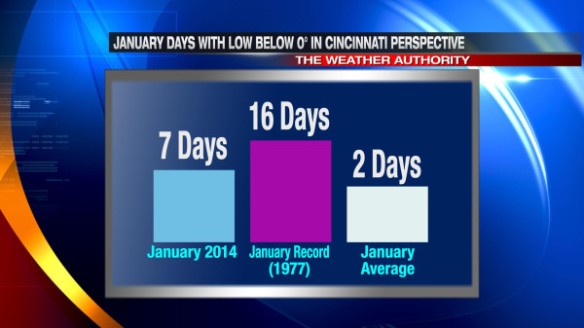
Cincinnati dropped below 0° 7 days between December 1st and February 28th. This is over three times the average, but 10 days short of the record:

feb28-lowbelow0

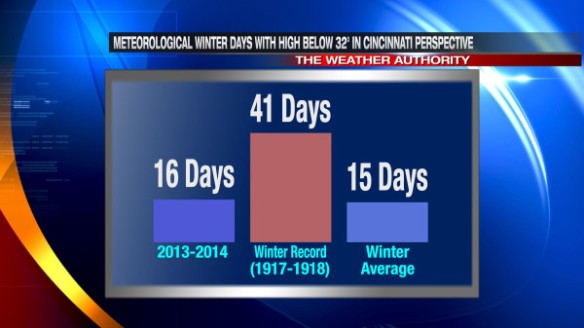
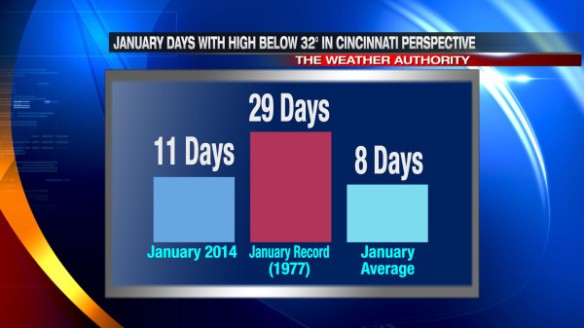
While the days were cold, records show that the number of days in December, February, and January where the high was below 32° was about average and not even close to matching the record:

feb28-highbelow32

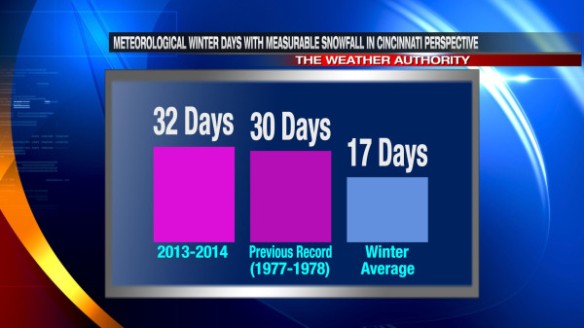
One big record was set this winter: the most number of days (32) in meteorological winter with measurable snowfall. This beats the previous record set in 1977-1978 of 30 days:

feb28-measurablesnowfall

One Tornado Warnings and seven Severe Thunderstorm Warnings were issued in February 2014. The Tornado Warning was the first issued in the Tri-State during February since National Weather Service Forecast Office in Wilmington records began in 1995. The tornado confirmed by the National Weather Service in Ripley County was the first February tornado in the Tri-State since February 15, 1967.

Even after the brutal cold of meteorological winter 2013-2014, nearly all records of snowfall and cold still belong to 1976-1977 or 1977-1978. Rounds of snow and ice are far from over in the Ohio Valley. Cincinnati averages 3.1″ of snowfall each March; some in the Tri-State may see more than that Sunday into Monday!

January 2014 Was Cold, Snowy But Nothing Like 1977

If you thought January 2014 was cold and snowy, you’re right. January 2014 was the 4th snowiest and 12th coldest January on record in the Queen City. Considering official weather records for January in Cincinnati go back to 1871, making it in the top 20 lists for snow and cold in January is impressive. When you have winters like 1976-1977 and 1977-1978, however, it is very hard to get to or near the top spot of the coldest and snowiest month of the year (on average).

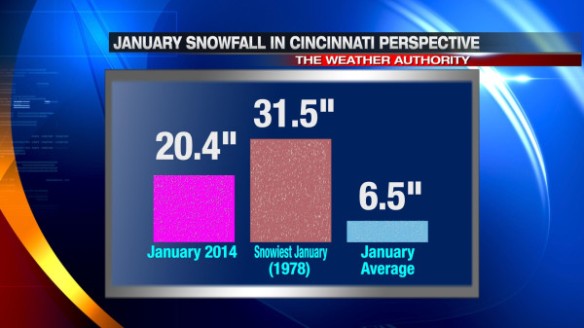
January’s snowfall total at the Cincinnati/Northern Kentucky International Airport of 20.4″ was over three times the average amount of snowfall in January, but it fell well short of the January 1977 snowfall total:

feb2-blog-januarysnow

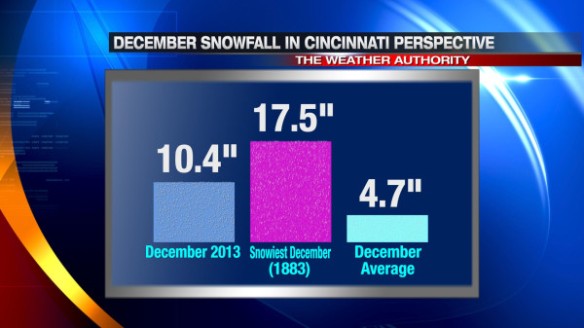
The snow that fell in January felt like even more of a burden after a very snowy December. December 2013 (with a total of 10.4″ of snowfall) was the 9th snowiest December on record in the Queen City:

feb2-blog-decsnow

December’s 2013 total was 1/2″ short of January 1977’s total, and over 7″ below the December 1883 snowfall total. The National Weather Service says official snow records began in 1893; if you accept that as the start of official records (and not when other records like temperature and precipitation began in November of 1870), December 2013 was the was the 7th snowiest December on record.

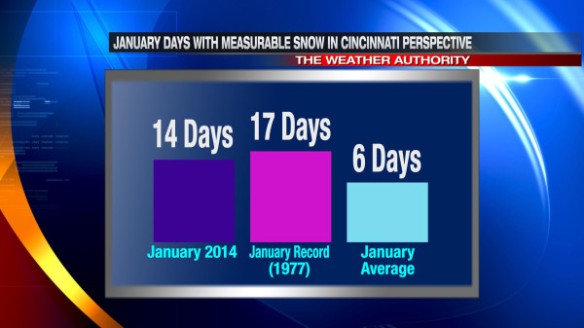
January 2014 was also snowier than average by the number of days with measurable snowfall in Cincinnati:

feb2-blog-meassnow

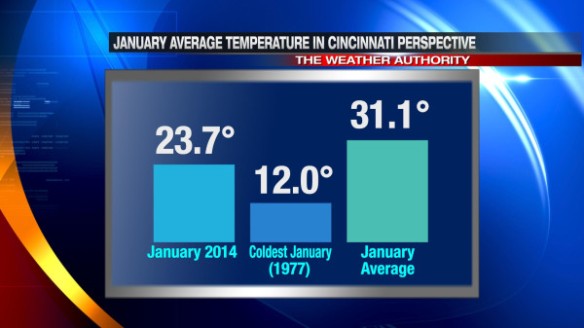
January 2014 was also a very cold month. In meteorology, the ranking of cold is determined by calculating the average temperature of the month. The average temperature of any given day is average of the high temperature and low temperature; the average temperature of the month is calculated by averaging daily average temperatures for the entire month (did you get all of that?). By this measure, January 2014 was the 12th coldest January since official records began (in November 1870):

feb2-blog-janavgtemp

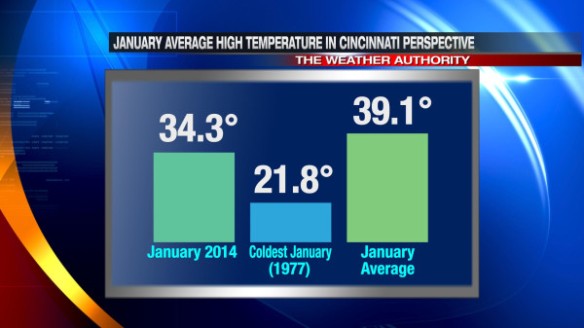
The average high temperature in January 2014 was colder than the 30-year average but well above of the average high temperature in 1977:

feb2-blog-janavghigh

It was the same story with low temperatures: January 2014’s average low temperature was below the 30-year average but above the average low temperature of January 1977:

feb2-blog-janavglow

The temperature frequently dropped below 10° in January 2014, but the record of January nights with a low temperature below 10° went unchanged this year:

feb2-blog-lowsbelow10

We also dropped below 0° 7 days in January 2014, but we dropped below 0° more frequently in 1977:

feb2-blog-lowsbelow0

The cold of January 2014 was not just felt at night; we had several days where the temperature didn’t get above 32°. Despite being above the average, our count of days with a high temperature below 32° fell way short of the 29 days with a high below 32° in January 1977:

feb2-blog-highbelow32

Regardless of how you measure it, January was a very cold, snowy month; the king of cold and snow continues to be 1977. More waves of snow and cold are on the way in the month ahead. Our snowfall total since last summer now stands at 33.7″; we need need just over 20″ to get to the all-time fall/winter/spring snowfall record set in – you guessed it – 1977 through 1978.

Remembering The Coldest Morning In Cincinnati 37 Years Ago

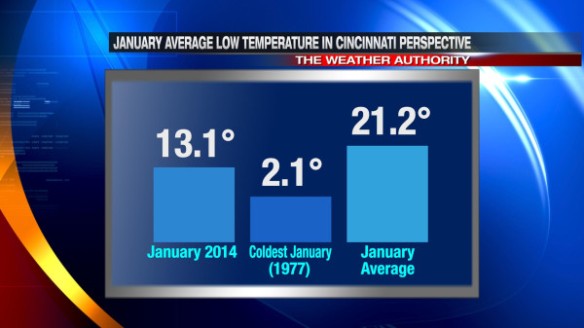
In Cincinnati, the month by which all cold or snowy months are measured against is January 1977. Those who have lived in Cincinnati for decades – regardless of when they were born in the 20th century – will tell you the winters of 1977 and 1978 were the coldest and snowiest. The average high temperature that month was 22°; the average low temperature was 2°. In January 1977, the low temperature dropped below 0° 16 days, and the high temperature didn’t even get to 0° one of those days. Over 30″ of snow fell that month, and 13 days of that month began with 10″+ of snow on the ground. It was cold.

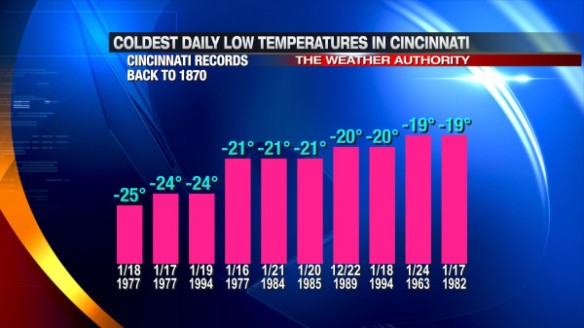
That cold has stood the test of time. 37 years later, 3 of the top 4 coldest early morning low temperatures in Cincinnati were set in January 1977:

jan17-coldest

In the mid 80s and 90s, sharp cold shots and a deep snowpack over the Ohio Valley allowed the temperature to dip to -20° or colder, but those cold blasts were not as prolonged as the cold of January 1977.

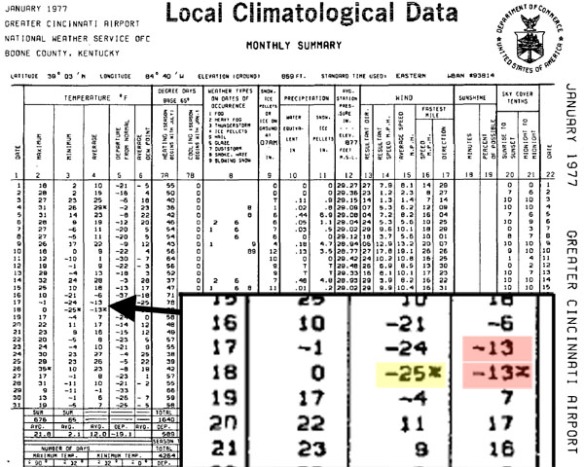
Two of the coldest daily low temperatures on record in Cincinnati were set on consecutive nights. The all-time coldest low temperature for Cincinnati was set on January 17, 1977 (-24°); the following night – January 18, 1977 – the temperature dropped to -25° at the Cincinnati/Northern Kentucky International Airport, which was the new all-time coldest low temperature recorded. Prior to these days, the all-time record low for Cincinnati was -19°, set on January 24, 1963.

The official climatological summary from the National Weather Service shows the all-time record low from January 18th (yellow) and all-time record lowest average temperatures from January 17th and 18th (red) highlighted with an asterisk:

record

Using the average temperature as a measure, January 16th, 17th, and 18th of 1977 is the coldest 3-day stretch on record in Cincinnati.

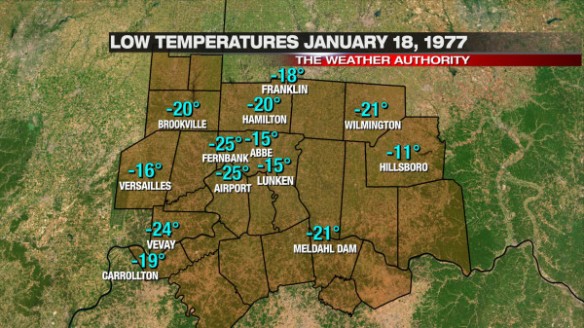
-25° still stands as the all-time record low temperature for the Queen City to this date. Several spots in the Tri-State were just as cold as the International Airport that mid-January morning, but others were not as cold:

jan17-dec1877lows

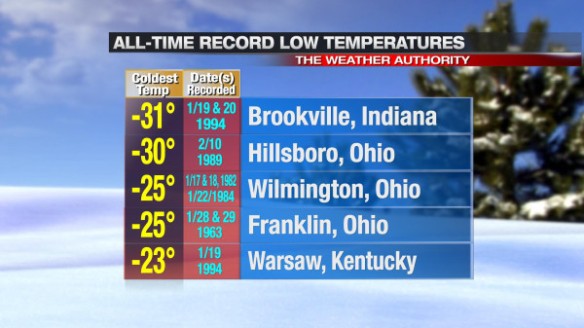
The all-time record low temperature was also set at Fernbank (in western Hamilton County) that morning. Other all-time records in the Tri-State, however, were not set that morning. Here is a small sampling of when all-time record low temperatures were set at several Tri-State locations:

jan17-alltimelows

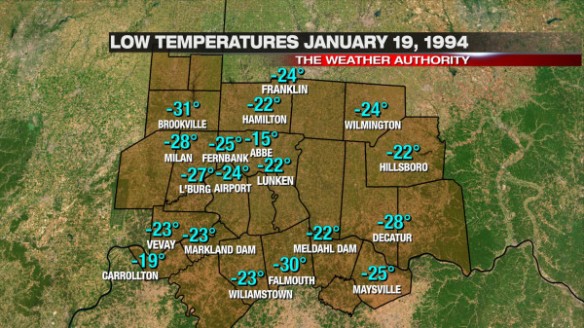
Several all-time low temperature records were set in January 1994, especially on the 19th. The all-time low temperature in Cincinnati was almost matched that day:

jan17-jan1994lows

5-10″ of snow covered the Tri-State on January 19, 1994. Maysville’s all-time record low temperature was set that morning, but January 17th and 18th, 1977 weather records from Maysville are missing…when it may have gotten colder than in 1994.

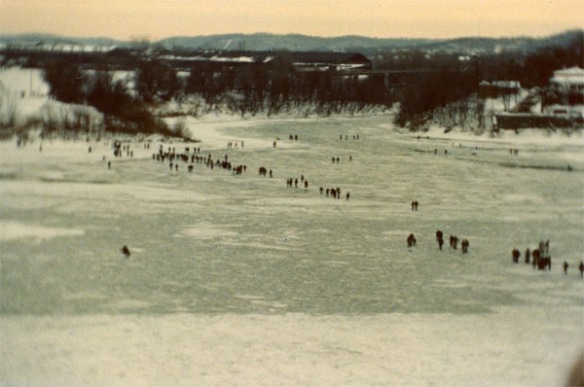
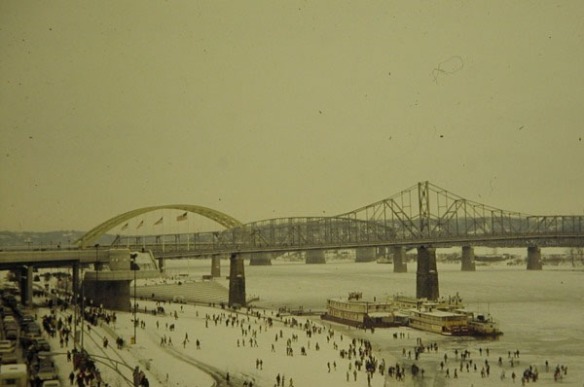
While the numbers tell a story, the photos from January 1977 tell more. Many did what may never be possible again in our lifetimes; they walked across the frozen Ohio River.

jan17-crossing
Frozen Ohio River in January 1977; photo courtesy of Edith Suttle

National Weather Service records show navigation up and down the Ohio River past Cincinnati was suspended from January 25 to February 2, 1977. The photo above shows travel across the river by foot was easier than down the river by boat.

jan17-cathy
Frozen Ohio River in January 1977; photo courtesy of Cathy Lang

The several party boats were stuck along the shore for days. The Showboat Majestic was surrounded by ice.

Not everyone remembers tornadoes, floods, or hail storms; those weather events often affect a select group of people and don’t always leave a large footprint. Perhaps more than any other Tri-State weather-related event, those who lived through the snowiest, coldest January on record or walked over the Ohio River remember it.
The Truth About Next Week’s Cold

While models have wobbled more than usual with the handling of weather systems recently, the latest computer model runs all suggest a large piece of arctic air will drop into the Ohio Valley next week. The specifics about the timing and strength of the cold plunge are nowhere close to being finalized, but a signal of very to extremely cold temperatures should be taken seriously.

There is already a lot of hype about next week’s cold blast on social media. Some models are producing very cold temperatures for the Tri-State next week, while others are suggesting we’ll come close to setting all-time record low temperatures. These same models may change their tune later this week and over the weekend, but for now, they all agree that cold (in some form) is coming soon.

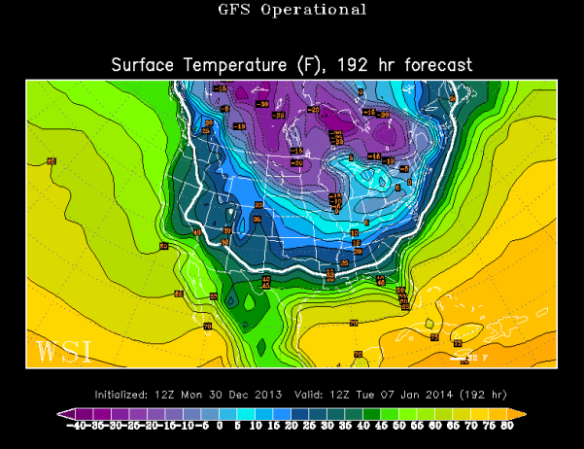
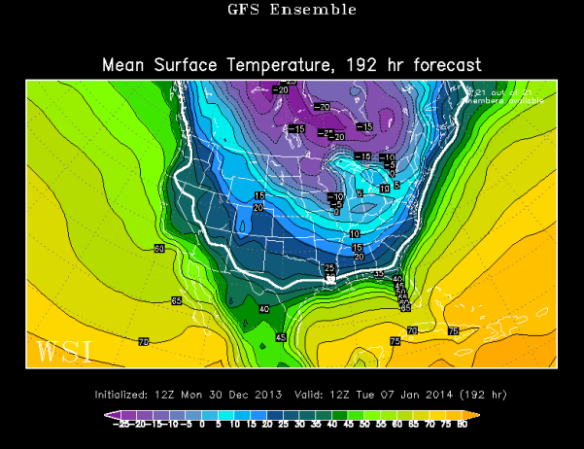
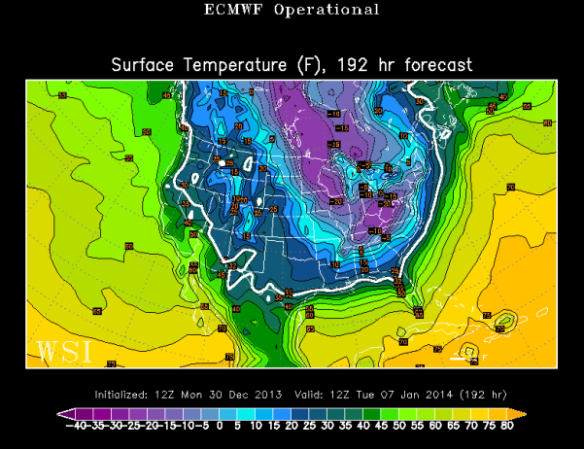
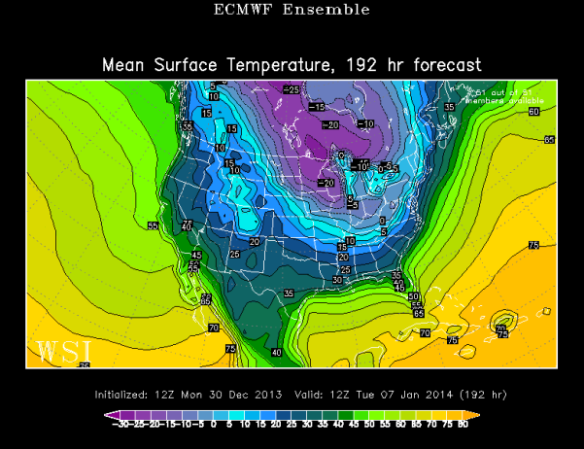
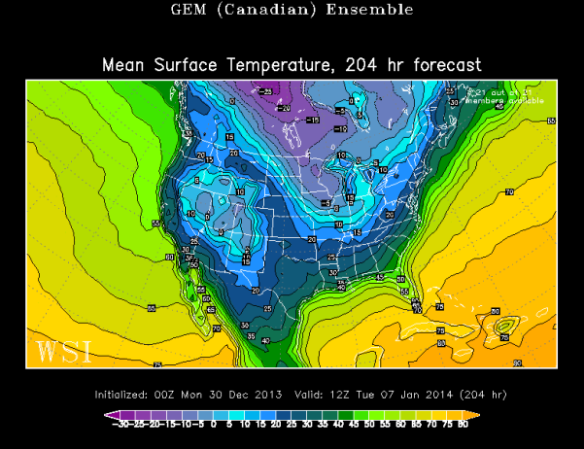
For the sake of simplicity, I’ll focus on next Tuesday morning (January 7th). This morning’s GFS model pushes temperatures to around 0° in Cincinnati that morning:

dec30-gfsop

The GFS model ensemble members averaged together suggests we’ll drop between 5 and 10° above zero:

dec30-gfsensemble

This morning’s ECMWF model says the Tri-State will drop between -10° and -25° below zero Tuesday morning:

dec30-ecoper

Meanwhille, the ECMWF model ensembles averaged together drops Cincinnati between 0° and -5°:

dec30-ecensemble

The Canadian model ensembles averaged together – which tends to do well with extreme cold – drops the temperature to around 10° in Cincinnati early next Tuesday morning:

dec30-cmcensemble

Clearly, there is a large spread on overnight lows from one model to the next. Long range forecasting can be very tricky, especially when dealing with the timing of disturbances more than a week out.
Long range forecasting is especially hard this time of the year because:

– The lack or depth of a snowpack can have a large influence on temperatures
– Models tend to overdevelop areas of low pressure in the winter, and – thus the amount of cold air behind departing behind them
– Cloud decks are also tough to forecast more than one week out, especially stratus decks and low-level inversions/stable layers of air aloft

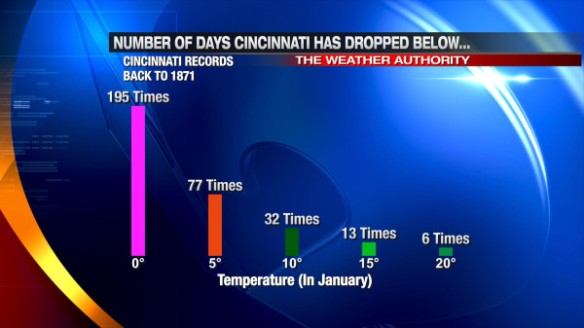
For these reasons and others, forecasting temperatures for next week now is difficult at best. While models may not agree with each other, they are sending a signal of brutal cold. Here’s a list of how many times Cincinnati has dropped below certain temperatures in January since 1871:

dec30-coldtimes

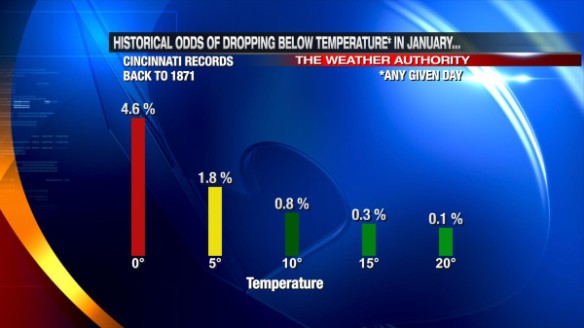
What are the historical odds that the low temperature on any given January day in Cincinnati will drop below these same temperatures?

dec30-historicalodds

On average, Cincinnati drops below 0° two days each January. There have been many years where we didn’t hit 0°, but there have also been years where we hit or dropped below 0° frequently (16 days in January 1977).

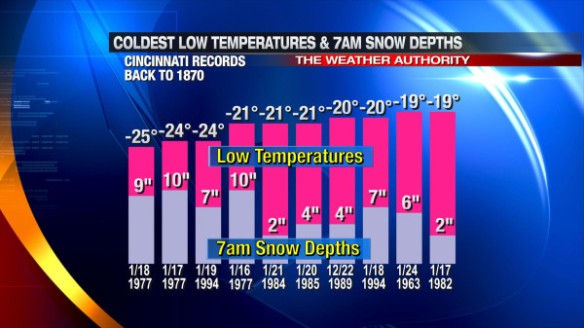
A lot is needed to get a temperature well below zero in Cincinnati. Notice that all of the top 10 coldest mornings on record in Cincinnati had at least two inches of snow on the ground:

dec30-coldestlows

The presence and amount of snow on the ground in Cincinnati has a big impact on how cold we get at night. The presence and amount of cloud cover at night has a impact on how cold the Tri-State gets. The amount of snow to the north and west of Cincinnati (even as far back as the Plains and Dakotas) can have a big impact on how low temperatures go. Just as drought begets drought and wet begets wet, cold and snow begets cold and snow. A dense snowpack from the Ohio Valley to the Plains is often a major contributor to record cold, as arctic air from Canada “holds together” better when it travels south.

Simply put, we are getting signals from recent computer model runs about a significant surge of arctic air next week. Some models suggest we will see near-record cold, but this is highly dependent on the extent of cloud cover and snow cover in the Ohio Valley in the coming days. Stay tuned for what could be one of the biggest – if not the biggest – polar plunges we’ve had the Tri-State in the last couple of years!

Perspective On How Rare Saturday’s Weather Was

Did Saturday’s weather seem unusual to you? It was. In fact, it was very unusual by several different measures. Heavy rain is not common in December, and severe weather isn’t either. We had plenty of both this weekend, fueled by an abundance of warmth and low-level moisture.

How does one measure the weirdness of weather? The easiest way to do this is by variable.

It was hard to ignore the rain this weekend, especially with Friday, Saturday, and Sunday being some of the biggest travel and shopping days of the year.

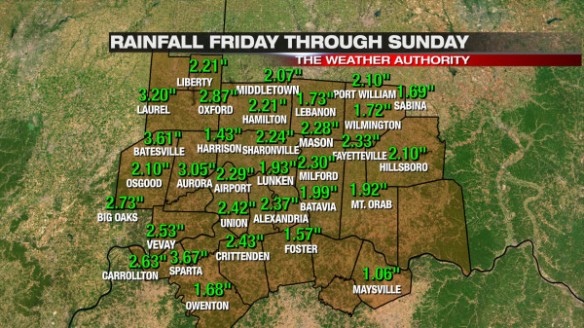
Rainfall totals varied from one community to the next, but most fell into a 1-3″ range; some were just outside the range:

dec22-rainfallmap

While 1-3″ is a significant amount of rain, it doesn’t always lead to problems. For this event, however, it caused widespread flooding thanks to one of the snowiest starts to December on record and temperatures in the 40s, 50s, and 60s before, during, and after rain was falling. Tri-State soils were wet to soaked before rain fell in many communities, and 1-3″ of rain on top of a saturated ground means flooding is imminent.

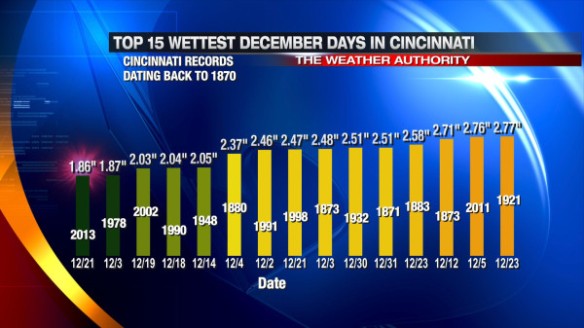
The 2.29″ storm total at the International Airport is about 68% of the average amount of precipitation (rain + melted down snow and ice) Cincinnati gets in the entire month of December. 1.86″ of that total fell between midnight Saturday and midnight Sunday, making Saturday, December 21st the 15th wettest December day on record (since 1870) in the Queen City:

dec22-wettestdecdays

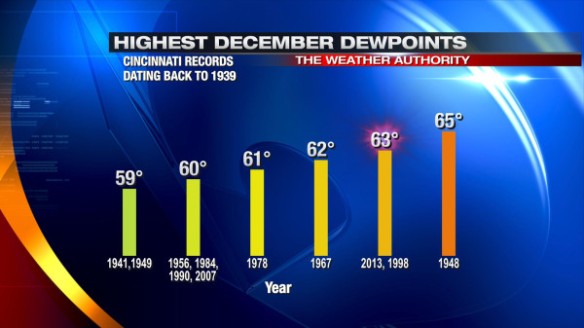
A surplus of low-level moisture and a surge in warmth helped to support the widespread rain and storms that passed through the Tri-State Friday, Saturday, and Sunday. Since reliable hourly weather records began in Cincinnati in 1939, the highest dewpoint recorded in Cincinnati during the month of December was 65°. At the Cincinnati/Northern Kentucky International Airport, the dewpoint hit 63° several times Saturday. A dewpoint of 63° is abnormally high for Cincinnati in December and almost tied the dewpoint “record” set in 1948:

dec22-decdewpoints

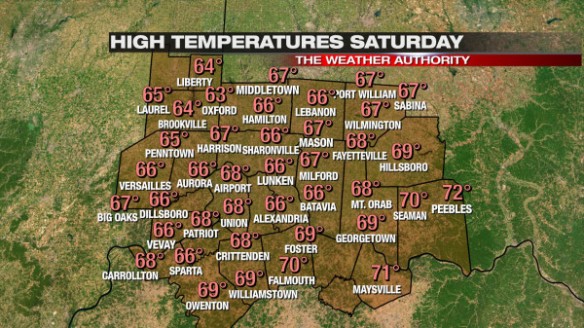
Temperatures were also well above average, helping to create some instability. Our high of 68° was 1° from matching the record high of 69° set in 1967. Here’s a map of Tri-State high temperatures Saturday:

dec22-sathighs

Oddly enough, the weather setup in 1967 (when the record high was set) was similar to Saturday’s. After a dry morning and a rapid warm up from the 40s into the 60s on December 21, 1967, a cold front came through that unloaded 1.06″ of rain; the following day featured a low in the 20s, a high in the 40s, and some flurries in the morning. Similar  to those days in 1967, we’ll start tomorrow around 30°, finish in the upper 30s, and have some flurries and sprinkles in the morning.

In my opinion, what make Saturday unique – or perhaps historic in some ways – was the presence of severe thunderstorms. From the time the National Weather Service Forecast Office in Wilmington first started issuing warnings for the Tri-State in 1995 to the start of this month, only 4 Severe Thunderstorm Warnings had been issued in the Tri-State during the month of December; all of them were issued on December 1, 2006 when a line of storms traversed the Ohio Valley. In this same time period, no Tornado Warnings and only 3 Flash Flood Warnings were issued in the Tri-State.

Last night, 8 Severe Thunderstorm Warnings, 6 Flash Flood Warnings, and a Tornado Warning were issued in the Tri-State. In other words, more Severe Thunderstorm, Tornado, and Flash Flood Warnings were issued in the Tri-State last tonight (both individually and added together) than in all December days from 1995 to 2012 combined.

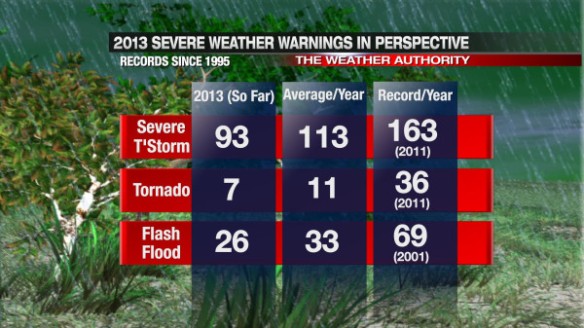
After a very quiet spring and summer severe weather season, here are the latest warning totals for 2013 compared to the yearly records and averages:

dec22-warningtable

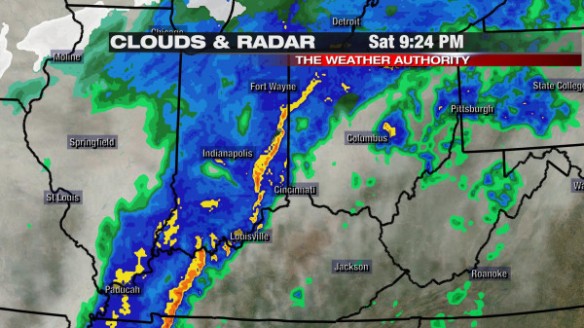
Saturday’s severe weather event and the severe weather event that hit in the Tri-State on Halloween were unique in that damaging straight-line winds were caused more by showers than thunderstorms. Radar data showed a well-defined, narrow line of showers and isolated thunderstorms entering the Tri-State just before 9:30pm last night:

dec22-924pmradar

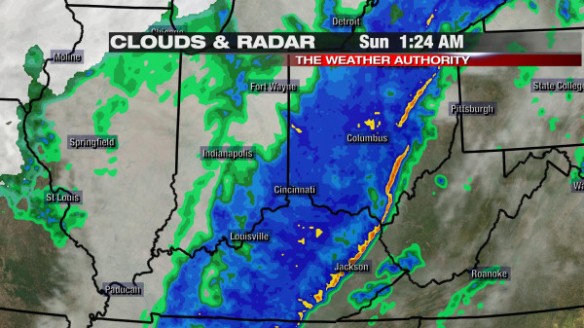
…and east of the Tri-State around 1:30am:

dec22-124amradar

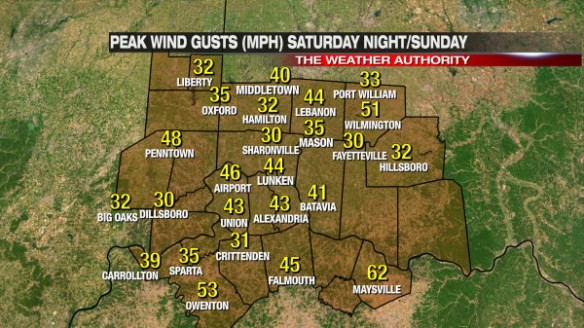
Showers and storms were moving quickly (50+ mph) last night, and their speed and outflow alone was enough to cause damage. In real-time, there was no strong indication that warnings were verifying. The peak wind gust map from last night (including observations from local airport and weather stations) suggests there was little to no damage (60+ mph winds are usually needed to cause damage):

dec22-peakgustmap

When the sun came up and flooding concerns eased some overnight, people found more damage, but most that got damage just had trees or limbs down.

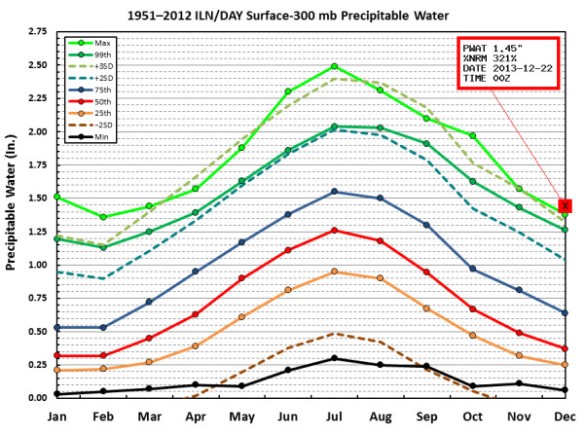
When you get off the beaten path, even more complex weather records were set on Saturday. The precipitable water (atmospheric water content) value measured by Saturday night’s weather balloon launched at the NWS Wilmington around 7pm set a December record (records began in 1948). In the graphic below, the green line represents the monthly records, and the “X” shows last night’s value broke the December record (and was 321% of the December average):

dec22-pwgraph

Regardless of how you measure Saturday’s weather, it’s hard to say it wasn’t unusual, atypical, or just plain weird. As a meteorologist who has worked for several years in the Ohio Valley, you never quite know exactly what you’ll see any given year. After a record number of tornadoes last year, this year has been quieter than usual and with nearly all of our severe weather coming late in the year.

Thankfully, the next few days look quiet with some bouts of flurries and near or below average warmth.

This Weekend’s Weather Setup And Why I Don’t Like It

There are several things about this weekend’s weather setup that are troubling. First, waves of heavy rain are forecast this weekend, this after a couple days of snow melting to saturate the ground. Second, there is a threat for strong and severe storms this weekend in the Ohio Valley; after a quiet spring and summer, this fall and now winter has been very stormy. Severe weather events in the Tri-State during the month of December are very rare.

Several disturbances will affect the Ohio Valley Friday through Sunday; the thinking on the strength and timing of each has not really changed in the last 24 hours.

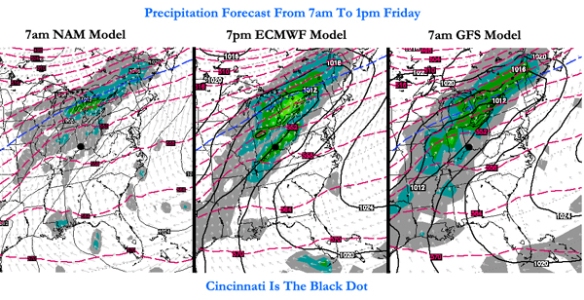
The latest computer forecast model runs all have widespread light to moderate rain in the Tri-State Friday morning and afternoon:

fridaymodels

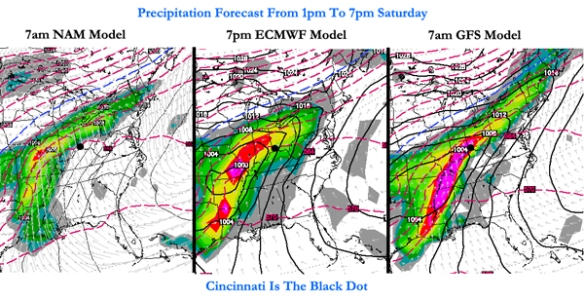
This initial round of rain is not going to cause widespread problems, but it will help to saturate the ground. Models have widespread moderate to heavy rain moving in Saturday afternoon and evening:

saturdaymodels

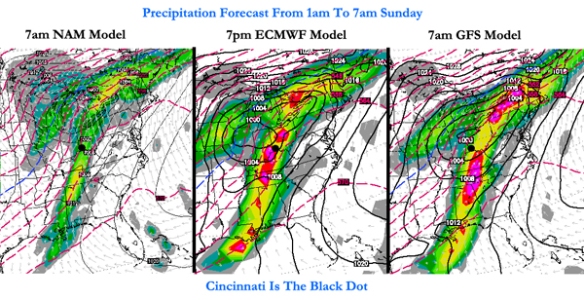
Moderate to heavy rain continues into early Sunday with the center of low pressure to the northwest of Cincinnati:

sundaymodels

Given the dewpoints in the 50s and 60s, temperatures in the 50s and 60s, the positioning of the jet stream, and modest instability, thunderstorms are forecast from Saturday afternoon through Sunday. In addition to the threat of thunderstorms, there is also support for strong and severe storms in the Tri-State Saturday night and early Sunday. Being south of the warm front and east of the cold front puts us in the “warm sector,” or the warm, moisture-rich airmass that will support storms. Specifically, there is a concern for damaging straight-line winds early Sunday morning.

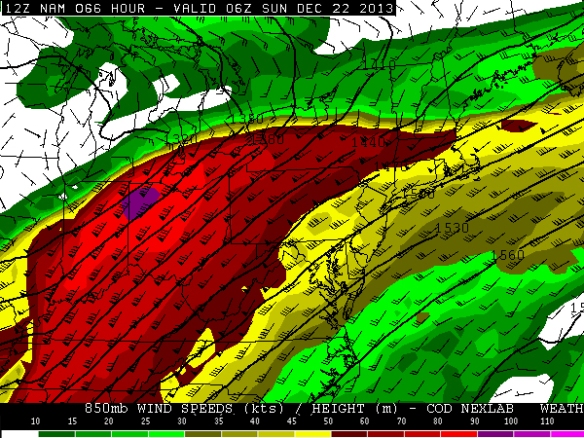
The latest NAM model run has 60-100+ mph winds 5,000 feet above the Ohio Valley at 1am Sunday:

nam850

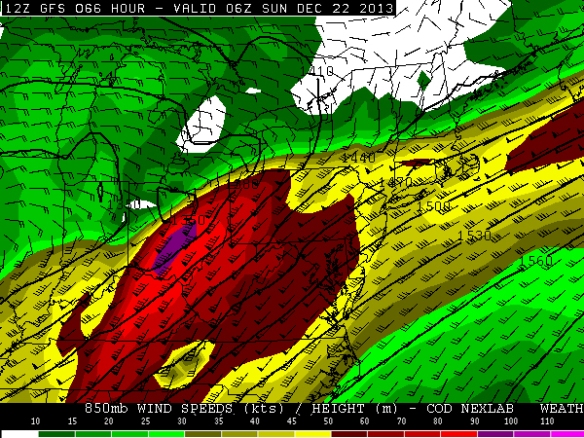
This morning’s GFS model run has the strongest winds positioned differently but just as strong early Sunday morning:

gfs850

This fast moving zone of winds just above the ground is called the low-level jet. It typically strengthens before and during severe weather events, but these speeds are abnormally strong for late December. Mathematically speaking, these wind speeds are 3-5 standard deviations above average for this time of the year. Simply put, these wind speeds are rare to very rare for December. Winds 5,000 feet above the ground are often transferred to the ground – in part or whole – when heavy rain is falling. With moderate to heavy rain forecast as these winds are coming through, there is a concern for severe winds Saturday night and early Sunday morning.

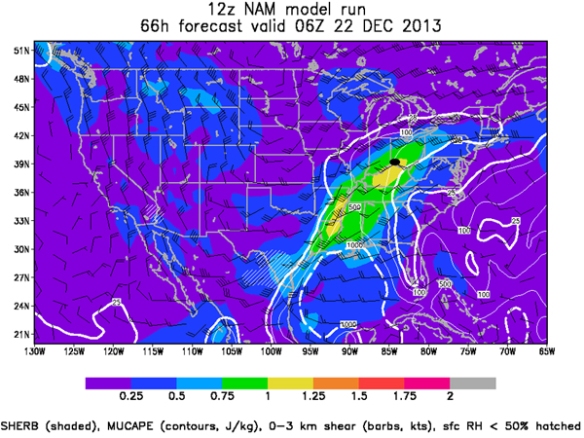
While instability can often have a big influence on the chance for thunderstorms, it isn’t as important this time of the year. If thunderstorms are likely (which they are Saturday night and Sunday), the SHERB parameter or index can be very helpful to a meteorologist in the colder months when looking a threat for severe weather. The SHERB parameter is helpful for getting a handle on a severe weather threat in the colder months because it focuses on temperature changes near the ground, lift in the atmosphere, and wind shear instead of instability (instability tends to be low in the winter even when we get severe weather).

Why is SHERB important? Unlike summer severe weather events which are driven by high instability and less of everything else, cold season events are driven by everything else and not often by instability. SHERB is a special blend of “everything else” that is important when gauging a severe weather threat…which makes it valuable when we don’t have summer-like heat and humidity. When SHERB values are high and the chance for rain and storms is high, severe weather is often a concern.

SHREB values on Saturday night and early Sunday morning are elevated in the Ohio Valley. This morning’s NAM model has SHREB values that are high (yellow) and support a Tri-State severe weather threat (Cincinnati is the black dot):

sherb

SHERB tells us that instability isn’t really necessarily to get rough storms Saturday night and early Sunday. Any instability will only aggravate the atmosphere more than it is already primed.

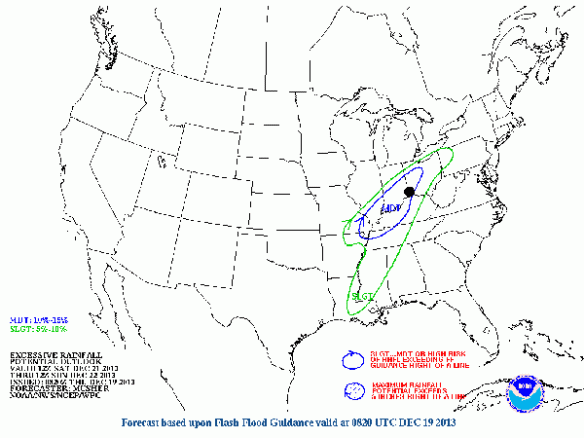
Plus, there is a threat for heavy rain and flooding this weekend. The Weather Prediction Center has already placed the Tri-State in a MODERATE risk for excessive rainfall from 7am Saturday to 7am Sunday:

hpc

A Flood WATCH is likely coming for most if not all of the Tri-State later today. It will likely be in effect most if not all of Saturday and Sunday.

Here is how much rainfall various models are forecasting from 7am Friday to 7am Monday:

NAM         1.72″
ECMWF: 1.94″
GFS          5.40″

The GFS is clearly overdone, but 1-3″+ of rainfall is likely Friday, Saturday, and Sunday.

Be prepared for flooding and storms this weekend!

Severe Threat For The Tri-State Sunday And Sunday Night

Models continue to suggest a significant threat for thunderstorms, strong storms, and severe storms in the Tri-State on Sunday and Sunday night. Since we are still a couple of days out, the exact timing and positioning of this system is still uncertain. There are, however, a lot of similarities in the weather setup for Sunday compared to Halloween night.

Why are we so concerned about the threat for severe weather this weekend? Simply put, the jet stream is strong, it will be warm, it will be rather humid, and there will be a lot of wind shear (changing of the speed or direction of the wind going away from the ground). Notice how I didn’t highlight instability; in the colder months of the year, severe weather events in the Tri-State often happen with little or no instability. The strength of the jet stream, temperatures, lift, and shear are much more important this time of year.

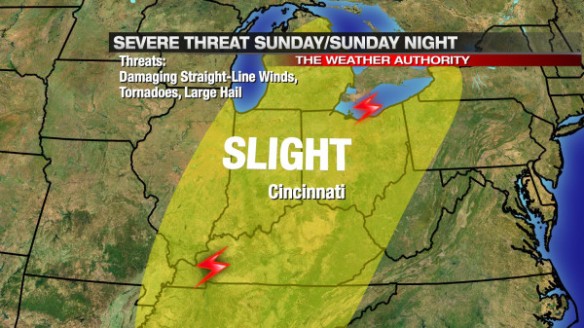
The Storm Prediction Center has placed the entire Tri-State under a SLIGHT risk for severe storms Sunday and Sunday night:

nov15-spcmap

While damaging straight-line winds will be the primary severe weather threat, tornadoes and large hail are still secondary threat with the strongest showers and storms that develop on Sunday and Sunday night. In the forecast model world, there is a consistent signal that that storms will develop to the west and southwest of Cincinnati and move east to northeast with time; this thinking would suggest the main tornado threat will be focused outside of the Tri-State (where storms develop), but – given the amount of wind shear – tornadoes will be possible as showers and storms gradually coalesce into line later in the day and evening.

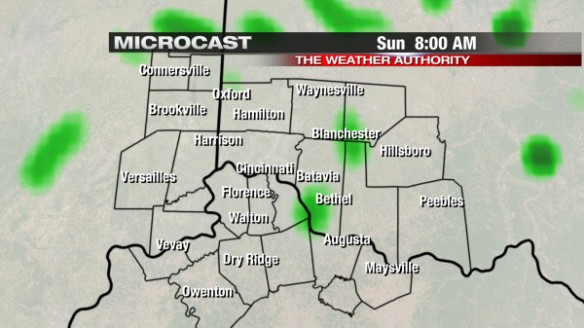
While it is just one model, Microcast suggests the main threat for severe weather will come Sunday evening. Microcast has a relatively low coverage of showers and thunderstorms Sunday morning at 8am:

nov15-mc8amsun

Any sun that we get early Sunday will work against us, increase the amount of instability showers and storms will have to work with Sunday afternoon and evening. In this particular setup, sun and instability is not necessarily needed to get strong and severe storms; any sun we get will only bring up the risk for storms.

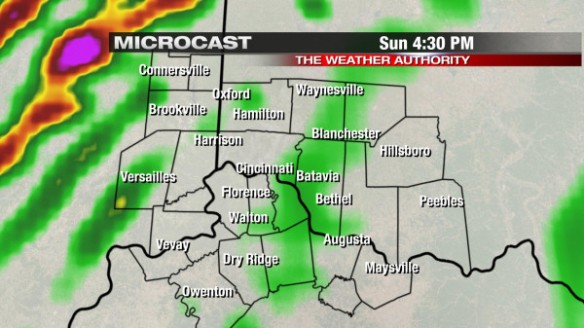
Microcast suggests the coverage and intensity of showers and storms will start ramping up during the afternoon and evening, especially west of Cincinnati. Microcast has most of the storms in the Ohio Valley west of the Tri-State at 4:30pm:

nov15-mc430pm

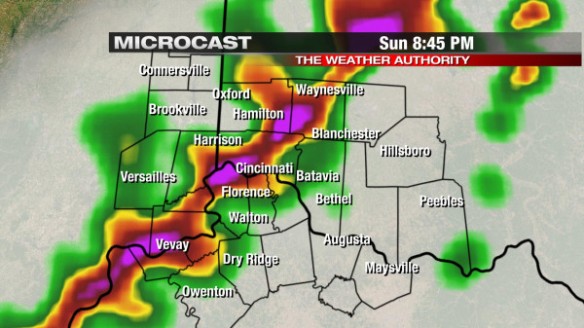
Microcast continues to ramp up the coverage of showers and storms Sunday evening. By early to mid-evening, showers and storms are blowing through the heart of the Ohio Valley:

nov15-mc845pm

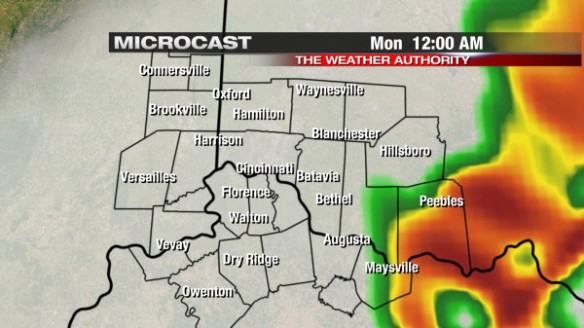
By midnight, showers and thunderstorms will be diminishing or ending in the Tri-State, as Microcast shows:

nov15-mc12ammon

Again, Microcast is just one model. Other models are more aggressive with the chance for storms in the afternoon. Know that – for now – the severe weather window begins in the afternoon and continues through the evening.

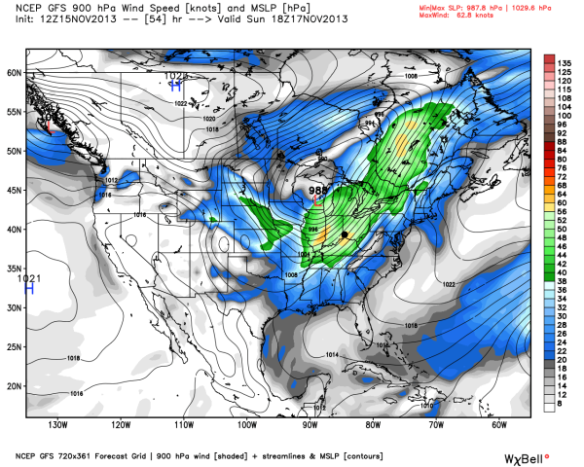
Why are damaging winds the main threat? Because the low-level jet will be very strong Sunday afternoon and evening. The low-level jet is a stream of air about 5,000 above the ground that usually strengthens ahead of strong areas of low pressure. These winds above the ground can easily be pushed down to the surface with heavy rain or in downdrafts (during showers and thunderstorms). Notice the strength of the low-level jet over the Ohio Valley by 1pm Sunday according to the GFS model (Cincinnati is labeled with a black dot):

nov15-gfswind

Winds in green are over 40mph, and winds in yellow are severe (over 58mph). These winds aloft aren’t necessarily what we will see at the ground, but heavy rain and storms will help to bring these winds above the ground down to the Earth’s surface.

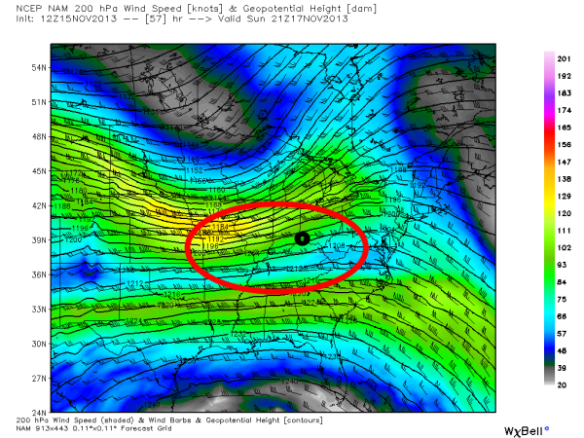
There are still significant uncertainties about the positioning of the jet stream on Sunday; this is a problem, since the positioning and strength of the jet stream often tells us where the strongest rising motion will be in the atmosphere (and thus the strongest showers and storms).

This morning’s NAM model has the strongest divergence (spreading) of air aloft in the red circle by late Sunday afternoon (Cincinnati is in the black circle):

nov15-namjet

Divergence aloft tends to promote stronger updrafts and, thus, stronger showers and storms. Where their are uncertainties about exactly placement of the jet stream(s), we are in the zone of strong lift, and this means we have more than enough upper-level support for severe weather Sunday and Sunday night.

While instability can often have a big influence on the chance for thunderstorms, it isn’t as important this time of the year. If thunderstorms are likely (which they are Sunday), the SHREB parameter or index can be very helpful to a meteorologist in the colder months when looking a threat for severe weather. The SHREB parameter is helpful for getting a handle on a severe weather threat in the colder months because it focuses on temperature changes near the ground, lift in the atmosphere, and wind shear instead of instability (instability tends to be low in the winter even when we get severe weather).

Why is SHERB important? Unlike summer severe weather events which are driven by high instability and less of everything else, cold season events are driven by everything else and not often by instability. SHERB is a special blend of “everything else” that is important when gauging a severe weather threat…which makes it valuable when we don’t have summer-like heat and humidity. When SHERB values are high and the chance for rain and storms is high, severe weather is often a concern.

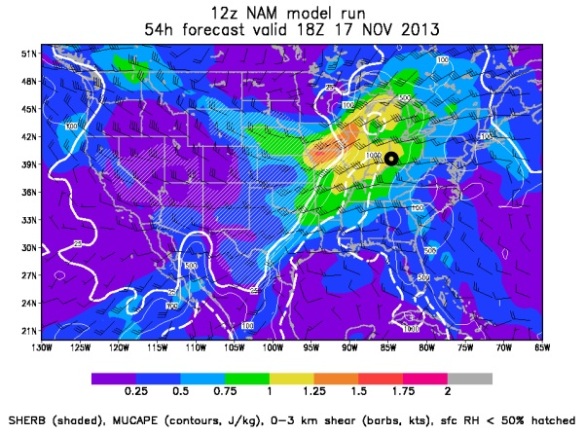
SHREB values on Sunday and Sunday night are elevated in the Ohio Valley. This morning’s NAM model is very aggressive with Sunday’s severe threat (probably too aggressive), but it has SHREB values that are high (yellow, orange, and red) and support a Tri-State severe weather threat (Cincinnati is the black circle):

nov15-shreb

The ECMWF and GFS models suggest SHREB values will be lower during Sunday’s event, but still high enough to support severe weather.

SHREB tells us that instability isn’t really necessarily to get rough storms Sunday. Instability (sunshine) will only aggravate the atmosphere more than it is already primed.

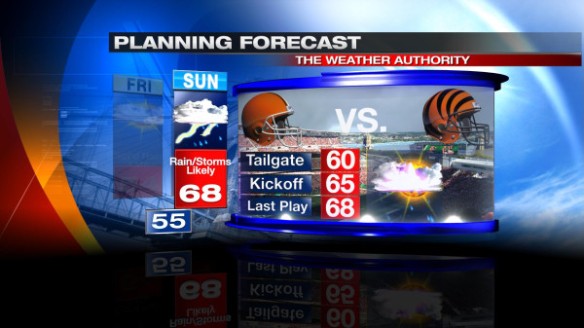
But this discussion is more than just a chance for severe weather on a Sunday; this is a discussion of severe weather on a Sunday where the Bengals are playing and people are outside tailgating and watching the game. It’s much easier to go inside or take cover at home than it is in a parking lot or stadium. I am cautiously optimistic that the Bengals will be actively following the weather Sunday, but you should be prepared for strong and storms Sunday afternoon and evening – especially during and after the game. Ultimately, your safety is up to you. Whether you’re tailgating, going to the game, staying out after the game, or all of the above, you should have a plan to seek shelter if needed. Here is our latest Bengals forecast:

nov15-bengals

The warmth is welcome by most, but don’t write off the wind or chance for storms.

Now is the time to prepare! Don’t be caught off guard in the stands or tailgating on Sunday. While the timing and other specifics of this event are still uncertain, the threat for damaging straight-line winds, tornadoes, and large hail are all on play Sunday and Sunday night.

I’m working this weekend, and I’ll update you as new model runs complete!