Historical Odds Of A White Christmas In Cincinnati

Snow is common during December in Cincinnati, but the odds of getting snow on the ground Christmas morning is lower than you might think.

A “White Christmas” is a Christmas Day where the snow depth at 7am is 1″ or higher. This snowfall amount is rounded to the nearest inch in official weather records. For example, a 7am snow depth of 0.5″ would be recorded as 1″ officially, and a snow depth at 7am of 0.4″ would be recorded as a “trace” officially. With this rounding considered, a 7am snow depth of 0.5″ or more on Christmas Day would mean a “White Christmas.”

7am snow depth records for Cincinnati have been taken since 1916 with one year (1947) missing. Based on weather records, it is hard to say if December 25, 1947 was a White Christmas. The official high temperature that day was 31°, and the low temperature that day was 14°. 0.03″ of precipitation was recorded at the Cincinnati/Northern Kentucky International Airport that day, but the 7am snow depth and the snowfall total for that day are missing. It is highly likely that the precipitation that fell that day was snow or nearly all snow. A 10-to-1 snow-to-liquid ratio would mean 0.3″ of snow fell that day. The snow-to-liquid ratio that day, however, is unknown.

At the time, official records were taken at the International Airport. However, weather records taken at the National Weather Bureau office in downtown Cincinnati suggest 1947 may have had a White Christmas:

dec21-wsorecords

At 7:30pm on December 25th, 1947, 0.5″ of snow was reported on the ground in downtown Cincinnati. 0.8″ fell that day, but it is unclear whether the 0.5″ of snow on the ground at 7:30pm that day was also on the ground at 7am Christmas Day. Regardless of what happened at the Weather Bureau office, it is not part of the official weather record for Cincinnati.

If you throw out Christmas Day 1947, there have been 16 White Christmases in Cincinnati since 1916:

dec21-whitexmaslist

16 White Christmases in 96 years worth of records shows there is, historically, a 17% chance of a White Christmas in the Queen City:

dec21-whitexmasmathnew

If you say 1947 was a White Christmas, there is, historically, a 18% chance of a White Christmas in Cincinnati:

dec21-whitexmasmathcounting1947

The math gets even more complicated if you include Christmas Day of 1992, which is the only year since 1916 where there was no snow on the ground at 7am but 1″ or more fell on that day after 7am. You could make an argument that 1992 had a White Christmas; if you believe it counts, the historical odds go up to 19%.

These historical odds are long-term. In the last 10 years, there have been 2 White Christmases in Cincinnati:

dec21-recentsnowdepths

The long-term average and the last 10 years suggest that a White Christmas happens in Cincinnati about once every 5 years. Back to 1916, the highest 7am snow depth recorded in Cincinnati on Christmas Day was in 2004 (9″).

Historically, the odds of a White Christmas Eve are about the same, but the years with a White Christmas and White Christmas Eve don’t always match up. Here is the list of years with 1″ or more of snow on the ground on Christmas Eve in Cincinnati:

dec21-whitexmasevelist

Weather records for Cincinnati are messy, but history suggests there is a 15 to 20% chance of a White Christmas any given year in the Queen City. We will know more about the likelihood of a White Christmas this year in the hours and days to come.

Cold Air, Snow Chances Coming To The Tri-State Soon

October and November are transition months in the Tri-State. The first frost and freeze of the season almost always occur in at some point in these two months. The first flakes of the season often fall in October or November. We’ve already had our first frost, freeze, and flakes. The next item on the list is the first accumulating snow of the season; the opportunity for accumulating snow comes this weekend.

To get snow, we need cold; we will have plenty of that later this week. Despite what you may have heard, the “polar vortex” is not coming behind Tuesday’s front. The polar vortex is an upper-level feature; it lives in the stratosphere (the layer of the atmosphere above the one we live in) and occasionally dips down into the upper troposphere (the layer of the atmosphere we live in and where weather occurs). Sunday morning’s European (ECMWF) Ensemble model mean places the polar vortex (labeled as “PV”) near the North Pole, well away from Cincinnati (the purple dot):

nov9-pv

While this drop in temperatures later this week is being called everything under the stars, the reality is that the jet stream is just headed south. When you’re north of the jet stream, it’s relatively cold; when you’re south of the jet stream, it’s relatively warm. The jet stream is a fast moving current of air 35,000-45,000 feet above the ground that is trying to restore a balance in the atmosphere by bringing cold air south and warm air north.

I believe we’ll reach into the upper 50s and lower 60s both Monday and Tuesday afternoon with winds sustained out of the southwest. Tuesday and Tuesday night will be the transition period in the week ahead. A cold front moving through the Ohio Valley will push temperatures from the 60s Tuesday afternoon into the 30s by Wednesday morning. Some models give us scattered rain showers Tuesday, while others give us a well-defined line of rain. At this point, I believe most will see light rain Tuesday and Tuesday evening, but there is some uncertainty on the coverage of rain.

The cold air pouring into the Ohio Valley, Mississippi Valley, and Great Lakes later this week will not warm much as it nears us thanks to a fresh snowpack being put down ahead of it from the Dakotas to the Upper Peninsula of Michigan:

nov9-rpmsnow

Areas in the white and blue shades will see anywhere from a few inches to a couple of feet of snow of the ground by Wednesday afternoon. Without this snowpack, high and low temperatures in Cincinnati later this week would be warmer.

Highs are forecast to be in the mid to upper 30s Thursday, Friday, and Saturday. While this is abnormally cold for mid-November, it is not unprecedented. Here are the lowest high temperatures recorded in Cincinnati on November 12 (Wednesday) since 1870:

nov9-12threcords

The record lowest high temperature for November 13 (Thursday) is 29°, and I don’t foresee that getting broken or tied:

nov9-13threcords

Since 1870, high temperatures have only hit the low 30s a couple of years in Cincinnati on November 14th (Friday):

nov9-14threcords

It appears unlikely that a new minimum high temperature record will be set on November 15th (Friday):

nov9-15threcords

While it will be very cold, all of these graphs suggest record-breaking cold is unlikely later this week.

After some flurries Thursday, our attention returns to a system developing late in the upcoming weekend. At long range, it is not uncommon for models to disagree on the timing and strength of systems; this upcoming event is no exception.

Sunday morning’s GFS (American) and ECMWF (European) models disagree on the coverage of precipitation when the disturbance is moving out of the Rockies and into the Plains. The GFS model keeps much of the Plains dry, while the ECMWF has precipitation falling from Iowa to the Gulf Coast (Cincinnati is the purple dot):

nov9-gfsec7pmsaturday

Any errors in the forecast model at this time will likely degrade the quality of the forecast beyond this time. As an example: Sunday morning’s GFS and ECMWF models disagree on if precipitation will be falling in Cincinnati at 1pm Sunday:

nov9-gfsec1pmsunday

The forecast gets even more complex into next Monday. Sunday morning’s GFS models says precipitation will be to our east, while the ECMWF model still has precipitation in the area:

nov9-gfsec7ammonday

Clearly, there is uncertainty in the strength, timing, and positioning of this system. If precipitation falls on Sunday or Monday, models are in agreement that this preicpitation will likely be snow given temperatures in the 30s near the ground and in the teens and 20s just a few thousand feet above the ground. Confidence in the overall forecast will rise and specifics will be resolved with time.

Here is a summary of forecast uncertainties in the week ahead:

nov9-uncertainities

While nearly all of the uncertainty in the week ahead deals with the area of low pressure a few days from now, there is a high confidence that the following will happen between now and next Monday:

nov9-knowns


Cold Coming Next Week, But Not Worth Overhyping

Like every blast of cold air in recent winters, there is already a big social media buzz about temperatures next week. Yes, it will be cold, but what comes next week is not unprecedented for early to mid-November.

In the longer range, I like to use ensemble forecast models to gauge the strength and positioning of cold. Ensemble forecast models are models made up of smaller models with the initial conditions changed slightly. All of these smaller models are run and may or may not produce slightly different results. A low spread in the solutions of an ensemble forecast model suggests a higher confidence that a certain weather event or pattern will happen; a high spread suggests a lower confidence forecast. In addition to looking at one ensemble model, a meteorologist can use other ensemble models and compare them to measure the confidence of a forecast. Ensemble models are often more reliable than other forecast models – especially a few days to a couple of weeks into the future – because outlier members of the ensemble models are easy to spot and can be discounted if needed.

What does the average (mean) of these ensemble models say will happen by Sunday morning?

7amsunday

This morning’s GFS (American) ensemble mean suggests temperatures roughly 5,000′ above the ground will be in the low 30s (-1°C) at 7am on Sunday morning, while the ECMWF (European) and CMC (Canadian) ensemble mean suggests temperatures a few thousand feet above the ground will be in the low to mid 20s (-3° to -6°C). Forecasting temperatures just above the ground are often easier to forecast than close to the ground due to uneven heating of the ground and terrain. Clearly, there is a large spread on what the temperature 5,000′ above the ground will be at 7am Sunday; this suggests there is limited confidence in the temperature forecast this weekend. Current thinking is that surface temperatures will be in the upper 20s and lower 30s early Sunday morning, but this forecast may change depending on the trend of models.

Before we go forward, know that errors in the each of the models will be compounded with time. A large bust on a temperature forecast from a model this weekend will likely mean a large (or even larger) bust on the temperature forecast for next week.

What does the mean of the ensemble models say will happen by next Thursday morning?

7amthursday

There is reasonably good consensus with Wednesday morning’s ensemble model runs that temperatures 5,000′ over Cincinnati will be around -9°C (16° F). Accounting for the fact that temperatures are usually colder aloft than at the ground, cloud cover, and the rate of temperature changes near the ground, these maps support low temperatures in the 20s. Temperatures aloft rise a couple of degrees during the day Thursday, but there is some uncertainty in the cloud cover and precipitation coverage (if any at all). All things considered, highs will likely be in the 30s and/or 40s Thursday.

Since 1870, the high temperature in Cincinnati hasn’t hit 40° 12 years on November 12th, 11 years on November 13th, and 19 years on November 14th. In other words, the historical odds of not making it to 40° on any one of these days is 8 to 13%.

As a mentioned above, there are uncertainties in cloud cover and precipitation timing next week. Look at the differences in the upper-level flow for the second half of next week. The GFS Ensemble has a ridge in the western United States and a trough in the eastern United States, but the positioning of the trough looks to be too far east and likely moving through the U.S. too quickly:

gfsulf

The ECMWF Ensemble has the trough and the ridge both farther west by 7am Friday, but likely doesn’t have the ridge strong enough in the western United States (which I’ll explain why below):

ecmwfulf

I think the CMC (Canadian) Ensemble has the right idea: a strong ridge in the western United States, a strong trough in the Pacific Ocean, and a strong trough in the eastern United States:

cmculf

Why do I the think the ECMWF Ensemble ridge in the western United States is too weak? Because tropical activity in the Pacific suggests strong ridges and troughs near and over North America.

Meet the leftovers of Typoon Nuri in the Pacific Ocean (satellite shot as of 9:30pm ET Wednesday). Nuri is the mass of clouds (bright colors) the upper-right hand part of this image:

nurisat

Note southeastern Asia on the left side of this image. Nuri will be a troublemaker. The GFS ensemble suggests Nuri is headed northeast:

nuri

It is forecast to bomb out over the northern Pacific Ocean later this week. The surface low of “once Nuri” will die out next week, but the upper-level low of this system will likely spin over southern Alaska or in the northern Pacific Ocean, as the ECMWF model shows by next Wednesday (pointed out with the arrow, Cincinnati is the red dot):

pac

This area of low pressure positioned where it is supports a ridge of high pressure just to the east of it, and a trough to the east of the ridge. This is very similar to what the CMC Ensemble above shows. The exact track and fate of this Pacific low can impact how cold we get next week.

For now, know that next week will be cold, but highs in the 30s and 40s are not uncommon in mid-November. Remember, we had a high of only 42° in Cincinnati this past Saturday.

The First Snowfall Of The Season In Cincinnati

A trace of snowfall was recorded at the Cincinnati/Northern Kentucky International Airport on Saturday. A trace of snowfall in the records means snowflakes fell from the sky, but less than 0.1″ of snowfall accumulated (if any at all).

The first snowflakes of the fall and/or winter in Cincinnati usually fall in late October or November. On the first day that snowflakes fell during the fall and/or winter in Cincinnati, only 21 of the last 100 years reported snowfall accumulation (0.1″ or more) on that day; in other words, the first snowflakes of the season usually don’t stick because the ground is too warm.

Here are the average, earliest, and latest snowfall dates with measurable snowfall and any snow in the Queen City…

nov1-firstdates

Note measurable snowfall records go back to 1893, but I have limited the “any snow” (at least a trace) record back to 1915. It is also worth noting that official snowfall records for Cincinnati have been kept in three different places since 1893:

-1893-1915: Downtown Cincinnati at the National Weather Service/Bureau office
-1915-1947: Abbe Observatory in Clifton
-1947-Present: Cincinnati/Northern Kentucky International Airport

The averages and the range of dates can be helpful, but there are more than two ways to measure the first snowfall of the season. Statistically, the most common ways to measure the “center” of a set of data are involve taking the mean, median, and mode. Simply put, the “mean” is the average, the “median” is the “center” value in the chronological list, and the “mode” is the most common value occurring in the list. For example, here are the mean, median, and mode dates for the date when the first snowflakes fall during the fall/winter in Cincinnati:

nov1-mmmanysnow

Historically, the first measurable snowfall of the season comes 2 to 3 weeks after the first snowflakes of the season fall from the clouds:

nov1-mmmmeasurable

The first day of the fall or winter where 1″ or more of snowfall accumulation occurs in Cincinnati is in usually not far behind the first day of the season with measurable snowfall; sometimes, they are on the same day. Here are the mean, median, and mode for the first day of the fall and/or winter in the Queen City where 1″+ of snowfall accumulates:

nov1-mmm1inch

The first day of 1″+ of snowfall accumulation in Cincinnati has come as early in the fall as October 19 (1989, 5″) and as late as March 5 (2012, 1.5″, two dates after the deadliest tornado outbreak on the Tri-State on record).

Seeing accumulating snowfall earlier than average in the fall does not necessarily mean a snowier than average winter is on the way.

Overall, I believe this upcoming winter will be snowier and colder than average in Cincinnati. Compared to last winter, I believe winter 2014-2015 will be colder but not as snowy as the winter of 2013-2014.

Everything You Need To Know About Fall Frost In Cincinnati

Low and high temperatures have been above average the last few days in the Queen City, but the latest computer guidance suggests cool, Canadian air will arrive by next weekend. While there is no imminent threat for frost with this next shipment of cool air, the likelihood of frost will rapidly increase over the next month.

When forecasting frost, a meteorologist often looks for a very light or calm wind, a mostly clear to clear sky, and temperatures dropping into into or below the upper 30s early in the morning. Frost can form with air temperatures dropping into the mid and upper 30s; temperatures to or below 32° are not needed for frost. Why? The answer to this has to do with how temperatures are measured.

The piece of equipment used to measure weather conditions at most airports in this country – called an Automated Surface Observing System or ASOS – measures the temperature 2 meters above the ground.Here is a picture of an ASOS and where the temperature sensor is located:

sep28-asos

Because relatively cold air sinks and warm air rises, temperatures below this sensor are always colder than temperatures at the sensor. For example, the sensor may measure at air temperature of 36°, but the temperature at the ground may be 32° or lower. Patchy frost can form at the ground when the temperature at the sensor drops to 38°.

The first frost of the fall in Cincinnati almost always occurs in October; while the exact temperature where frost occurs can vary, using a temperature of 36° or 38° yields roughly the same dates on average:

sep28-fallfrost

The first frost has occurred as early as mid September and as late as late November.

Frost does not necessarily mean the end of the growing season, but frost can easily kill plants – especially if they are sensitive to cold. A freeze or hard freeze signals the end of the growing season for all seasonal vegetation. On average, the first freeze or hard freeze of the fall in Cincinnati occurs in late October or early November:

sep28-fallfreeze

Note that a freeze has occurred as early as late September, and a hard freeze has occurred as early as early October.

The averages and the range of dates can be helpful, but there are more than two ways to measure first fall frost dates. Statistically, the most common ways to measure the “center” of a set of data are involve taking the mean, median, and mode. Simply put, the “mean” is the average, the “median” is the “center” value in the chronological list, and the “mode” is the most common value occurring in the list. For example, if we assume the first fall frost occurs when the temperature (measured 2 meters above the ground) drops to 38°, here are the mean, median, and mode dates for the first fall frost in Cincinnati:

sep28-mmm38

If we assume the first fall frost occurs when the temperature drops to 36°, here are the mean, median, and mode dates for the first fall frost in Cincinnati:

sep28-mmm36

These averages are based on data from 1871 to 2013. What is the mean, median, and mode date for our first freeze?

sep28-mmm32

The mean, median, and mode dates for the first hard freeze in Cincinnati are:

sep28-mmm28

Historically and statistically, if you assume the first fall frost occurs when the temperature drops to 38°, there’s a 75% chance we get our first frost by October 15th. The date slides about one week later if you use 36° as a temperature:

sep28-percentile

At this point, the cold blast coming in the wake of Friday’s cold front does not look to bring widespread frost to the Tri-State. Longer-range computer guidance suggests temperatures will warm back near or above average by the middle part of next week. Beyond the first full week of October, guidance suggests waves of cold air will gradually push southeast from southern Canada. While the first of these series of cold blasts may not bring frost, reinforcing shots of cold, Canadian air in October suggests our first fall frost will come very close the historical average date.

My Take On Upcoming SPC Severe Weather Risk Changes

For years (really decades), the Storm Prediction Center has issued severe weather risks for the contiguous United States using “slight,” “moderate,” and “high” risk categories. Areas of the country that are most likely to see severe weather are typically placed under a “slight” risk for severe storms at least several times a year, a “moderate” risk up to a couple of times per year, and a “high” risk once every year or two when a major severe weather outbreak is expected.

But all of this is about to change. The 3-categories currently used to classify severe weather will soon expand to 5-categories.

In this interview, Greg Carbin with the Storm Prediction Center says “in the modern era, with the Internet, anybody can look at these [severe threat] graphics. So it’s our responsibility to convey that risk information in a way that’s a little easier to understand for the lay person as opposed to the expert. […] What we are hoping to do with these categories is convey that risk with meaningful words, colors, and numbers.”

What does this change look like? Here’s a breakdown of what the severe weather risk categories are now and what they will be beginning October 22nd:

aug17-spc-oldnewcategories

In simple terms, the “moderate” and “high” risk categories really won’t be changing this fall, and the current “slight” risk category will be broken down into 3 different categories (marginal, slight, and enhanced). Technically, the “marginal” risk will be a new category just under the current “slight” risk category.

Higher-end risks will still be higher-end risks. Late in the morning of March 2nd, 2012, the Ohio Valley was covered with a “moderate” to “high” risk for severe weather:

aug17-spc-march2old

Had this same severe weather outlook been issued using the 5-category severe weather outlook coming this fall, the risk for severe weather in the heart of Ohio Valley would have been the same:

aug17-spc-march2new

The risk for severe weather would have been labeled differently for the northern Indiana, northern Ohio, and parts of the Tennessee Valley.

The changes from SPC were really made to break down lower-end severe weather threats more. Last Tuesday morning, a “slight” risk for severe storms was issued for much of New England:

aug17-spc-tuesdayold

Had this same outlook been issued using 5 severe weather categories, a “marginal” risk for severe storms would have surrounded the “slight” risk from central New England through the Carolinas:

aug17-spc-tuesdaynew

If you’re confused with all of the changes, you’re not alone. If you’re confused by the current outlook categories, I understand that, too. Here’s the probability table (based on a severe weather report occurring within 25 miles of a point) used by SPC forecasters to draw the severe weather threat for the current day:

aug17-spc-currentday1
If you think that’s messy, here’s the probability table SPC forecasters will use to issue severe weather outlooks beginning October 22nd:

aug17-spc-futureday1

There are different tables for days 2 and 3 of the forecast. Making these forecasts is a challenge given model uncertainties and forecast time constraints. Creating these outlooks is not an easy job.

Why are the outlooks changing? I’m not entirely sure, and I don’t think the public does either.

I’m not so sure a change is needed here. More importantly, I’m not so sure the general public is familiar with and/or understands the current outlook categories and knows what the outlook categories mean. Changing what people don’t know by heart will likely come with a sense of confusion and questions about why there was a change.

Ultimately, this change should benefit the public, but I don’t think it will. Introducing new categories does not necessarily mean better understanding. As the tables above show, there is a lot that goes into placing a part of the country under a “slight,” “moderate,” or “high” risk. The public doesn’t understand the math behind each of these risks, but the subjective reasoning behind these risks isn’t common knowledge either. What does a “slight” risk really mean for my family? Honestly, meteorologists may disagree on what it takes for the Storm Prediction Center to issue a “slight” risk for severe weather in a given part of the country. If the lines are blurred or slightly blurred in the meteorological community, how will the public understand?

I don’t know of a meteorologist that knows the probability tables above like the back of his or her hand. I also don’t know of a meteorologist that had a complaint about the current SPC severe weather outlooks. There was no outcry to make a change from the meteorological community (at least not one that I knew of).

So why was there a change? The devil is in the details.

Over the years, there have been a lot of severe weather events that have occurred outside or barely inside of “slight” risk areas. A great example of this is the Evansville/Newburgh/Henderson F3 tornado of November 6, 2005. That area was in a 2% tornado risk area (not high enough alone to warrant a SPC “slight” risk) at 6:59pm on the evening of November 5, 2005. At 2am on November 6, 2005, the F3 tornado began near Henderson, Kentucky and continued through Evansville and Newburgh, Indiana. The tornado killed 25 and injured dozens. Outside of Tornado Warnings issued by NWS Paducah, there was really no suggestion from SPC that a deadly tornado would happen that night. This was a big “oops” moment from the Storm Prediction Center. If the severe hail and wind threat were non-existent, this 2% tornado area would have been in a “marginal” risk for severe storms given the new outlook categories coming this fall, and perhaps some would have paid attention to this tornado risk. Placing areas in a “marginal” severe risk may cause more to take the risk for severe weather seriously, but it may also lead to more “false alarms.” How many “marginal” SPC risks with no damage will it take before people ignore them and/or higher severe weather threats?

The names of the categories also bother me. A “marginal” risk downplays the severe weather risk when the potential is there – be it small – for something significant to happen. Also, how is an “enhanced” risk higher than a “slight” risk for severe storms? More importantly, what are the differences in the risk, and do the category names clearly suggest a difference in the severe weather threat? Did the SPC ask the opinion of social scientists to ensure their category naming convention would resonate with the public?

Discussing the severe weather risk categories with the people of Cincinnati on Fountain Square last week made me realize that people want information as simplified as possible when it comes to storms. Many I spoke with didn’t understand the need for SPC to change the categories. Many didn’t understand what “slight,” “moderate,” and “high” risks for severe weather really meant. Many don’t want to try and understand 5 different severe weather categories. Many just want to know how bad the weather is going to be on any given day or how it will impact their daily routine. These conversations reminded me that simple is better when it comes to discussing weather.

When I think of SPC expanding the severe weather threat categories to five, I think of the Homeland Security Advisory System, which was discontinued in 2011:

HSAS

People never knew what the categories meant, and Secretary of Homeland Security Janet Napolitano said the scale provided “little practical information” when she phased out the scale in 2011. Let’s hope the SPC’s 5-category scale finds more success the DHS’ scale which was uninformative, nondescript, and unhelpful.

Why Tornado Warnings Should Be Issued For Every Tornado

One of the tenets of meteorology is debate. Computer forecast models are consistently at odds with each other about the timing of intensity of weather systems. There are disagreements between meteorologists about the differences between what a mostly sunny, partly cloudy, and partly sunny day looks like. Some weather-related topics, like climate change, are politically charged and constantly challenged.

Of all of the debates I’ve heard, the one that surprises me the most involves when and how the National Weather Service should issue Tornado Warnings. A Tornado Warning is issued when spotters see a tornado, funnel cloud, or rotating wall cloud or when weather radar suggests (or in some cases, confirms) rotation in a thunderstorm is strong enough to produce a tornado. Based on the limitations of technology and the density of the spotter network, many Tornado Warnings do not verify. Radar is a tool designed to track rotation, but radar does not always match what a spotter in the field sees. Some spotter reports are unreliable or misleading, occasionally prompting warnings that did not need to be issued. Even with these considerations, however, the threat of a tornado should not be ignored for any reason. Whether weak or strong, all tornadoes are dangerous.

While there are certain situations and environments which will undoubtedly support and create tornadic thunderstorms, most tornadoes form in far less supportive environments. Most weak tornadoes last on the order of minutes, and larger, upper-level circulations in a tornadic thunderstorm usually don’t last much longer. Many of these weak tornadoes form from thunderstorms in a larger complex of storms. Meteorologists often call these MCSs or QLCSs (mesoscale convective systems or quasi-linear convective systems, respectively). Areas of rotation in a complex of thunderstorms can be hard to see due to the number of storms and given that most tornadoes in a QLCS are short-lived (on the order of minutes).

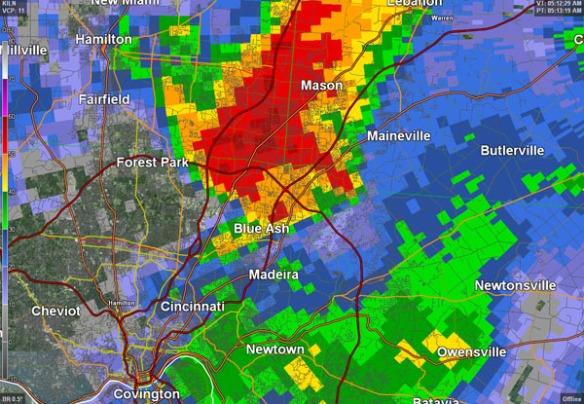
Consider the scenario we had on Halloween night of 2013. Here’s a radar snapshot late in the evening on October 31, 2013:

jun22-qlcs

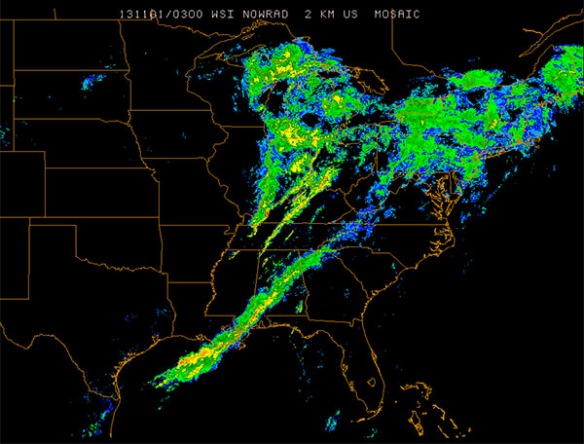
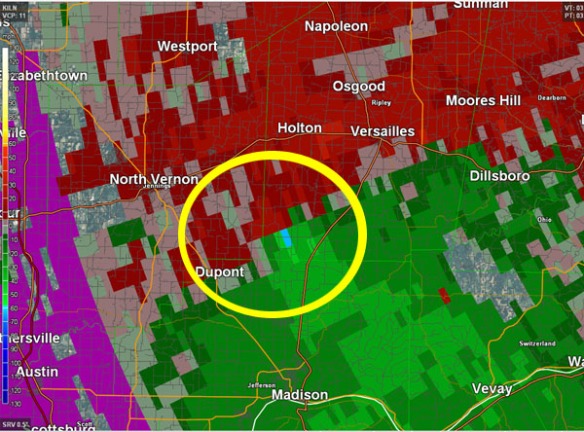
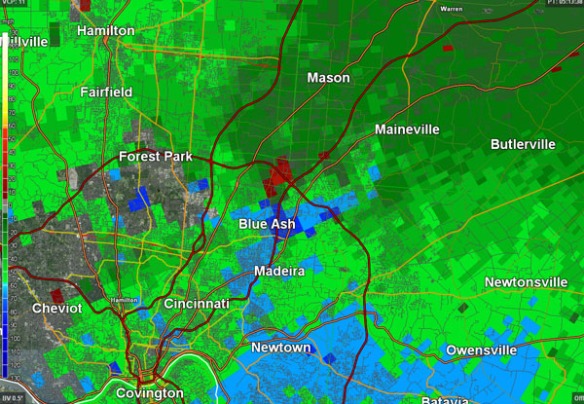
While it is very clear in this imagery that lines of showers and storms look strong and well-defined, using radar imagery some multiple radars is not very helpful for detecting rotation in thunderstorms. Using radial velocity data from a single radar site will be far more helpful for assessing how winds are moving relative to the radar. A snapshot of radial velocity data from the Terminal Doppler Weather Radar near the Dayton International Airport at 10:58pm on October 31, 2013 shows several areas where winds were moving towards and away from the radar in close proximity (circled):

jun22-tdwr

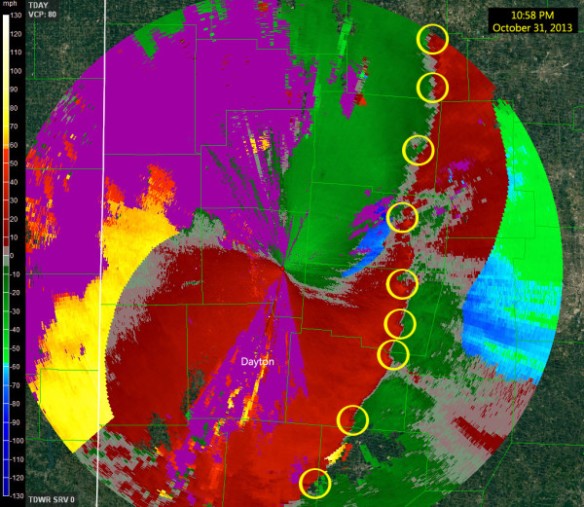
There was adequate support for severe storms and tornadoes (especially weak ones) that night. While instability was not strong, the jet stream, upper-level flow, and upper-level support was. Knowing that that this entire area was in an area where severe storms are possible, which areas of rotation circled in the image require a Tornado Warning? Some couplets (zones of rotation) are stronger than others, but you’d have a lot of false alarms if you issued on every couplet.

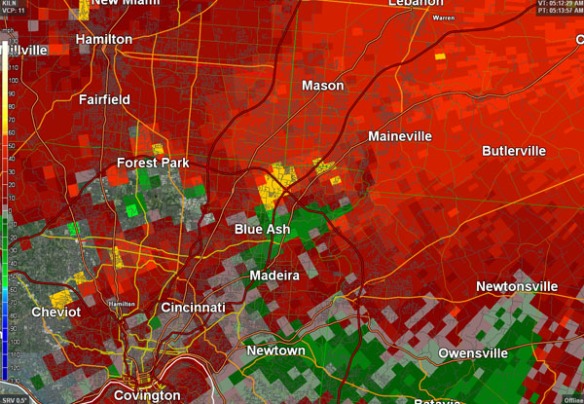
One tornado confirmed that night in the Ohio Valley occurred near Vandalia, Ohio. Even with a radial velocity scan produced by the radar every minute, the rotation the vicinity of the tornado is suddenly strong then suddenly weak in less than 5 minutes:

jun22-vandaliator

Even with high-resolution radar data, it is difficult to warn this community that a tornado is coming. It takes time for the National Weather Service to issue a Tornado Warning. It takes time for the media to break into programming to explain why a Tornado Warning was issued, show which communities are affected, and track the storm. It takes time for people to react and take cover. In this case, by the time all of this happened, the tornado had already dissipated.

While the tornado confirmed near Vandalia, Ohio on the evening of October 31, 2013 did not kill anyone, it injured 8 people. Unfortunately, many Ohio Valley tornadoes have killed people.

Historically, most tornadoes in the Tri-State since 1950 have been weak, receiving an F0, F1, EF0, or EF1 rating. For the sake of simplicity, I’ll classify “Tri-State tornadoes” as tornadoes since 1950 where any part of the tornado path is in the Tri-State. I’ll also count injuries, deaths, and damage caused by the entire tornado in my calculations even if part or most of these totals occurred outside of the Tri-State; odds are these “boosted” totals will be from stronger, longer-track tornadoes. Most tornadoes that have occurred in the Tri-State, however, began and ended in the Tri-State, so I will allow for this approximation.

The graph below shows that stronger tornadoes in the Tri-State have occurred less often than weaker tornadoes:

jun22-torratings

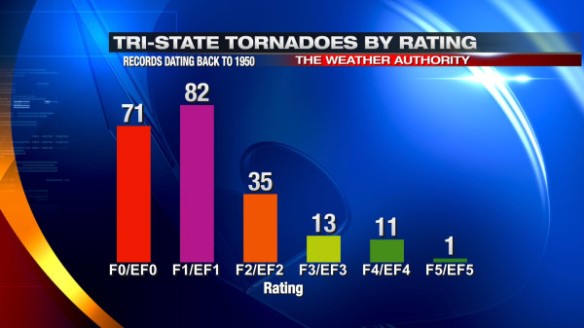
This is no great surprise; stronger tornadoes almost always require strong shear, instability, lift, and moisture. But do Tri-State tornadoes with a higher rating kill more people? Historical records suggest “yes,” but to a point:

jun22-tordeaths

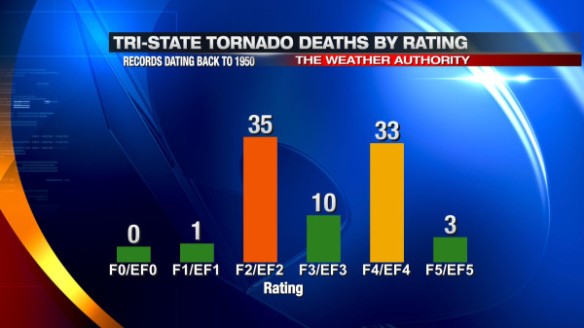
It is important to note that weak tornadoes (tornadoes with an F0, F1, EF0, or EF1 rating) have only killed one person in the Tri-State since 1950, while strong tornadoes (with an F2+ or EF2+ rating) account for roughly 99% of all Tri-State tornado deaths.

I won’t go into great detail about it here, but I believe the spikes in F2/EF2 and F4/EF4 fatalities are more about what, when, and where the tornadoes hit and less about the strength of the tornado.  The time of day, the time of year, population density in the path of the storm, and other factors likely contribute to the “spikes.” The F-scale and EF-scale are two different rating scales, and lumping and EF- and F-scale rated tornadoes into bins may also affect how the graph looks. The point I am highlighting is that stronger tornadoes tend to be killer tornadoes.

Injuries are more common than deaths with tornadoes, and – locally – more injuries have occurred with stronger tornadoes than with weaker ones:

jun22-torinjuries

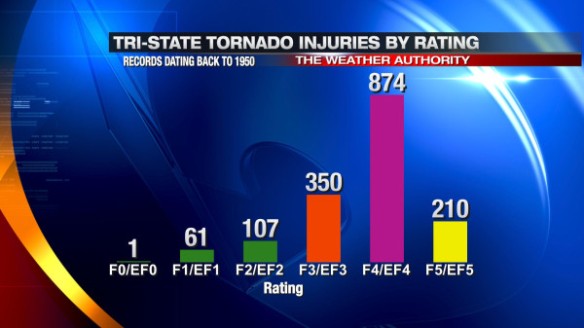
There has only been one Tri-State tornado given an F5 or EF5 rating since 1950: the Boone County/Sayler Park tornado on April 3, 1974; this is likely the reason for a large drop in the injury count from F4/EF4 to F5/EF5 tornadoes.

So why issue Tornado Warnings for weaker tornadoes if they kill and injure fewer than F2/EF2+ rated tornadoes? If this were the case, fewer Tornado Warnings issued would lead to a lower false alarm rate, and fewer people would ignore Tornado Warnings. Why not just worry about the big tornadoes and ignore the small ones?

There are two big reasons. Here is the first:

jun22-nwsmission

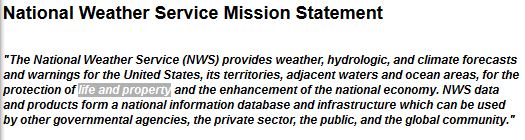
The Mission of the National Weather Service is to protect “life and property.” While protecting lives is of utmost importance, the Mission Statement also includes the words “and property.” The warnings that come from the National Weather Service and the tracking and alerting that broadcast meteorologists do is all in an effort to protect you and what you own. Regardless of whether they work for the NWS, in the media, academia, or the the private sector, meteorologists – as a whole – are committed to the NWS’ mission.

Some of the strongest tornadoes that have ever occurred in the Tri-State caused thousands if not millions of dollars in damage:

jun22-tordamages

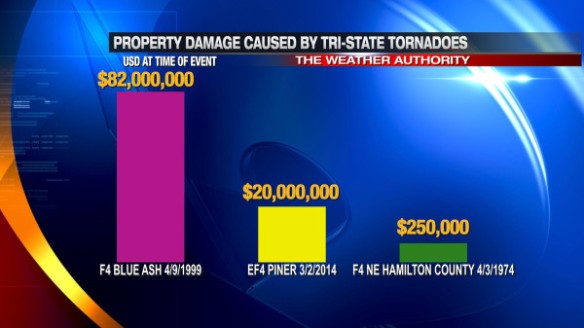
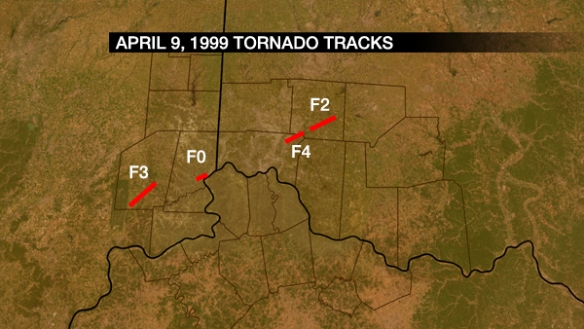
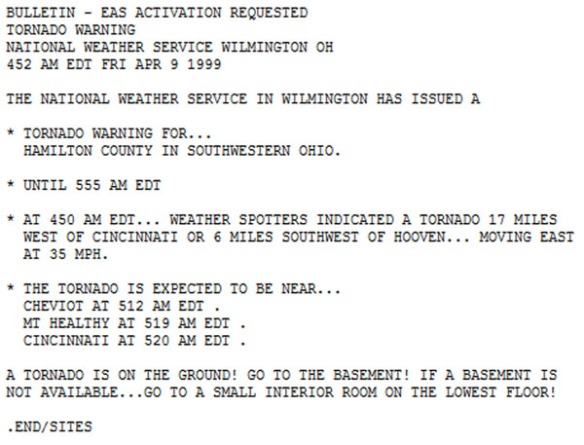
Even weak tornadoes can cause hundreds of thousands of dollars in damage. An F1 tornado in Dearborn County in the early morning hours of April 9, 1999 caused an estimated $250,000 (in USD at the time) worth of damage. Should we – the weather community – inform viewers when there’s an imminent threat of a tornado, regardless of whether it will injure people, kill people, or cause damage? Absolutely. People deserve the right to know what is coming for their them. Should the National Weather Service not issue a Flash Flood Warning if it will only cause homes to be damaged but not kill anyone? Should a broadcast meteorologist only cover a winter storm if it has the potential to be life threatening? Should meteorologist in the private sector only create a product or service that prevents injuries but doesn’t work to prevent deaths? The answer to all of these question is a resounding “NO.”

The second – and just as important – point is that discerning weak from strong tornadoes isn’t easily done in real-time. Despite incredible improvements in technology in the last 50 years, there will always be limitations to what a radar and spotter network can give a meteorologist. Radar doesn’t scan at the ground, and there will always be cases where a radar sees strong circulation but there is no tornado. Spotters are important for being the “ground truth” in the field, but spotters are not everywhere. Spotters can report a tornado and/or describe it, and radar can – in some cases – confirm a damaging tornado in progress. This, unfortunately, is where radar and spotters reach their maximum effectiveness.

Spotters and radar can’t rate a tornado. The EF-scale is based off of damage. In order for a tornado to get an EF rating, a National Weather Service survey team must survey the damage. Books and binders worth of documentation are often brought to the scene damage site so that the National Weather Service can compare what they see to a specific set of guidelines and give the tornado a rating. These surveys can take hours or even days.

As time goes on, we will learn more about how tornadoes form, how they dissipate, their environments, how to track them, and how to detect them with more accuracy. We will not, however, gain the ability to rate tornadoes on the EF scale in real-time. In other words, trying to rate a tornado as it cuts through a community is not worth our time. If we can’t definitively predict the rating of a tornado in real-time, why should we attempt to gauge which tornadoes will kill or injure people and which ones won’t? This is a dangerous game with no winners.

Tornado Warnings were created to warn those in the path that a tornado is imminent. Whether a tornado is radar indicated or confirmed by a spotter in the field, the threat for a tornado is real when a Tornado Warning is in effect. Some tornadoes will cause damage; others will kill and injure people. A meteorologist’s job is to warn, prepare, and educate. Daring to guess which storms will play nice and which ones won’t is best left to those who create the weather instead of forecasting it.

A Personal Reflection Of The April 9, 1999 Tornadoes

It was the loudest thunderstorm I’ve ever heard in my life.

There was a cadence of thunder. Lightning resembled a strobe light. The lightning and thunder was so intense that you couldn’t sleep through it if you tried. It didn’t last a minute; it lasted 10 minutes. It wasn’t constant thunder and lightning; it was loud, bright, and constant. Based on the thunder and lightning alone, you knew something was wrong. And there was.

I woke up the next morning really not remembering what had happened hours ago. Sun was coming through the window, and the storms had moved out by 7am when I woke up. Sycamore Schools had been called off, and I remember hearing it on my alarm radio. Family members called asking if we were okay. There were tree branches down in my area, but there was nothing suspicious going on outside. I remember wondering who had moved our gas grill to the other side of the deck that morning; no human moved it.

It was clear once the TV was on that there was extensive damage on the other side of Blue Ash. It was likely a tornado based on the severity of the damage, but it was not confirmed at that point.

There 5 tornadoes in the Tri-State in the early morning hours of April 9, 1999. The map below shows 4 of them; an F1 tornado near Addyston is not shown:

apr9-tornadotracks

A pair of thunderstorms were out to make trouble that night. One storm created two tornadoes in southeastern Indiana. Another caused damage in northeastern Hamilton County and southern Warren County. While the southern storm started strong, the northern storm would win out and cause the most damage that morning:

april9

The first tornado of the night was an F3 in Ripley County, touching down near the Big Oaks Refuge and dissipating before it moved in Dearborn County. The storm relative velocity product showed strong inbound and outbound motion (in green/blue and red, respectively) in southern Ripley County just before 4am on April 9, 1999; the storm-relative velocity product is essentially the raw radar velocity product with the motion of the storm subtracted out.

apr9-ripley

While this tornado was significant and killed 3 people, a much larger, powerful tornado would develop less than one hour later from a separate thunderstorm.

The 5:12am radar scan that night from the National Weather Service in Wilmington showed the classic “hook echo” forming just west of I-71:

apr9-refl

The radar velocity scan showed intense rotation near Blue Ash at that same time. Blue colors in the image below show strong winds moving towards the radar, and red colors show winds moving away from the radar; the tornado is very close to where these colors meet:

apr9-velocity

The storm-relative velocity scan at 5:12am below shows the rotation as well:

apr-srm

4 people were killed and 65 were injured as a result of the Blue Ash/Montgomery/Symmes Township tornado on April 9, 1999. More likely would have been killed or injured from this tornado had it not been for reports of a tornado and damage from trained weather spotters in Ripley and Dearborn County. This report was received by the National Weather Service at a critical, warning decision making time. The Tornado Warning issued for Hamilton County in the early morning hours of April 9, 1999 acknowledges a report of a tornado in southeastern Indiana minutes before Hamilton County was put under the warning.

apr9-warning

These spotters saved lives that night.

There have only been 11 tornadoes in the Tri-State since 1950 to be classified as a violent tornado (given a rating of F4, F5, EF4, or EF5). The tornado that hit Blue Ash, Montgomery, and Symmes Township was one them. These communities had roughly 30 minutes of warning lead time to take cover, but this warning occurred on a night where the severe weather threat was not excessively high. Two Tornado Watch boxes were issued for the Tri-State that night, but there was no imminent threat of a tornado during the late local news. Most went to bed hours before the hours not expecting a tornado to crash into their house. The Internet was not used like it is today, and NOAA Weather Radios were not used as often. After seeing the damage firsthand, it is surprising that more weren’t killed or injured.

The event was also a game changer for how storms were covered by local TV stations. While tornado coverage was there, it revitalized the sense of urgency that storms bring. The loss of life that morning changed TV severe weather policies and how storms were tracked and covered.

With the tornadoes from April 9, 1999 included in the count, April is the most common month for tornadoes in the Tri-State (41 in total since 1950).

April 9, 1999 reminds us that tornadoes can and do strike how and when they want. They don’t wait until the sun comes up, and they don’t discriminate. Nighttime tornadoes are dangerous, and they are among the deadliest types of tornadoes because they cause damage when people are most vulnerable. Lessons were learned that morning 15 years ago; my hope is that we are better prepared for the next round of storms.

A Review Of Meteorological Winter 2013-2014

Winter is far from over, but the core of the winter season – December, January, and February – was among the snowiest and coldest on record. In fact, meteorological winter 2013-2014 was the 2nd snowiest and the 18th coldest on record in Cincinnati.

To ensure that meteorologists compare apples with apples, meteorological winter is defined as December, January, and February. Astronomical winter’s start and end date varies each year and often ends and begins at a different time each year. Meteorological winter is always 3 months long, so it’s simple to compare seasons.

To measure where a season ranks compared to other years, we must know the average temperature of each day in that season. The average temperature of a day is the high and low temperature divided by two; the average temperature of a season is the average of all of the daily average temperatures in a season. When you crunch these numbers for the winter of 2013-2014, it ranks as the 18th coldest:

feb28-averagetemp

Meteorological winter of 2013-2014 ranks as the 2nd snowiest on record in Cincinnati; we were close to the number one spot of 1977-1978!

feb28-snowfall

While those are the two most common ways to measure a winter’s might, there are other ways. Ranking as the 14th coldest, the average low temperature this winter in the Queen City was 4.4° below average, but it was nowhere near as cold as 1976-1977:

feb28-averagelow

The number of nights where we dropped below 10° in meteorological winter was double the average but well short of the record set in 1976-1977:

feb28-lowbelow10

Cincinnati dropped below 0° 7 days between December 1st and February 28th. This is over three times the average, but 10 days short of the record:

feb28-lowbelow0

While the days were cold, records show that the number of days in December, February, and January where the high was below 32° was about average and not even close to matching the record:

feb28-highbelow32

One big record was set this winter: the most number of days (32) in meteorological winter with measurable snowfall. This beats the previous record set in 1977-1978 of 30 days:

feb28-measurablesnowfall

One Tornado Warnings and seven Severe Thunderstorm Warnings were issued in February 2014. The Tornado Warning was the first issued in the Tri-State during February since National Weather Service Forecast Office in Wilmington records began in 1995. The tornado confirmed by the National Weather Service in Ripley County was the first February tornado in the Tri-State since February 15, 1967.

Even after the brutal cold of meteorological winter 2013-2014, nearly all records of snowfall and cold still belong to 1976-1977 or 1977-1978. Rounds of snow and ice are far from over in the Ohio Valley. Cincinnati averages 3.1″ of snowfall each March; some in the Tri-State may see more than that Sunday into Monday!

January 2014 Was Cold, Snowy But Nothing Like 1977

If you thought January 2014 was cold and snowy, you’re right. January 2014 was the 4th snowiest and 12th coldest January on record in the Queen City. Considering official weather records for January in Cincinnati go back to 1871, making it in the top 20 lists for snow and cold in January is impressive. When you have winters like 1976-1977 and 1977-1978, however, it is very hard to get to or near the top spot of the coldest and snowiest month of the year (on average).

January’s snowfall total at the Cincinnati/Northern Kentucky International Airport of 20.4″ was over three times the average amount of snowfall in January, but it fell well short of the January 1977 snowfall total:

feb2-blog-januarysnow

The snow that fell in January felt like even more of a burden after a very snowy December. December 2013 (with a total of 10.4″ of snowfall) was the 9th snowiest December on record in the Queen City:

feb2-blog-decsnow

December’s 2013 total was 1/2″ short of January 1977’s total, and over 7″ below the December 1883 snowfall total. The National Weather Service says official snow records began in 1893; if you accept that as the start of official records (and not when other records like temperature and precipitation began in November of 1870), December 2013 was the was the 7th snowiest December on record.

January 2014 was also snowier than average by the number of days with measurable snowfall in Cincinnati:

feb2-blog-meassnow

January 2014 was also a very cold month. In meteorology, the ranking of cold is determined by calculating the average temperature of the month. The average temperature of any given day is average of the high temperature and low temperature; the average temperature of the month is calculated by averaging daily average temperatures for the entire month (did you get all of that?). By this measure, January 2014 was the 12th coldest January since official records began (in November 1870):

feb2-blog-janavgtemp

The average high temperature in January 2014 was colder than the 30-year average but well above of the average high temperature in 1977:

feb2-blog-janavghigh

It was the same story with low temperatures: January 2014’s average low temperature was below the 30-year average but above the average low temperature of January 1977:

feb2-blog-janavglow

The temperature frequently dropped below 10° in January 2014, but the record of January nights with a low temperature below 10° went unchanged this year:

feb2-blog-lowsbelow10

We also dropped below 0° 7 days in January 2014, but we dropped below 0° more frequently in 1977:

feb2-blog-lowsbelow0

The cold of January 2014 was not just felt at night; we had several days where the temperature didn’t get above 32°. Despite being above the average, our count of days with a high temperature below 32° fell way short of the 29 days with a high below 32° in January 1977:

feb2-blog-highbelow32

Regardless of how you measure it, January was a very cold, snowy month; the king of cold and snow continues to be 1977. More waves of snow and cold are on the way in the month ahead. Our snowfall total since last summer now stands at 33.7″; we need need just over 20″ to get to the all-time fall/winter/spring snowfall record set in – you guessed it – 1977 through 1978.