From 0 To 36: A Suddenly Stormy Stretch For The Tri-State

In my March 31st blog post, I said that the Tri-State had not gone the entire month of January, February, and March without a Severe Thunderstorm Warning being issued (since 1995 when the National Weather Service in Wilmington opened).

Boy, did our luck suddenly run out. Or as Ron Burgundy put it:

apr12-blog-ron

The first Severe Thunderstorm Warning of the year in the Tri-State was issued in Owen County at 4:35pm on April 2nd. Another was issued at 5:10pm that day, and other was issued on the afternoon of April 7th. From April 8th through April 10th, however, a whopping 33 Severe Thunderstorm Warnings were issued in the Tri-State, bringing the monthly total up to 36 warnings; this total puts the Tri-State into second place for the most number of Severe Thunderstorm Warnings during April:

apr12-blog-aprilwarnings

All of these warnings were issued in the first 10 days of the month. Between 1995 and 2014, an average of 14 Severe Thunderstorm Warnings were issued in the Tri-State each April; with 2015 included, that average now goes to 15.

On average, April is the 3rd most common month for severe storms in the Tri-State behind June and May.

While getting 34 Severe Thunderstorm Warnings in two days is impressive, the number of times certain counties have been placed under warnings so far this month is also impressive:

apr12-blog-aprilcounties

The Severe Thunderstorm Warning count for so far this month for Clermont, Brown, Pendleton, and Adams County are new records for April. Grant and Owen have tied their records for the most number of Severe Thunderstorm Warnings in a single April.

While there will be waves of rain and storms in the week ahead, this week does not look exceptionally stormy. The warning count for most if not all Tri-State counties will remain the same through the upcoming weekend.

Reds’ Opening Day Weather History

Opening Day is upon us, and the long-awaited start of the baseball season is here! Showers will be scattered today, and high temperatures will be near average. While you may be bummed about the chance for rain, it will not be widespread, and it the weather has been MUCH worse on Opening Day!

To celebrate the beginning of the 2015 season, here’s some Cincinnati Reds Opening Day weather trivia:

apr5-blog-trivia1

apr6-blog-trivia2

apr6-blog-trivia3

apr6-blog-trivia4

apr6-blog-trivia5

apr6-blog-trivia6

apr6-blog-trivia7

apr6-blog-trivia8

Play ball!

What You Need To Know About The Air Quality Advisory Program That Starts Today

The term “Smog Alert” has been a phrase used for decades on days where air quality was relatively poor in Cincinnati. Beginning today, however, the Southwest Ohio Air Quality Agency will no longer issue “Smog Alerts.” Instead, they will issue an “Air Quality Advisory.” This change involves more than just the title of the alert. The chief aim of this rebranding is to re-engage you about local air quality.

The Southwest Ohio Air Quality Agency measures the concentration of the six pollutants to U.S. Environmental Protection Agency health-based standards for Butler, Clermont, Hamilton, and Warren County. Under the current U.S. EPA standards, if ozone or particulate matter causes the Air Quality Index to exceed 100, the Agency will issue an Air Quality Advisory (beginning today). This is a message that encourages at-risk individuals (those with asthma and other pulmonary issues, young children, and older adults) to avoid strenuous outdoor activity until air quality improves.

When an Air Quality Advisory is issued, it will be in effect for Butler, Warren, Hamilton, Clermont, Boone, Kenton, and Campbell County (just like Smog Alerts).

The Air Quality Advisory is issued by Southwest Ohio Air Quality Agency the day before elevated ozone and/or particulate matter levels are anticipated. The decision is made around 2pm (usually Monday through Friday, but occasionally on weekends if ozone or particulate matter levels are forecast to be high) and includes a review of current and historic weather patterns.

Calculating the Air Quality Index is not easy. In fact, it’s horribly messy. The technical explanation how the AQI is calculated is here: http://www.epa.gov/airnow/aqi-technical-assistance-document-dec2013.pdf (beginning on page 16). Before the overall AQI is calculated, the AQI must be calculated for each pollutant (O2, O3, NO2, SO2, PM10, PM2.5). A calculator for doing this can be found at: http://airnow.gov/index.cfm?action=resources.conc_aqi_calc. Again, it’s a total mess. However, once that AQI is measured or forecast, the determination for a “Air Quality Advisory” will be made.

The weather plays an important part of that decision to issue or not issue. Here’s a graphic showing some weather factors that may trap pollutants near the ground and cause an “Air Quality Advisory” day to be issued:

mar29-aqasetup

Notice that high dewpoints, a center of high pressure nearby, weak winds, and a temperature inversion (temperature increasing with increasing altitude, creating a stable layer of air aloft) help elevate air pollution levels. With time these conditions change, and air quality levels improve.

The main driver for an elevated AQI in the summer is ozone. The main driver for an elevated AQI in the winter is particulate matter. Smog alerts were almost always issued during the summer in the past; going forward, Air Quality Advisories may be issued at any time of the year, including during the winter.

Air Quality Advisories will likely be issued more frequently than Smog Alerts were. The current national standard for ozone is 75 parts per billion (ppb). The U.S. EPA is proposing a new standard of 70 or 65ppb and possibly 60ppb; the EPA will likely adjust the standard this fall. How many Air Quality Advisories we get will depend on how strict the standard is.

For example, no Smog Alerts were issued in 2013 or 2014. Had the Air Quality Advisory program been in effect those years, an advisory would have been issued 2 days in 2013 and 4 days in 2014 due to ozone levels exceeding the standard of 75ppb:

mar29-75ppb

That’s the current EPA ozone standard. The standard will likely become more strict later this year. Suppose it was set at 70ppb in 2013 and 2014 (like it likely will be later this year); during the last two years, there would have been 31 days with Air Quality Advisories in effect:

mar29-70ppb

Suppose it was even more strict and set at 65ppb. There would have been 109 Air Quality Advisory days in 2013 and 2014:

mar29-65ppb

Lastly, if the EPA had lowered the standard to 60ppb for 2013 and 2014 with the Air Quality Advisory program in effect, an Air Quality Advisory would have been needed 239 days in the last two years:

mar29-60ppb

We are just barely meeting the ozone standard in Cincinnati now:

ozone_8hour
Courtesy: Southwest Ohio Air Quality Agency

While ozone concentrations in the air we breathe have dropped significantly in the last few decades (the blue line above), we are just under the current standard (the green line above).

Again, this is just for the ozone standard. We also have to meet particulate matter, sulfur dioxide, nitrogen dioxide, and carbon monoxide standards. In addition to ozone, we are barely making sulfur dioxide and some particulate matter standards.

We have a lot of work to do on air quality. I haven’t met a person who doesn’t want cleaner air. All of the same air quality tips you heard for Smog Alerts will apply to Air Quality Advisory days. In case you’ve forgotten them (I understand, it has been a while), here they are:

– Taking the bus, carpooling, biking or walking instead of driving
– Refueling your vehicle after 8 p.m.; do not top off when refueling and tighten the gas cap
– Not idling your vehicle
– Combining trips or eliminating unnecessary vehicle trips
– Keeping your vehicle maintained with properly inflated tires and timely oil changes
– Avoiding use of gasoline-powered lawn equipment on Air Quality Advisory days
– Avoiding use of oil-based paints and stains on Air Quality Advisory days
– Never burning leaves or other yard trimmings
– Always burning clean, seasoned wood in outdoor fire pits, fireplaces and wood stoves
– Not using fire pits or fireplaces for non-essential home heating on Air Quality Advisory days
– Conserving electricity

The Lack Of Severe Thunderstorms Sets A New Tri-State Record

There have been no Severe Thunderstorm Warnings issued in the Tri-State so far this year. That is an incredible statement to make in late March.

As I mentioned in my March 17, 2015 blog, the first Severe Thunderstorm Warning of the calendar year in the Tri-State, on average, is issued on Valentine’s Day:

mar16-firstsvr

Note that the latest first Severe Thunderstorm Warning of the year and in the Tri-State was on March 31, 2007. There will be no severe thunderstorms in the Tri-State today, and there will be no severe thunderstorms tomorrow; this means – using the first Severe Thunderstorm Warning of the year as a measure – this will be the latest start to the severe weather season on record (since the National Weather Service forecast office opened in 1995).

Reading that statement doesn’t really do it justice; you have to see it. Here’s the total number of Tri-State Severe Thunderstorm Warnings issued in January, February, and March by year:

mar29-yeartodatewarningssmall

Since 1995, there have been 3 years with 1 Severe Thunderstorm Warning issued in the first 3 months of the year. One could make the argument that we are barely setting a new record, and that is true. The argument I make here is that a record is a record.

On average, 5 Severe Thunderstorm Warnings are issued in the Tri-State each March:

mar29-marchwarningssmall

It is common to go through March without severe storms, but it is uncommon to go through the first 90 days of the year without at least onr severe storm. On average, 2 Severe Thunderstorm Warnings are issued each January, and 3 are issued each February. We have beat the odds for three straight months.

This stretch (since the beginning of the year) is not the all-time stretch between two Severe Thunderstorm Warnings. The last Severe Thunderstorm Warning issued in the Tri-State was issued on the afternoon of December 24, 2014 for Highland and Adams County (about 98 days ago). The record for the longest period of time between two warnings in the Tri-State is 216 days (between warnings issued on August 27, 2003 [Clinton County] and March 30, 2004 [Adams County]).

While strong storms are a possibility later this week, we are not currently set in a severe weather risk. This may change; if it does, this change in the pattern will be overdue. Be prepared!

Why High Clouds Should Matter To Meteorology And You

There is a problem in the weather community that no one really discusses. Of all of the problems that the weather enterprise needs to tackle, this is far from a #1 priority; this issue, however, is important.

It’s about high clouds.

High clouds are often written off as decorative clouds. They often produce no precipitation and just filter sunshine. Thin, wispy cirrus clouds form usually form due to upper-level winds tearing off the tops of showers and storms that extend tens of thousands of feet into the atmosphere. High-level clouds often go where low- and mid-level clouds can’t survive, including right through areas of high pressure; this is because sinking air associated with a surface area of high pressure is usually focused well below jet stream level (where high-clouds live). High-level clouds typically last longer and travel farther than low- and mid-level clouds because vertical motion and friction closer to the ground allows dry air to mix with lower-level clouds more easily.

So why care about these clouds if they just filter starlight, filter sunlight, and rarely produce precipitation? Because a forecaster’s reputation is on the line every time he or she sits in the chair.

High clouds matter, and here are some examples why.

I went to the Cincinnati/Northern Kentucky International Airport on the evening of Sunday, March 15th to pick someone up after a flight. I noticed the coverage of clouds varying a lot driving from Ohio to Kentucky. As a meteorologist, I want the forecast to be right. After parking in the cell phone lot, I took these pictures of the sky. Here was the sky looking south:

mar22-blog-south

…and west:

mar22-blog-west

…and north:

mar22-blog-north

…and east:

mar22-blog-east

…and straight up:

mar22-blog-up

The weather station at the airport about 5,000 yards away from where I was standing produced the following report at the time the photos above were taken:

KCVG 152252Z 28007KT 10SM BKN250 17/01 A3019 RMK AO2 SLP223 T01670011

Unless you’re a pilot, a meteorologist, or a weather enthusiast, you probably can’t understand that report. When it comes to the report of clouds in this case, we are focused on the part of the report that begins with BKN:

mar22-blog-15thmetars

What are “broken clouds?” To understand this, you must understand how sky cover is measured. A number between 0 and 8 (in units of okta) are used to describe how much of the sky is covered with clouds. If the sky cover is reported as 0 oktas, the sky is clear. If the sky cover is reported as 8 oktas, the sky is completely covered in clouds. There can be a few different layers of clouds in the weather observation, and each has a unique opacity. The weather station at the International Airport that measures cloud cover and other meteorological variables is called an ASOS, or Automated Surface Observing System. The cloud cover mentioned in the report is averaged over time and is not a “right now” measurement. Per the NWS’ ASOS users guide, here’s the scale the ASOS uses for converting the sky cover it measures in okta to text:

mar22-blog15thasos
Using the table, the weather report at the time the photos above were taken says the sky was more than 4/8 (50%) but less than 8/8 (87%) covered with clouds. Many computer algorithms (non-technical weather websites, smartphone apps, etc.) will convert a BKN cloud cover report to be “mostly cloudy.” If a forecaster said the sky would be “partly cloudy,” that forecast would be scored as inaccurate by most computer algorithms. The device used to measure cloud cover is pointed straight up at the sky. While the human observer at the International Airport can adjust the weather observation, the cloud cover part of the observation is rarely adjusted.

Does the sky look mostly cloudy to you in the photos? It depends on which direction you look. You could make the argument that the sky was mostly sunny or partly cloudy in spots.

Here was the visible satellite snapshot around the time of the observation:

mar22-blog-lastsundaysat

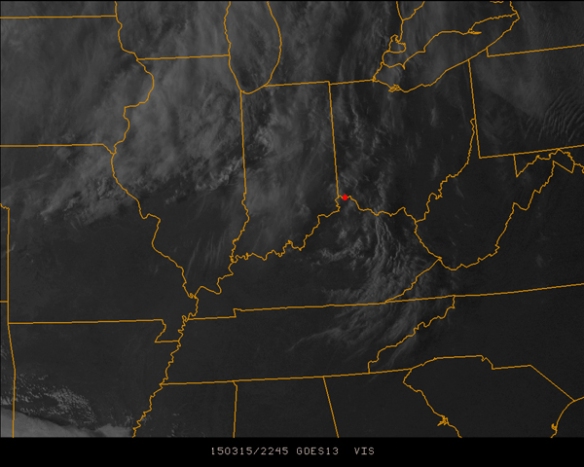
Cincinnati is the red dot. Does it look cloudy to you? Based on the satellite image, you could make the case for a mostly cloudy sky at times.

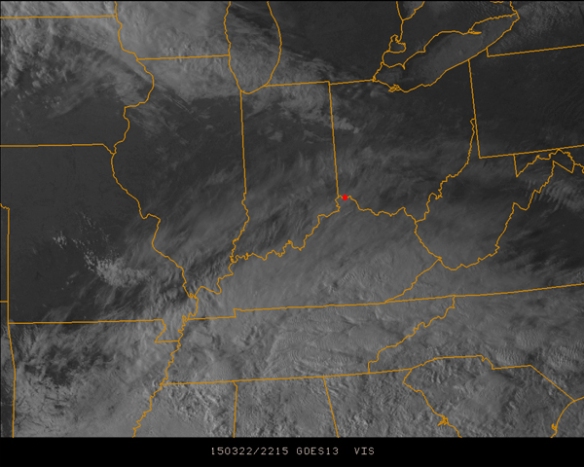
Here’s another example from Sunday night (March 22, 2015)…broken clouds at 25,000 feet above the ground were reported at the airport just before 6pm:

KCVG 222152Z 06010KT 10SM BKN250 10/M07 A3013 RMK AO2 SLP204 T01001067

Remember, broken clouds were reported at the same altitude around the same time on the previous Sunday. A visible satellite snapshot at the time showed clouds overhead at the time:

mar22-blog-sundaysat

A minute after the weather report came down from the airport, the sky over Cincinnati looked like this:

mar22-blog-cloudysky

The view didn’t look much different from 600 feet above Cincinnati at the same time:

mar22-blog-604pmtowercam

Remember, these are high-level clouds. Who cares, right? Comparing both case studies shows “broken clouds” is a vague description. “Broken clouds” can look partly cloudy or mostly cloudy. But as meteorologists, the quality of a forecast is often measured against surface weather reports at the International Airport.

…or – more importantly – the general public. A meteorologist going on TV and calling for a “partly cloudy sky” when it looks cloudy (or is cloudy) out the window does not bode well for a meteorologist’s reputation.

The negligence of a forecaster to consider the coverage or thickness of high-level clouds can not only harm his or her image, but it can also affect the quality of the forecast. High-level clouds absorb and re-emit radiation, including radiation that comes from the ground or underneath a cloud. The temperature of the air is directly related to the solar radiation that is absorbed by the air and also the ground (because the ground absorbing radiation causes it to warm, which in turn warms the air with which it is in contact). Because clouds can absorb and re-emit radiation directed back at the ground (that would otherwise go out to space), mostly sunny days are often warmer than sunny days (given no other significant differences in weather conditions between the two days).

The lack of frequent weather reports from local airports must also be considered here, but this is a whole different can of worms and a blog post for another day.

High-level clouds are a bigger deal than we make them. While they are often forgotten, ignored, or considered unimportant by forecasters, meteorologists, the weather enterprise, scientists in related fields, and even those not particularly interested in meteorology, they are an important part of weather.

The Latest Start To Severe Weather Season On Record?

There are various ways to measure the depth of a severe weather season. You can count the number of warnings, damage reports, or tornadoes. You can count the number of days between warnings, or you could count the number of days between the first warning of the year and the last warning of the year.

Comparing the start of the severe weather seasons to another is much easier. The date of the first warning issuance is essentially the starting gun being fired at start line of race.

Since the National Weather Service Forecast Office in Wilmington warning records began in 1995, roughly 230 Flash Flood, Tornado, and Severe Thunderstorm Warnings have been issued in the  Tri-State. None of these warnings have been issued so far this year, and this is unusual.

Of Severe Thunderstorm, Flash Flood, and Tornado Warnings, a Severe Thunderstorm Warning is typically first warning of the year issued. A Severe Thunderstorm Warning has been issued ahead of the first Flash Flood Warning and first Tornado Warning 15 of the last 20 years; a Flash Flood Warning was issued first the remaining 5 years.

On average, the first Severe Thunderstorm Warning of the calendar year in the Tri-State is issued on Valentine’s Day:

mar16-firstsvr

Since 1995, there has not been a year in the Tri-State where at least one Severe Thunderstorm Warning was issued before April 1st. Note that severe thunderstorms can occur in January.

The first Tri-State Flash Flood Warning of the year typically comes in the start of meteorological spring:

mar16-firstffw

If a Flash Flood Warning is not issued in the Tri-State before May 20th, a new record for the latest first Flash Flood Warning of the year would be set in 2015. The most common months for Flash Flood Warnings to be issued are April and May.

Tornado Warnings, historically, are the last of the big three warm-season warnings to be issued in the calendar year; the first one, on average, is issued in early May:

mar16-firsttor

Note that it took until November 17th of 2013 to get a Tornado Warning issued. That Tornado Warning did not verify, nor did ones issued on November 18th or for Adams County before sunrise on December 22nd. For the first time since 1988, no tornadoes were confirmed in the Tri-State in 2013. The first Severe Thunderstorm Warning of that year, however, was issued on January 30th.

Colder air is in the process of returning to the Tri-State, and this cold lingering through late March and very early April may mean the slowest start to severe weather season on record based on Severe Thunderstorm Warnings. If that doesn’t convince you, making it through May without a Flash Flood Warning would make 2015 a solid contender for the top spot. If you throw 2013 out, the average first Tornado Warning of the year date drops back to April 28th, and the latest date drops to July 27th (2002).

I can’t recall a time since the year began when there was a cloud-to-ground lightning strike in the Tri-State. For storm lovers, 2015 has been a dud thus far, and they will be waiting for at least a short while to get what they want. For those who dread storms, their prayers have been answered.

Winter Is Not Over For Cincinnati And Here’s Why

There is a great buzz around Cincinnati about the warmer temperatures this week, and there are great reasons for the buzz. People are more inclined to get out and make the most of the day when the sun is out and temperatures are mild. This mild stretch is especially welcome given brutal cold early this month and for most of last month.

We have not seen the last of winter, however. No, there is no immediate threat for snow. Temperatures near or below zero aren’t likely either. This change in the pattern will mean a drop in temperatures though. Right now, the jet stream is positioned to our north, and the influence of an upper-level area of low pressure to our west is minimal:

mar10-thisweek

The pattern we are in now will be changing some this weekend and more drastically next week. Tuesday morning’s European (ECMWF) model shows cold air associated with an upper-level low diving south into New England on Sunday morning:

mar10-ecmwf

The ridge over the Rockies and Plains (and it’s associated warmth in red) will mainly hold through the weekend, but the Tri-State will still get a glancing blow of cold Saturday through Monday. Lows will briefly dip into the 30s Sunday and Monday morning.

The biggest blast of cold will come late next week. The large, upper-level area of low pressure moving south out of Canada will not be pushed easily to the east by the jet stream. This area of cold will push the ridge in the Plains back to the west, and this new pattern will likely persist through late March and at least a couple of days into early April:

mar10-bloglatemarchearlyapril

While the jet stream is to our south later this month, this air mass may bring temperatures back into the 20s at night and 30s to 40s during the day. Some model runs have painted very light snow in the Ohio Valley during this extended period of cold, but there is no specific time when snow more likely than other (if it even occurs at all). Cincinnati averages 0.5″ of snowfall accumulation each April, so don’t think it won’t happen!

In summary, here’s how my latest long range forecast thinking…

mar10-bloglongrange

Notice that specifics are not a part of this long range prediction. Specifics on timing and positioning of weather systems are rarely resolved well more than one week out. With time, trends will turn to numbers. For now, know our time with above-average warmth is limited.

Are We Done With Cold And Accumulating Snow? History Suggests “Probably Not”

As mid-March nears and snow rapidly melts, biometeorology does what it does best in the spring: get us focused on warmer weather. Signs of spring, however, rarely stick their landing in Cincinnati. Winter and spring always fight in March, April, and even May. Spring always wins the war, but winter usually takes a couple of battles.

Historically, the Queen City gets at least one more round of snow between March 9th and the summer. Many of you remember the 0.6″ of snowfall accumulation on April 15th, 2014 that allowed us to gain a rank towards the snowiest cold season on record. On average, 2.6″ of snow accumulates in the next 90 days, but some springs are snowier than others:

may8-snowfallleft

The average listed above is a 30-year average (1981-2010). Since 1893, there have been 17 years without accumulating snow on our after this date and during the spring. The other 105 years had at least 0.1″ of accumulation.

In the last 144 years, 5 of them had 12″+ of snowfall accumulation between March 9th and July 1st; 21 years had 6″ or more, and 41 years had 3″ or more. Here are the greatest snowfall totals from this date through the summer:

may8-bigsnowfall

1937 (listed above) was a stand out year for weather in Cincinnati. The Ohio River at Cincinnati had it’s all time crest on January 26, 1937 at 80′ thanks to 7.25″ of precipitation in the 6 days before the crest. 2.64″ of rainfall was recorded on January 14th of that year. 6″ of snow fell on January 22nd and 23rd, 1937. While the flooding was far more extreme in 1937, the setup was nearly the same as the last week: waves of rain and snow that melted saturated the ground and eventually caused the river to spill out of its banks. Later in the year, 4″ of snow accumulated on March 10th and another 9″ accumulated on March 13th and 14th.

This is all a reminder that it could be much worse.

As you might expect, the odds of accumulating snow drop each month from March through May:

may8-averagesnow

While the average snowfall total for May in Cincinnati rounds to 0.0″, snow has accumulated during May in Cincinnati. A trace of snow was recorded on May 11th, 1966 at the Cincinnati/Northern Kentucky International Airport. 0.2″ of snow accumulated in Cincinnati on May 6, 1989. A total of 0.5″ of snow has accumulated in the Queen City on ALL May days since official snowfall records began in 1893.

As the angle of the sun gets higher through the spring, the likelihood of brutal cold decreases. The temperature has only dropped below 0° 3 days during March since 1871, but one of those days had a low of -11°. Temperatures in the mid to upper teens are rare in April, and temperatures in the 20s are rare in May:

may8-coldesttemps

Winter will lose its grip gradually in the next 3 months. Long range models suggest the next 10 days will be mild, but below average-temperature are forecast to return for late March and early April.

Comparing This Cold Season To The Last One

When winter is approaching, I often get asked whether it will be cold, snowy, mild, or wet. After a very snowy, colder than average winter of 2013-2014, I told most going into the season that the winter of 2014-2015 would be less snowy, but colder than the winter of 2013-2014. While December did not go according to plan, the overall winter forecast worked out.

When winter weather hits, most compare it to a previous winter or another place where the weather is more extreme. The common phrases I’ve heard this year were “at least it’s not as bad as Boston” and “at least it’s not as bad as last winter.” The latter phrase always gets me thinking. How is this cold season measured against last year? Is this measured by snow? Is this measured by cold? Is this measured by how many days snow has been on the ground? Everyone has a different way to measure a winter, and that’s the way it should be.

So has the cold season of 2014-2015 been worse than that of 2013-2014? Let’s compare the two using several different scales.

When people say “at least it’s not bad as last winter,” I’m assuming they measure the two by a seasonal snowfall total , given that winter 2014-2015 was not as snowy as winter 2013-2014, but winter 2014-2015 was colder. If you measure by how much snow accumulated, 2013-2014 was indeed worst than 2014-2015:

may7-snowfalltotals

While there have been fewer days with accumulating snowfall this season, storm total snowfall amounts have been bigger in most cases. Through Saturday, there have been 50% fewer days with 1″ or more of snow on the ground compared to 2013-2014’s entire cold season in Cincinnati:

may7-snowdepth

It is highly unlikely that 2014-2015’s count will be anywhere close to 2013-2014’s count. However, the 10″ of snow on the ground at 7am on February 21, 2015 was more than any single day from late 2013 through early 2014.

If you rule out snow, the most common way to measure how brutal a winter was is to compare the average temperature of one meteorological winter (December/January/February) to another. 2014-2015 beat out last winter by 1.25°:

may7-averagetemp

While 1° doesn’t seem like much, that is a significant difference given that the average temperature of the season is the daily average temperature averaged over 3 months.

In the cold season of 2014-2015 so far, there have been 32 days where the high did not reach 32°. That’s two days behind the count from summer 2013 to summer 2014:

may7-below32highs

It is rare from late March through early November to have a high temperature below 32° in Cincinnati, so the current tally of 32 days for 2014-2015 is unlikely to rise much if at all.

While cold days are inconvenient, cold nights are often more difficult to deal with and are discussed more. In the cold season of 2014-2015, however, there have been fewer days with a low temperature below 0° than last season:

may7-belowzerolows

In my opinion, winter 2013-2014 was worse than winter 2014-2015. For the former, the amount of snow was overwhelming, and the shots of cold were sharper. For the latter, the cold was more prolonged and the winter storms produced more snow. This cold season, however, is bottom-heavy, meaning most of the snow and cold came late (and we’re not done yet). Had December 2014 been colder, this cold season would have easily rivaled the cold season of 2013-2014.

Historical Perspective On The Last Week In Cincinnati

There have been three significant winter storms in the Tri-State during the last 7 days. It is rare to have frequent rounds of heavy snow in Cincinnati. In fact, the last week ranks as the 18th snowiest week on record in Cincinnati. If you omit the overlapping streaks, Cincinnati just had it’s 6th snowiest week since 1893:

feb21-blogsnowiestweeks

February is typically the snowiest month of the year in Cincinnati (with 6.53″ of snowfall on average); January is a close second with an average of 6.51″ of snowfall. Despite being the snowiest month of the year, it is rare to see more than 10″ of snowfall in a week during February; the last 7 days were among the snowiest during February back to 1893 :

feb21-blogsnowiestfeb

This abnormally snowy stretch has pushed us to 5th place on the snowiest Februarys on record in Cincinnati:

feb21-blogsnowiestfebtotals

…and the month is not over. The amount of snowfall recorded at the Cincinnati/Northern Kentucky International Airport in the last 7 days is 92% of the amount of snow that typically falls in all of meteorological winter (December, January, and February combined):

feb21-blogsnowavgwinter

It’s worth noting that more snow has fallen in the first 21 days of February 2015 (18.6″) than falls during meteorological winter on average (18.1″). The snowfall total for meteorological winter 2014-2015 through February 21st is 19.9″.

The seasonal snowfall total through February 21st is now up to 25.0″. On average, 22.5″ of snowfall is recorded in Cincinnati from one summer to the next. All snow that accumulates for the rest of the winter and spring just adds to the surplus.

This winter has been “bottom heavy.” More than double the amount of snow that fell between last summer and February 14th has fallen in the last week:

feb21-snownowvsearlier

“Bottom heavy” describes not just snowfall accumulation this winter, but it also describes cold. If February had ended at midnight on Sunday, February 2015 would be the 8th snowiest February on record:

feb21-blogcoldestfeb

If meteorological winter 2014-2015 had ended at midnight February 21st, it would rank as the 19th coldest back to 1870-1871. There is still plenty of time for our ranking to change, but it doesn’t look like the ranking going to slide down. Saturday morning’s American long-range (GFS) model has arctic air plunging into the Great Lakes and Ohio Valley to start off the work week:

feb21-gfs8ammon

It has another shot of arctic air coming late in the work week:

feb21-gfs8pmwed

Saturday morning’s European long-range (ECMWF) model is similar to the GFS, bringing an arctic airmass into the Ohio Valley and Great Lakes Monday morning:

feb21-ec8ammon

…and another area of arctic air to the Ohio Valley before next weekend begins:

feb21-ec8amthur

The first blast of arctic air will likely bring temperatures of -5° to 5° to the Tri-State early Monday and Tuesday morning. The second blast will bring temperatures back into this range Thursday and Friday morning.

Winter is far from over. At least a few more waves of very cold air and snowy will swing into and through the Ohio Valley during the next 2 months. Temperatures will moderate some in March, but cold will win out for the next several weeks.