Are We Done With Cold And Accumulating Snow? History Suggests “Probably Not”

As mid-March nears and snow rapidly melts, biometeorology does what it does best in the spring: get us focused on warmer weather. Signs of spring, however, rarely stick their landing in Cincinnati. Winter and spring always fight in March, April, and even May. Spring always wins the war, but winter usually takes a couple of battles.

Historically, the Queen City gets at least one more round of snow between March 9th and the summer. Many of you remember the 0.6″ of snowfall accumulation on April 15th, 2014 that allowed us to gain a rank towards the snowiest cold season on record. On average, 2.6″ of snow accumulates in the next 90 days, but some springs are snowier than others:

may8-snowfallleft

The average listed above is a 30-year average (1981-2010). Since 1893, there have been 17 years without accumulating snow on our after this date and during the spring. The other 105 years had at least 0.1″ of accumulation.

In the last 144 years, 5 of them had 12″+ of snowfall accumulation between March 9th and July 1st; 21 years had 6″ or more, and 41 years had 3″ or more. Here are the greatest snowfall totals from this date through the summer:

may8-bigsnowfall

1937 (listed above) was a stand out year for weather in Cincinnati. The Ohio River at Cincinnati had it’s all time crest on January 26, 1937 at 80′ thanks to 7.25″ of precipitation in the 6 days before the crest. 2.64″ of rainfall was recorded on January 14th of that year. 6″ of snow fell on January 22nd and 23rd, 1937. While the flooding was far more extreme in 1937, the setup was nearly the same as the last week: waves of rain and snow that melted saturated the ground and eventually caused the river to spill out of its banks. Later in the year, 4″ of snow accumulated on March 10th and another 9″ accumulated on March 13th and 14th.

This is all a reminder that it could be much worse.

As you might expect, the odds of accumulating snow drop each month from March through May:

may8-averagesnow

While the average snowfall total for May in Cincinnati rounds to 0.0″, snow has accumulated during May in Cincinnati. A trace of snow was recorded on May 11th, 1966 at the Cincinnati/Northern Kentucky International Airport. 0.2″ of snow accumulated in Cincinnati on May 6, 1989. A total of 0.5″ of snow has accumulated in the Queen City on ALL May days since official snowfall records began in 1893.

As the angle of the sun gets higher through the spring, the likelihood of brutal cold decreases. The temperature has only dropped below 0° 3 days during March since 1871, but one of those days had a low of -11°. Temperatures in the mid to upper teens are rare in April, and temperatures in the 20s are rare in May:

may8-coldesttemps

Winter will lose its grip gradually in the next 3 months. Long range models suggest the next 10 days will be mild, but below average-temperature are forecast to return for late March and early April.

Comparing This Cold Season To The Last One

When winter is approaching, I often get asked whether it will be cold, snowy, mild, or wet. After a very snowy, colder than average winter of 2013-2014, I told most going into the season that the winter of 2014-2015 would be less snowy, but colder than the winter of 2013-2014. While December did not go according to plan, the overall winter forecast worked out.

When winter weather hits, most compare it to a previous winter or another place where the weather is more extreme. The common phrases I’ve heard this year were “at least it’s not as bad as Boston” and “at least it’s not as bad as last winter.” The latter phrase always gets me thinking. How is this cold season measured against last year? Is this measured by snow? Is this measured by cold? Is this measured by how many days snow has been on the ground? Everyone has a different way to measure a winter, and that’s the way it should be.

So has the cold season of 2014-2015 been worse than that of 2013-2014? Let’s compare the two using several different scales.

When people say “at least it’s not bad as last winter,” I’m assuming they measure the two by a seasonal snowfall total , given that winter 2014-2015 was not as snowy as winter 2013-2014, but winter 2014-2015 was colder. If you measure by how much snow accumulated, 2013-2014 was indeed worst than 2014-2015:

may7-snowfalltotals

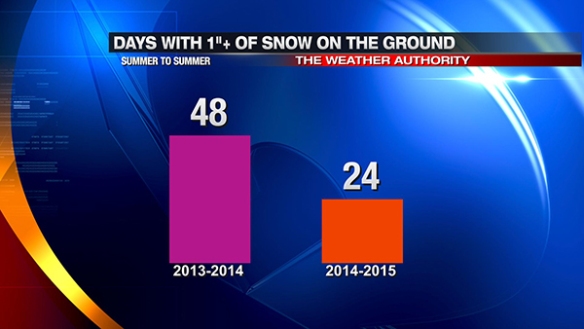
While there have been fewer days with accumulating snowfall this season, storm total snowfall amounts have been bigger in most cases. Through Saturday, there have been 50% fewer days with 1″ or more of snow on the ground compared to 2013-2014’s entire cold season in Cincinnati:

may7-snowdepth

It is highly unlikely that 2014-2015’s count will be anywhere close to 2013-2014’s count. However, the 10″ of snow on the ground at 7am on February 21, 2015 was more than any single day from late 2013 through early 2014.

If you rule out snow, the most common way to measure how brutal a winter was is to compare the average temperature of one meteorological winter (December/January/February) to another. 2014-2015 beat out last winter by 1.25°:

may7-averagetemp

While 1° doesn’t seem like much, that is a significant difference given that the average temperature of the season is the daily average temperature averaged over 3 months.

In the cold season of 2014-2015 so far, there have been 32 days where the high did not reach 32°. That’s two days behind the count from summer 2013 to summer 2014:

may7-below32highs

It is rare from late March through early November to have a high temperature below 32° in Cincinnati, so the current tally of 32 days for 2014-2015 is unlikely to rise much if at all.

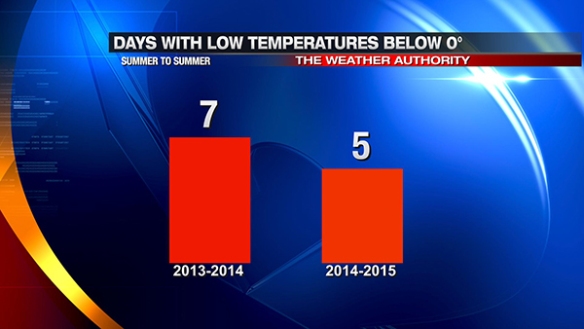
While cold days are inconvenient, cold nights are often more difficult to deal with and are discussed more. In the cold season of 2014-2015, however, there have been fewer days with a low temperature below 0° than last season:

may7-belowzerolows

In my opinion, winter 2013-2014 was worse than winter 2014-2015. For the former, the amount of snow was overwhelming, and the shots of cold were sharper. For the latter, the cold was more prolonged and the winter storms produced more snow. This cold season, however, is bottom-heavy, meaning most of the snow and cold came late (and we’re not done yet). Had December 2014 been colder, this cold season would have easily rivaled the cold season of 2013-2014.

Historical Perspective On The Last Week In Cincinnati

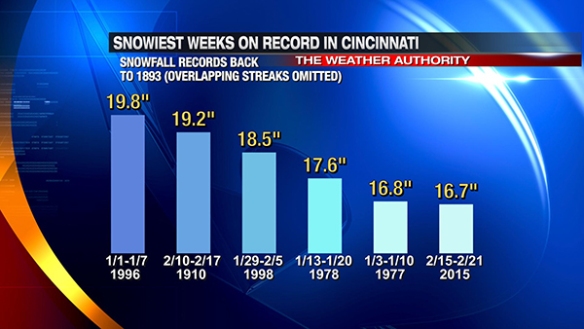
There have been three significant winter storms in the Tri-State during the last 7 days. It is rare to have frequent rounds of heavy snow in Cincinnati. In fact, the last week ranks as the 18th snowiest week on record in Cincinnati. If you omit the overlapping streaks, Cincinnati just had it’s 6th snowiest week since 1893:

feb21-blogsnowiestweeks

February is typically the snowiest month of the year in Cincinnati (with 6.53″ of snowfall on average); January is a close second with an average of 6.51″ of snowfall. Despite being the snowiest month of the year, it is rare to see more than 10″ of snowfall in a week during February; the last 7 days were among the snowiest during February back to 1893 :

feb21-blogsnowiestfeb

This abnormally snowy stretch has pushed us to 5th place on the snowiest Februarys on record in Cincinnati:

feb21-blogsnowiestfebtotals

…and the month is not over. The amount of snowfall recorded at the Cincinnati/Northern Kentucky International Airport in the last 7 days is 92% of the amount of snow that typically falls in all of meteorological winter (December, January, and February combined):

feb21-blogsnowavgwinter

It’s worth noting that more snow has fallen in the first 21 days of February 2015 (18.6″) than falls during meteorological winter on average (18.1″). The snowfall total for meteorological winter 2014-2015 through February 21st is 19.9″.

The seasonal snowfall total through February 21st is now up to 25.0″. On average, 22.5″ of snowfall is recorded in Cincinnati from one summer to the next. All snow that accumulates for the rest of the winter and spring just adds to the surplus.

This winter has been “bottom heavy.” More than double the amount of snow that fell between last summer and February 14th has fallen in the last week:

feb21-snownowvsearlier

“Bottom heavy” describes not just snowfall accumulation this winter, but it also describes cold. If February had ended at midnight on Sunday, February 2015 would be the 8th snowiest February on record:

feb21-blogcoldestfeb

If meteorological winter 2014-2015 had ended at midnight February 21st, it would rank as the 19th coldest back to 1870-1871. There is still plenty of time for our ranking to change, but it doesn’t look like the ranking going to slide down. Saturday morning’s American long-range (GFS) model has arctic air plunging into the Great Lakes and Ohio Valley to start off the work week:

feb21-gfs8ammon

It has another shot of arctic air coming late in the work week:

feb21-gfs8pmwed

Saturday morning’s European long-range (ECMWF) model is similar to the GFS, bringing an arctic airmass into the Ohio Valley and Great Lakes Monday morning:

feb21-ec8ammon

…and another area of arctic air to the Ohio Valley before next weekend begins:

feb21-ec8amthur

The first blast of arctic air will likely bring temperatures of -5° to 5° to the Tri-State early Monday and Tuesday morning. The second blast will bring temperatures back into this range Thursday and Friday morning.

Winter is far from over. At least a few more waves of very cold air and snowy will swing into and through the Ohio Valley during the next 2 months. Temperatures will moderate some in March, but cold will win out for the next several weeks.

Historical Odds Of A White Christmas In Cincinnati

Snow is common during December in Cincinnati, but the odds of getting snow on the ground Christmas morning is lower than you might think.

A “White Christmas” is a Christmas Day where the snow depth at 7am is 1″ or higher. This snowfall amount is rounded to the nearest inch in official weather records. For example, a 7am snow depth of 0.5″ would be recorded as 1″ officially, and a snow depth at 7am of 0.4″ would be recorded as a “trace” officially. With this rounding considered, a 7am snow depth of 0.5″ or more on Christmas Day would mean a “White Christmas.”

7am snow depth records for Cincinnati have been taken since 1916 with one year (1947) missing. Based on weather records, it is hard to say if December 25, 1947 was a White Christmas. The official high temperature that day was 31°, and the low temperature that day was 14°. 0.03″ of precipitation was recorded at the Cincinnati/Northern Kentucky International Airport that day, but the 7am snow depth and the snowfall total for that day are missing. It is highly likely that the precipitation that fell that day was snow or nearly all snow. A 10-to-1 snow-to-liquid ratio would mean 0.3″ of snow fell that day. The snow-to-liquid ratio that day, however, is unknown.

At the time, official records were taken at the International Airport. However, weather records taken at the National Weather Bureau office in downtown Cincinnati suggest 1947 may have had a White Christmas:

dec21-wsorecords

At 7:30pm on December 25th, 1947, 0.5″ of snow was reported on the ground in downtown Cincinnati. 0.8″ fell that day, but it is unclear whether the 0.5″ of snow on the ground at 7:30pm that day was also on the ground at 7am Christmas Day. Regardless of what happened at the Weather Bureau office, it is not part of the official weather record for Cincinnati.

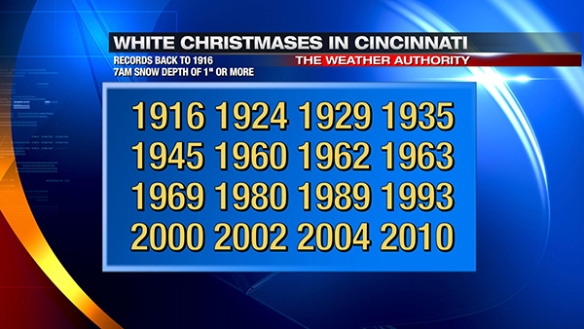
If you throw out Christmas Day 1947, there have been 16 White Christmases in Cincinnati since 1916:

dec21-whitexmaslist

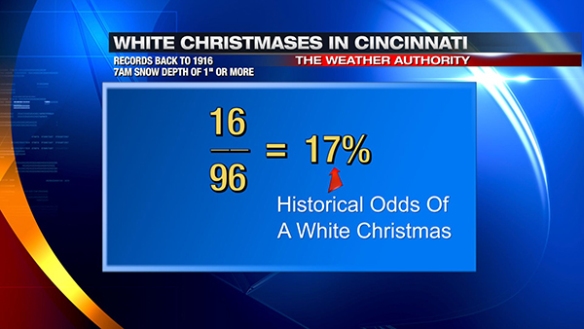
16 White Christmases in 96 years worth of records shows there is, historically, a 17% chance of a White Christmas in the Queen City:

dec21-whitexmasmathnew

If you say 1947 was a White Christmas, there is, historically, a 18% chance of a White Christmas in Cincinnati:

dec21-whitexmasmathcounting1947

The math gets even more complicated if you include Christmas Day of 1992, which is the only year since 1916 where there was no snow on the ground at 7am but 1″ or more fell on that day after 7am. You could make an argument that 1992 had a White Christmas; if you believe it counts, the historical odds go up to 19%.

These historical odds are long-term. In the last 10 years, there have been 2 White Christmases in Cincinnati:

dec21-recentsnowdepths

The long-term average and the last 10 years suggest that a White Christmas happens in Cincinnati about once every 5 years. Back to 1916, the highest 7am snow depth recorded in Cincinnati on Christmas Day was in 2004 (9″).

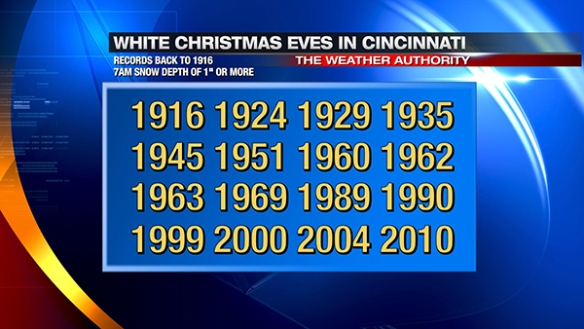
Historically, the odds of a White Christmas Eve are about the same, but the years with a White Christmas and White Christmas Eve don’t always match up. Here is the list of years with 1″ or more of snow on the ground on Christmas Eve in Cincinnati:

dec21-whitexmasevelist

Weather records for Cincinnati are messy, but history suggests there is a 15 to 20% chance of a White Christmas any given year in the Queen City. We will know more about the likelihood of a White Christmas this year in the hours and days to come.

Cold Air, Snow Chances Coming To The Tri-State Soon

October and November are transition months in the Tri-State. The first frost and freeze of the season almost always occur in at some point in these two months. The first flakes of the season often fall in October or November. We’ve already had our first frost, freeze, and flakes. The next item on the list is the first accumulating snow of the season; the opportunity for accumulating snow comes this weekend.

To get snow, we need cold; we will have plenty of that later this week. Despite what you may have heard, the “polar vortex” is not coming behind Tuesday’s front. The polar vortex is an upper-level feature; it lives in the stratosphere (the layer of the atmosphere above the one we live in) and occasionally dips down into the upper troposphere (the layer of the atmosphere we live in and where weather occurs). Sunday morning’s European (ECMWF) Ensemble model mean places the polar vortex (labeled as “PV”) near the North Pole, well away from Cincinnati (the purple dot):

nov9-pv

While this drop in temperatures later this week is being called everything under the stars, the reality is that the jet stream is just headed south. When you’re north of the jet stream, it’s relatively cold; when you’re south of the jet stream, it’s relatively warm. The jet stream is a fast moving current of air 35,000-45,000 feet above the ground that is trying to restore a balance in the atmosphere by bringing cold air south and warm air north.

I believe we’ll reach into the upper 50s and lower 60s both Monday and Tuesday afternoon with winds sustained out of the southwest. Tuesday and Tuesday night will be the transition period in the week ahead. A cold front moving through the Ohio Valley will push temperatures from the 60s Tuesday afternoon into the 30s by Wednesday morning. Some models give us scattered rain showers Tuesday, while others give us a well-defined line of rain. At this point, I believe most will see light rain Tuesday and Tuesday evening, but there is some uncertainty on the coverage of rain.

The cold air pouring into the Ohio Valley, Mississippi Valley, and Great Lakes later this week will not warm much as it nears us thanks to a fresh snowpack being put down ahead of it from the Dakotas to the Upper Peninsula of Michigan:

nov9-rpmsnow

Areas in the white and blue shades will see anywhere from a few inches to a couple of feet of snow of the ground by Wednesday afternoon. Without this snowpack, high and low temperatures in Cincinnati later this week would be warmer.

Highs are forecast to be in the mid to upper 30s Thursday, Friday, and Saturday. While this is abnormally cold for mid-November, it is not unprecedented. Here are the lowest high temperatures recorded in Cincinnati on November 12 (Wednesday) since 1870:

nov9-12threcords

The record lowest high temperature for November 13 (Thursday) is 29°, and I don’t foresee that getting broken or tied:

nov9-13threcords

Since 1870, high temperatures have only hit the low 30s a couple of years in Cincinnati on November 14th (Friday):

nov9-14threcords

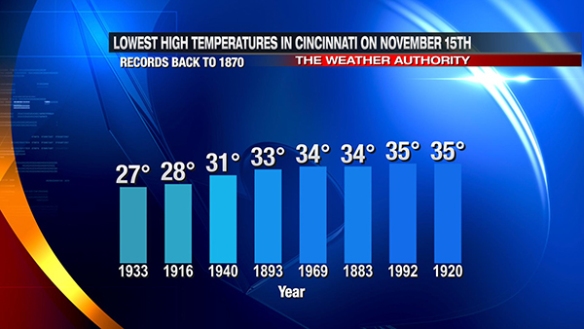
It appears unlikely that a new minimum high temperature record will be set on November 15th (Friday):

nov9-15threcords

While it will be very cold, all of these graphs suggest record-breaking cold is unlikely later this week.

After some flurries Thursday, our attention returns to a system developing late in the upcoming weekend. At long range, it is not uncommon for models to disagree on the timing and strength of systems; this upcoming event is no exception.

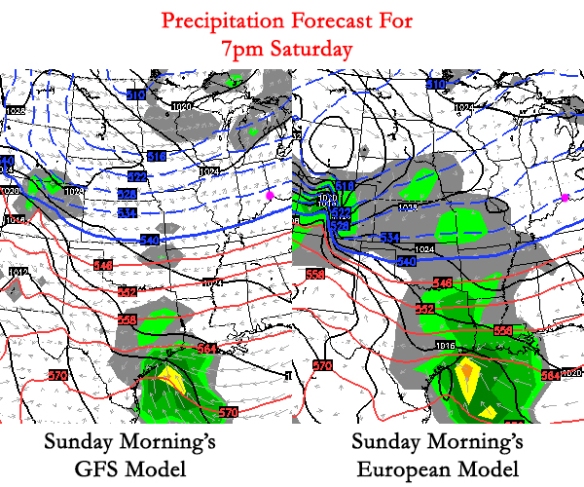
Sunday morning’s GFS (American) and ECMWF (European) models disagree on the coverage of precipitation when the disturbance is moving out of the Rockies and into the Plains. The GFS model keeps much of the Plains dry, while the ECMWF has precipitation falling from Iowa to the Gulf Coast (Cincinnati is the purple dot):

nov9-gfsec7pmsaturday

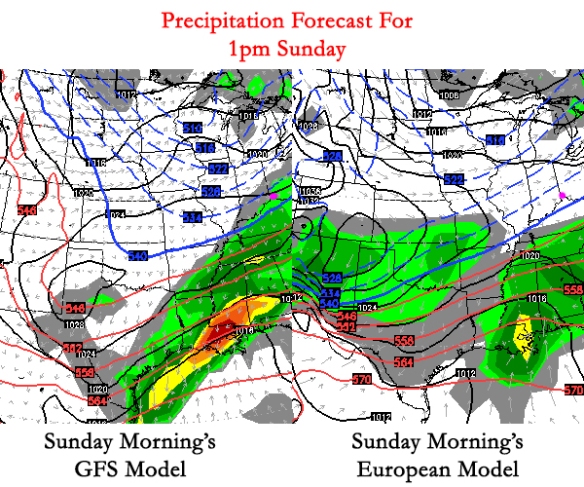
Any errors in the forecast model at this time will likely degrade the quality of the forecast beyond this time. As an example: Sunday morning’s GFS and ECMWF models disagree on if precipitation will be falling in Cincinnati at 1pm Sunday:

nov9-gfsec1pmsunday

The forecast gets even more complex into next Monday. Sunday morning’s GFS models says precipitation will be to our east, while the ECMWF model still has precipitation in the area:

nov9-gfsec7ammonday

Clearly, there is uncertainty in the strength, timing, and positioning of this system. If precipitation falls on Sunday or Monday, models are in agreement that this preicpitation will likely be snow given temperatures in the 30s near the ground and in the teens and 20s just a few thousand feet above the ground. Confidence in the overall forecast will rise and specifics will be resolved with time.

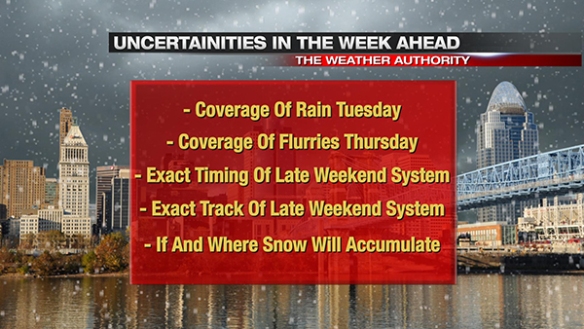
Here is a summary of forecast uncertainties in the week ahead:

nov9-uncertainities

While nearly all of the uncertainty in the week ahead deals with the area of low pressure a few days from now, there is a high confidence that the following will happen between now and next Monday:

nov9-knowns


Cold Coming Next Week, But Not Worth Overhyping

Like every blast of cold air in recent winters, there is already a big social media buzz about temperatures next week. Yes, it will be cold, but what comes next week is not unprecedented for early to mid-November.

In the longer range, I like to use ensemble forecast models to gauge the strength and positioning of cold. Ensemble forecast models are models made up of smaller models with the initial conditions changed slightly. All of these smaller models are run and may or may not produce slightly different results. A low spread in the solutions of an ensemble forecast model suggests a higher confidence that a certain weather event or pattern will happen; a high spread suggests a lower confidence forecast. In addition to looking at one ensemble model, a meteorologist can use other ensemble models and compare them to measure the confidence of a forecast. Ensemble models are often more reliable than other forecast models – especially a few days to a couple of weeks into the future – because outlier members of the ensemble models are easy to spot and can be discounted if needed.

What does the average (mean) of these ensemble models say will happen by Sunday morning?

7amsunday

This morning’s GFS (American) ensemble mean suggests temperatures roughly 5,000′ above the ground will be in the low 30s (-1°C) at 7am on Sunday morning, while the ECMWF (European) and CMC (Canadian) ensemble mean suggests temperatures a few thousand feet above the ground will be in the low to mid 20s (-3° to -6°C). Forecasting temperatures just above the ground are often easier to forecast than close to the ground due to uneven heating of the ground and terrain. Clearly, there is a large spread on what the temperature 5,000′ above the ground will be at 7am Sunday; this suggests there is limited confidence in the temperature forecast this weekend. Current thinking is that surface temperatures will be in the upper 20s and lower 30s early Sunday morning, but this forecast may change depending on the trend of models.

Before we go forward, know that errors in the each of the models will be compounded with time. A large bust on a temperature forecast from a model this weekend will likely mean a large (or even larger) bust on the temperature forecast for next week.

What does the mean of the ensemble models say will happen by next Thursday morning?

7amthursday

There is reasonably good consensus with Wednesday morning’s ensemble model runs that temperatures 5,000′ over Cincinnati will be around -9°C (16° F). Accounting for the fact that temperatures are usually colder aloft than at the ground, cloud cover, and the rate of temperature changes near the ground, these maps support low temperatures in the 20s. Temperatures aloft rise a couple of degrees during the day Thursday, but there is some uncertainty in the cloud cover and precipitation coverage (if any at all). All things considered, highs will likely be in the 30s and/or 40s Thursday.

Since 1870, the high temperature in Cincinnati hasn’t hit 40° 12 years on November 12th, 11 years on November 13th, and 19 years on November 14th. In other words, the historical odds of not making it to 40° on any one of these days is 8 to 13%.

As a mentioned above, there are uncertainties in cloud cover and precipitation timing next week. Look at the differences in the upper-level flow for the second half of next week. The GFS Ensemble has a ridge in the western United States and a trough in the eastern United States, but the positioning of the trough looks to be too far east and likely moving through the U.S. too quickly:

gfsulf

The ECMWF Ensemble has the trough and the ridge both farther west by 7am Friday, but likely doesn’t have the ridge strong enough in the western United States (which I’ll explain why below):

ecmwfulf

I think the CMC (Canadian) Ensemble has the right idea: a strong ridge in the western United States, a strong trough in the Pacific Ocean, and a strong trough in the eastern United States:

cmculf

Why do I the think the ECMWF Ensemble ridge in the western United States is too weak? Because tropical activity in the Pacific suggests strong ridges and troughs near and over North America.

Meet the leftovers of Typoon Nuri in the Pacific Ocean (satellite shot as of 9:30pm ET Wednesday). Nuri is the mass of clouds (bright colors) the upper-right hand part of this image:

nurisat

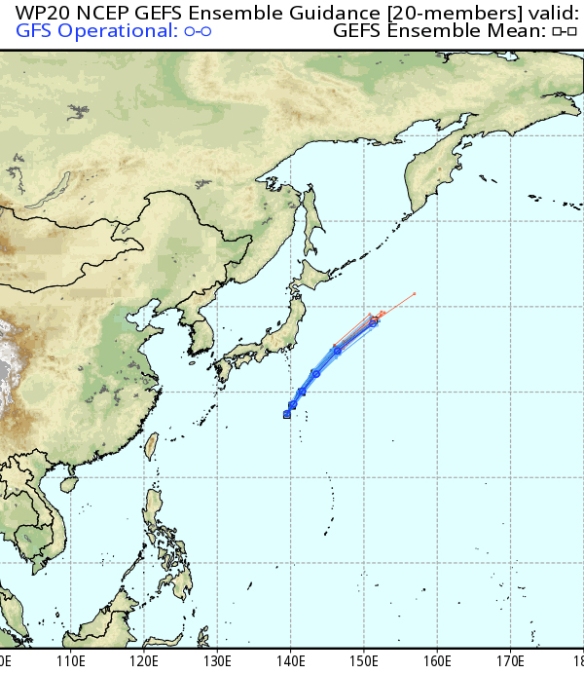
Note southeastern Asia on the left side of this image. Nuri will be a troublemaker. The GFS ensemble suggests Nuri is headed northeast:

nuri

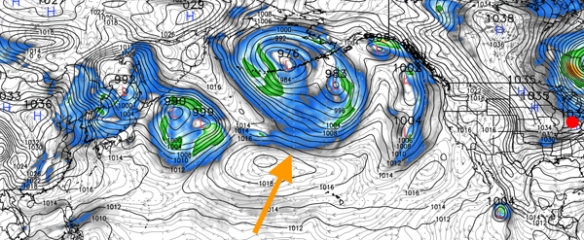
It is forecast to bomb out over the northern Pacific Ocean later this week. The surface low of “once Nuri” will die out next week, but the upper-level low of this system will likely spin over southern Alaska or in the northern Pacific Ocean, as the ECMWF model shows by next Wednesday (pointed out with the arrow, Cincinnati is the red dot):

pac

This area of low pressure positioned where it is supports a ridge of high pressure just to the east of it, and a trough to the east of the ridge. This is very similar to what the CMC Ensemble above shows. The exact track and fate of this Pacific low can impact how cold we get next week.

For now, know that next week will be cold, but highs in the 30s and 40s are not uncommon in mid-November. Remember, we had a high of only 42° in Cincinnati this past Saturday.

The First Snowfall Of The Season In Cincinnati

A trace of snowfall was recorded at the Cincinnati/Northern Kentucky International Airport on Saturday. A trace of snowfall in the records means snowflakes fell from the sky, but less than 0.1″ of snowfall accumulated (if any at all).

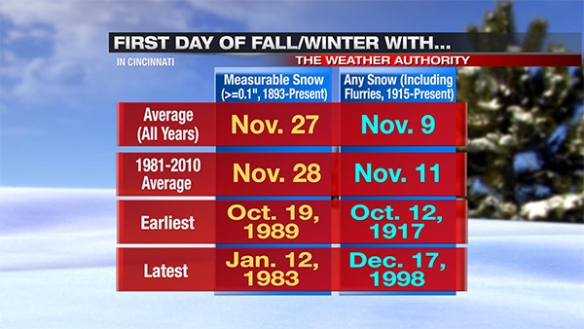
The first snowflakes of the fall and/or winter in Cincinnati usually fall in late October or November. On the first day that snowflakes fell during the fall and/or winter in Cincinnati, only 21 of the last 100 years reported snowfall accumulation (0.1″ or more) on that day; in other words, the first snowflakes of the season usually don’t stick because the ground is too warm.

Here are the average, earliest, and latest snowfall dates with measurable snowfall and any snow in the Queen City…

nov1-firstdates

Note measurable snowfall records go back to 1893, but I have limited the “any snow” (at least a trace) record back to 1915. It is also worth noting that official snowfall records for Cincinnati have been kept in three different places since 1893:

-1893-1915: Downtown Cincinnati at the National Weather Service/Bureau office
-1915-1947: Abbe Observatory in Clifton
-1947-Present: Cincinnati/Northern Kentucky International Airport

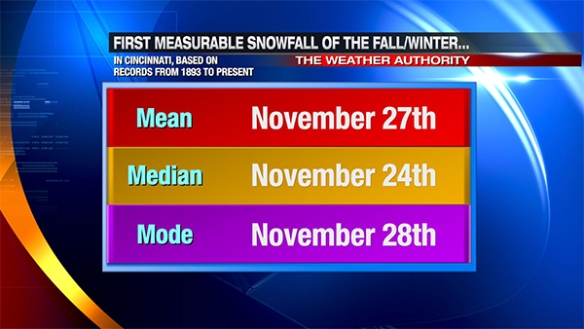
The averages and the range of dates can be helpful, but there are more than two ways to measure the first snowfall of the season. Statistically, the most common ways to measure the “center” of a set of data are involve taking the mean, median, and mode. Simply put, the “mean” is the average, the “median” is the “center” value in the chronological list, and the “mode” is the most common value occurring in the list. For example, here are the mean, median, and mode dates for the date when the first snowflakes fall during the fall/winter in Cincinnati:

nov1-mmmanysnow

Historically, the first measurable snowfall of the season comes 2 to 3 weeks after the first snowflakes of the season fall from the clouds:

nov1-mmmmeasurable

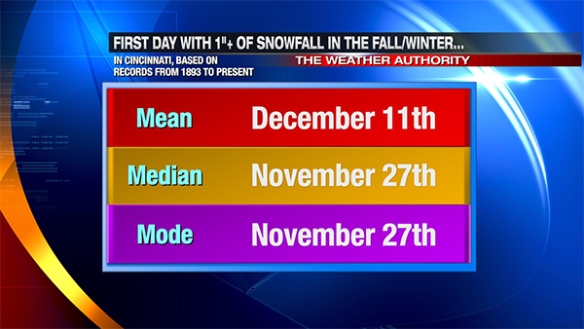
The first day of the fall or winter where 1″ or more of snowfall accumulation occurs in Cincinnati is in usually not far behind the first day of the season with measurable snowfall; sometimes, they are on the same day. Here are the mean, median, and mode for the first day of the fall and/or winter in the Queen City where 1″+ of snowfall accumulates:

nov1-mmm1inch

The first day of 1″+ of snowfall accumulation in Cincinnati has come as early in the fall as October 19 (1989, 5″) and as late as March 5 (2012, 1.5″, two dates after the deadliest tornado outbreak on the Tri-State on record).

Seeing accumulating snowfall earlier than average in the fall does not necessarily mean a snowier than average winter is on the way.

Overall, I believe this upcoming winter will be snowier and colder than average in Cincinnati. Compared to last winter, I believe winter 2014-2015 will be colder but not as snowy as the winter of 2013-2014.

Everything You Need To Know About Fall Frost In Cincinnati

Low and high temperatures have been above average the last few days in the Queen City, but the latest computer guidance suggests cool, Canadian air will arrive by next weekend. While there is no imminent threat for frost with this next shipment of cool air, the likelihood of frost will rapidly increase over the next month.

When forecasting frost, a meteorologist often looks for a very light or calm wind, a mostly clear to clear sky, and temperatures dropping into into or below the upper 30s early in the morning. Frost can form with air temperatures dropping into the mid and upper 30s; temperatures to or below 32° are not needed for frost. Why? The answer to this has to do with how temperatures are measured.

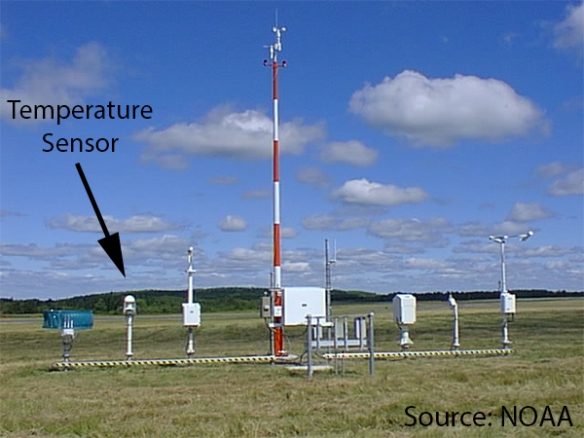
The piece of equipment used to measure weather conditions at most airports in this country – called an Automated Surface Observing System or ASOS – measures the temperature 2 meters above the ground.Here is a picture of an ASOS and where the temperature sensor is located:

sep28-asos

Because relatively cold air sinks and warm air rises, temperatures below this sensor are always colder than temperatures at the sensor. For example, the sensor may measure at air temperature of 36°, but the temperature at the ground may be 32° or lower. Patchy frost can form at the ground when the temperature at the sensor drops to 38°.

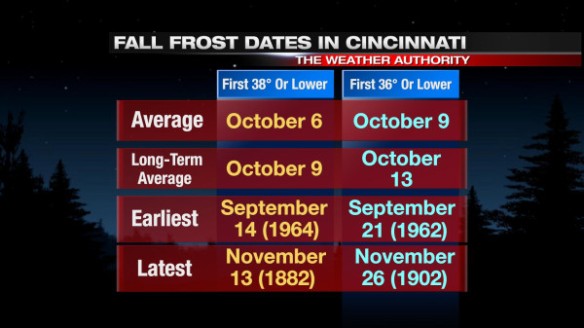
The first frost of the fall in Cincinnati almost always occurs in October; while the exact temperature where frost occurs can vary, using a temperature of 36° or 38° yields roughly the same dates on average:

sep28-fallfrost

The first frost has occurred as early as mid September and as late as late November.

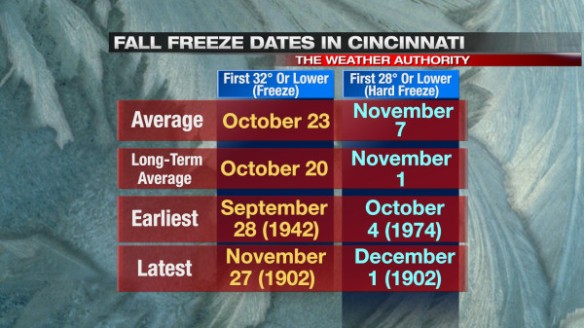
Frost does not necessarily mean the end of the growing season, but frost can easily kill plants – especially if they are sensitive to cold. A freeze or hard freeze signals the end of the growing season for all seasonal vegetation. On average, the first freeze or hard freeze of the fall in Cincinnati occurs in late October or early November:

sep28-fallfreeze

Note that a freeze has occurred as early as late September, and a hard freeze has occurred as early as early October.

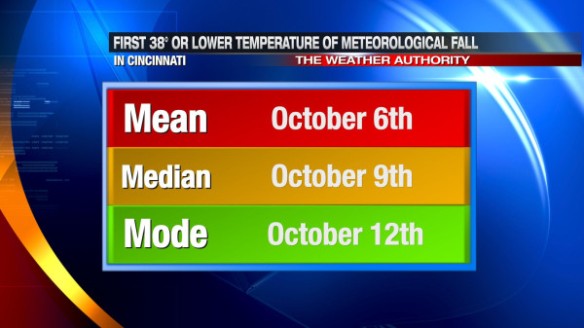
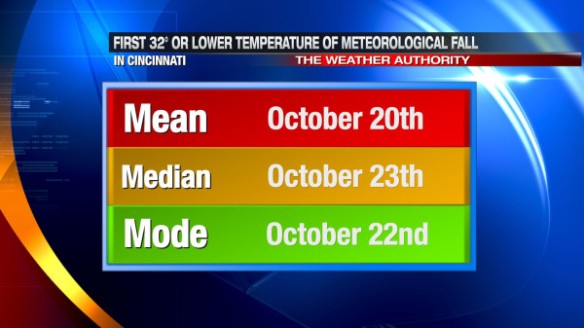
The averages and the range of dates can be helpful, but there are more than two ways to measure first fall frost dates. Statistically, the most common ways to measure the “center” of a set of data are involve taking the mean, median, and mode. Simply put, the “mean” is the average, the “median” is the “center” value in the chronological list, and the “mode” is the most common value occurring in the list. For example, if we assume the first fall frost occurs when the temperature (measured 2 meters above the ground) drops to 38°, here are the mean, median, and mode dates for the first fall frost in Cincinnati:

sep28-mmm38

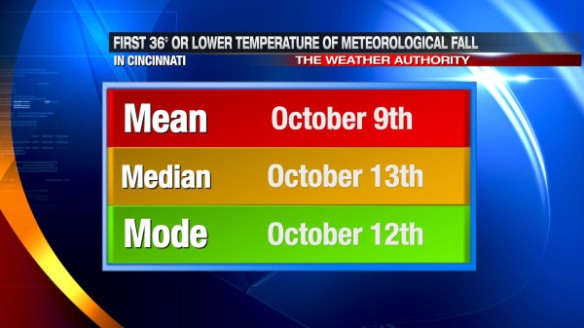
If we assume the first fall frost occurs when the temperature drops to 36°, here are the mean, median, and mode dates for the first fall frost in Cincinnati:

sep28-mmm36

These averages are based on data from 1871 to 2013. What is the mean, median, and mode date for our first freeze?

sep28-mmm32

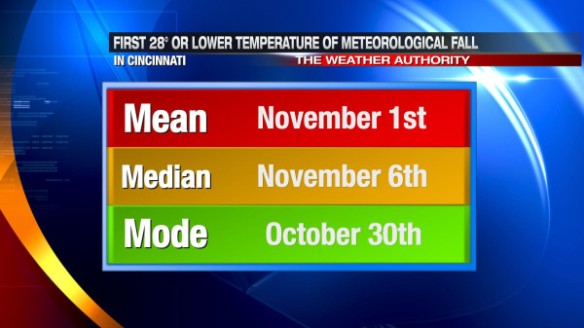
The mean, median, and mode dates for the first hard freeze in Cincinnati are:

sep28-mmm28

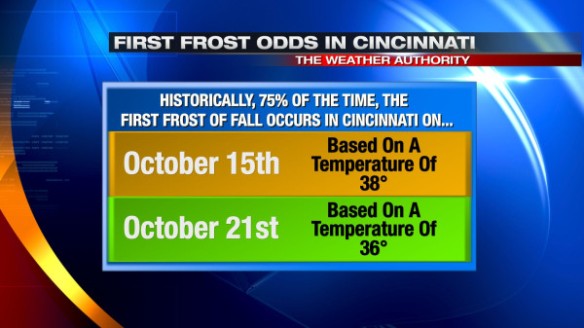
Historically and statistically, if you assume the first fall frost occurs when the temperature drops to 38°, there’s a 75% chance we get our first frost by October 15th. The date slides about one week later if you use 36° as a temperature:

sep28-percentile

At this point, the cold blast coming in the wake of Friday’s cold front does not look to bring widespread frost to the Tri-State. Longer-range computer guidance suggests temperatures will warm back near or above average by the middle part of next week. Beyond the first full week of October, guidance suggests waves of cold air will gradually push southeast from southern Canada. While the first of these series of cold blasts may not bring frost, reinforcing shots of cold, Canadian air in October suggests our first fall frost will come very close the historical average date.

What Happened To Tuesday Night’s Forecast?

As you probably noticed, the chance for showers and storms in the Tri-State Tuesday night was overdone. Even on-air at 5pm Tuesday, I mentioned a threat for severe weather – especially west of Cincinnati – and scattered showers and storms. I played the threat down on-air tonight, but the radar tonight suggested I didn’t play it down enough.

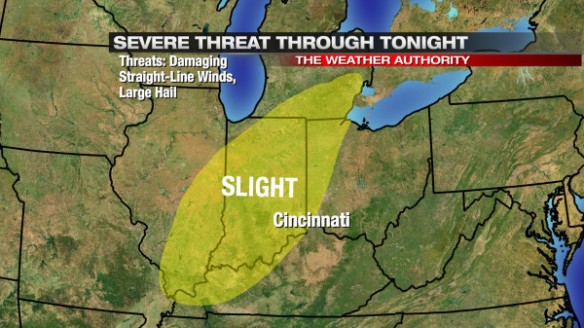
At 2pm Tuesday, the Storm Prediction Center had the western half of the Tri-State and most of Indiana under a slight risk for severe storms:

aug18-svr2pm

As a broadcast meteorologist, you need to present this threat, even if you don’t fully agree with the Storm Prediction Center. I’ll agree with the Storm Prediction Center that there was adequate low-level moisture, warmth, and instability available for thunderstorms to form and become strong or severe.

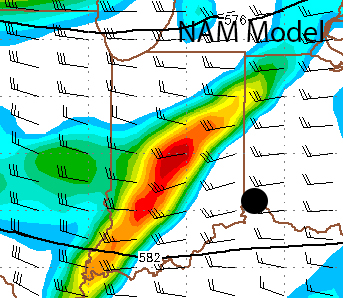
The missing piece – or at least the piece that was most in question – was the upper-level support. Tuesday morning’s NAM model showed the upper-level disturbance (yellow/orange/red) approaching Cincinnati (the black dot) at 8pm Tuesday:

aug18-namvort

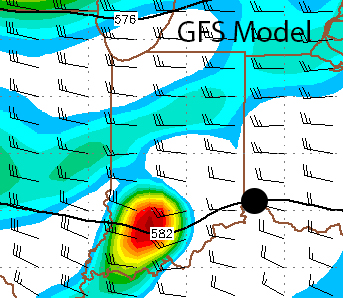
Ahead of a disturbance like this, lift in the atmosphere increases, and the chance for storms – including severe storms – increases. Tuesday morning’s GFS model showed a disturbance of similar strength approaching the Tri-State at 8pm Tuesday:

aug18-gfsvort

Two models showing a disturbance moving through the Ohio Valley raises confidence about the coverage and intensity of showers and storms. The GFS model was farther south with the disturbance, and the NAM model had the disturbance more spread out.

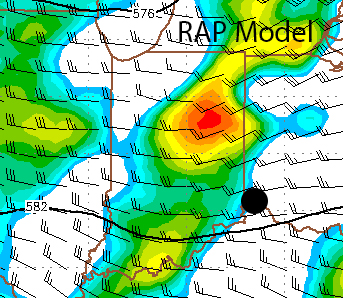
It is hard to verify exactly where these disturbances were Tuesday evening (given they are 18,000 feet above the ground), but the 9pm run of the RAP model (which updates every hour) is our best hope for verification. Here’s where it placed upper-level disturbances at 10pm Tuesday night:

aug18-rapvort

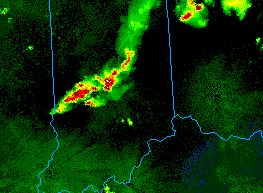
Clearly, the RAP has the strongest disturbance northwest of Cincinnati and has it more compact than the NAM model. Showers and storms developed well to the northwest of Cincinnati on the nose of the upper-level disturbance Tuesday afternoon, and outflow from the early evening storms supported new storm development through late evening (as 11pm Tuesday radar shows):

aug18-11pmradar

Models clearly missed the mark, and as a result, the forecast could have been better. Just like in the winter where the exact track has a big impact on snowfall totals, the track of this disturbance had a big impact on the placement and strength of showers and storms.


My Take On Upcoming SPC Severe Weather Risk Changes

For years (really decades), the Storm Prediction Center has issued severe weather risks for the contiguous United States using “slight,” “moderate,” and “high” risk categories. Areas of the country that are most likely to see severe weather are typically placed under a “slight” risk for severe storms at least several times a year, a “moderate” risk up to a couple of times per year, and a “high” risk once every year or two when a major severe weather outbreak is expected.

But all of this is about to change. The 3-categories currently used to classify severe weather will soon expand to 5-categories.

In this interview, Greg Carbin with the Storm Prediction Center says “in the modern era, with the Internet, anybody can look at these [severe threat] graphics. So it’s our responsibility to convey that risk information in a way that’s a little easier to understand for the lay person as opposed to the expert. […] What we are hoping to do with these categories is convey that risk with meaningful words, colors, and numbers.”

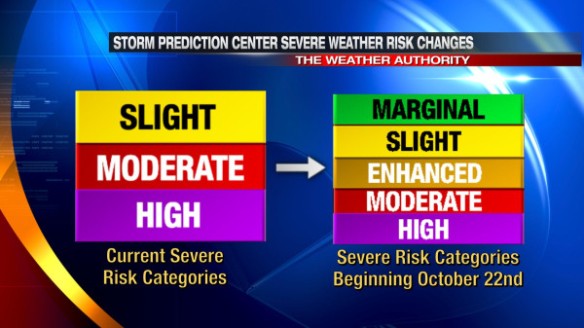
What does this change look like? Here’s a breakdown of what the severe weather risk categories are now and what they will be beginning October 22nd:
aug17-spc-oldnewcategories

In simple terms, the “moderate” and “high” risk categories really won’t be changing this fall, and the current “slight” risk category will be broken down into 3 different categories (marginal, slight, and enhanced). Technically, the “marginal” risk will be a new category just under the current “slight” risk category.

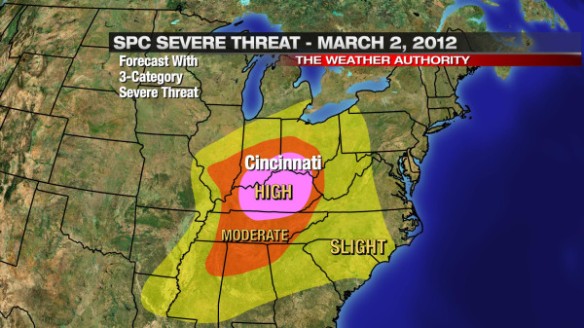
Higher-end risks will still be higher-end risks. Late in the morning of March 2nd, 2012, the Ohio Valley was covered with a “moderate” to “high” risk for severe weather:
aug17-spc-march2old

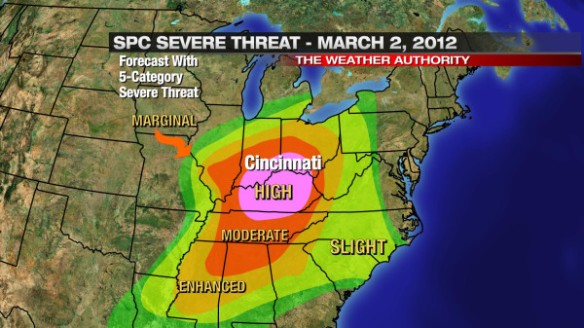
Had this same severe weather outlook been issued using the 5-category severe weather outlook coming this fall, the risk for severe weather in the heart of Ohio Valley would have been the same:
aug17-spc-march2new

The risk for severe weather would have been labeled differently for the northern Indiana, northern Ohio, and parts of the Tennessee Valley.

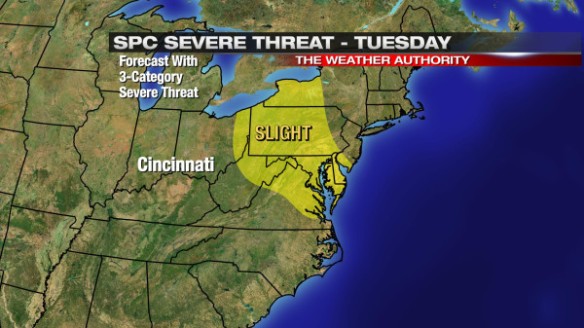
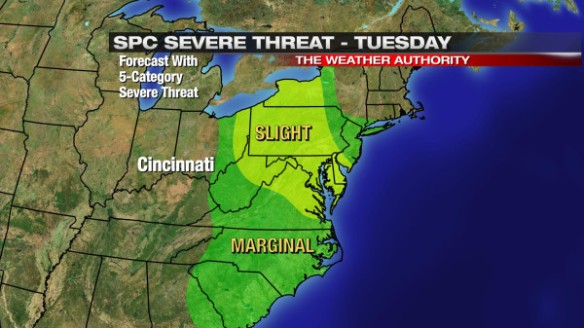
The changes from SPC were really made to break down lower-end severe weather threats more. Last Tuesday morning, a “slight” risk for severe storms was issued for much of New England:
aug17-spc-tuesdayold

Had this same outlook been issued using 5 severe weather categories, a “marginal” risk for severe storms would have surrounded the “slight” risk from central New England through the Carolinas:
aug17-spc-tuesdaynew

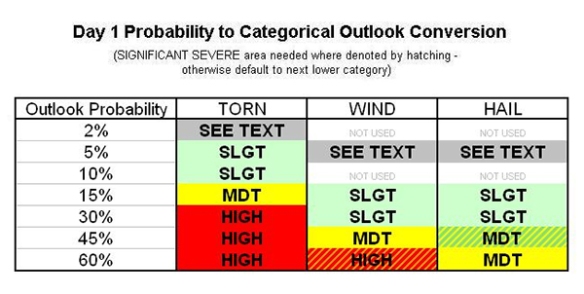
If you’re confused with all of the changes, you’re not alone. If you’re confused by the current outlook categories, I understand that, too. Here’s the probability table (based on a severe weather report occurring within 25 miles of a point) used by SPC forecasters to draw the severe weather threat for the current day:
aug17-spc-currentday1
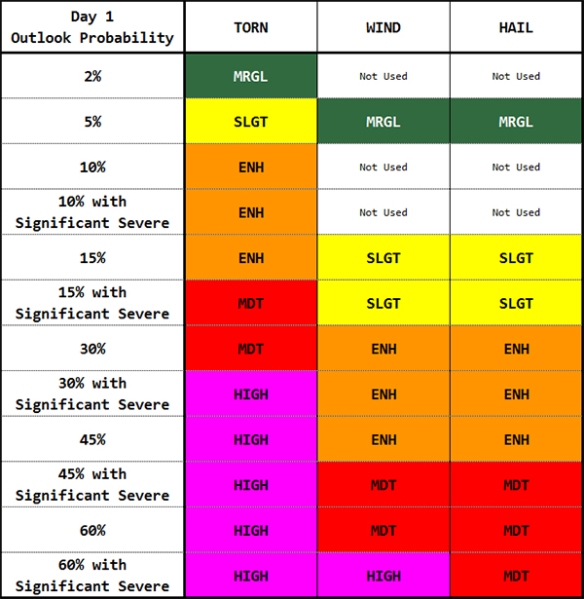
If you think that’s messy, here’s the probability table SPC forecasters will use to issue severe weather outlooks beginning October 22nd:
aug17-spc-futureday1

There are different tables for days 2 and 3 of the forecast. Making these forecasts is a challenge given model uncertainties and forecast time constraints. Creating these outlooks is not an easy job.

Why are the outlooks changing? I’m not entirely sure, and I don’t think the public does either.

I’m not so sure a change is needed here. More importantly, I’m not so sure the general public is familiar with and/or understands the current outlook categories and knows what the outlook categories mean. Changing what people don’t know by heart will likely come with a sense of confusion and questions about why there was a change.

Ultimately, this change should benefit the public, but I don’t think it will. Introducing new categories does not necessarily mean better understanding. As the tables above show, there is a lot that goes into placing a part of the country under a “slight,” “moderate,” or “high” risk. The public doesn’t understand the math behind each of these risks, but the subjective reasoning behind these risks isn’t common knowledge either. What does a “slight” risk really mean for my family? Honestly, meteorologists may disagree on what it takes for the Storm Prediction Center to issue a “slight” risk for severe weather in a given part of the country. If the lines are blurred or slightly blurred in the meteorological community, how will the public understand?

I don’t know of a meteorologist that knows the probability tables above like the back of his or her hand. I also don’t know of a meteorologist that had a complaint about the current SPC severe weather outlooks. There was no outcry to make a change from the meteorological community (at least not one that I knew of).

So why was there a change? The devil is in the details.

Over the years, there have been a lot of severe weather events that have occurred outside or barely inside of “slight” risk areas. A great example of this is the Evansville/Newburgh/Henderson F3 tornado of November 6, 2005. That area was in a 2% tornado risk area (not high enough alone to warrant a SPC “slight” risk) at 6:59pm on the evening of November 5, 2005. At 2am on November 6, 2005, the F3 tornado began near Henderson, Kentucky and continued through Evansville and Newburgh, Indiana. The tornado killed 25 and injured dozens. Outside of Tornado Warnings issued by NWS Paducah, there was really no suggestion from SPC that a deadly tornado would happen that night. This was a big “oops” moment from the Storm Prediction Center. If the severe hail and wind threat were non-existent, this 2% tornado area would have been in a “marginal” risk for severe storms given the new outlook categories coming this fall, and perhaps some would have paid attention to this tornado risk. Placing areas in a “marginal” severe risk may cause more to take the risk for severe weather seriously, but it may also lead to more “false alarms.” How many “marginal” SPC risks with no damage will it take before people ignore them and/or higher severe weather threats?

The names of the categories also bother me. A “marginal” risk downplays the severe weather risk when the potential is there – be it small – for something significant to happen. Also, how is an “enhanced” risk higher than a “slight” risk for severe storms? More importantly, what are the differences in the risk, and do the category names clearly suggest a difference in the severe weather threat? Did the SPC ask the opinion of social scientists to ensure their category naming convention would resonate with the public?

Discussing the severe weather risk categories with the people of Cincinnati on Fountain Square last week made me realize that people want information as simplified as possible when it comes to storms. Many I spoke with didn’t understand the need for SPC to change the categories. Many didn’t understand what “slight,” “moderate,” and “high” risks for severe weather really meant. Many don’t want to try and understand 5 different severe weather categories. Many just want to know how bad the weather is going to be on any given day or how it will impact their daily routine. These conversations reminded me that simple is better when it comes to discussing weather.

When I think of SPC expanding the severe weather threat categories to five, I think of the Homeland Security Advisory System, which was discontinued in 2011:

HSAS

People never knew what the categories meant, and Secretary of Homeland Security Janet Napolitano said the scale provided “little practical information” when she phased out the scale in 2011. Let’s hope the SPC’s 5-category scale finds more success the DHS’ scale which was uninformative, nondescript, and unhelpful.