This Week’s Heat Wave: What It Is And What It Isn’t

A lot of time in my recent weathercasts has been dedicated to a heat wave coming this week. Given the lack of heat so far this summer, there is high confidence that this will be the longest and biggest heat wave of the year. This heat wave, however, will not be among the worst we have seen, including heat waves we had in 2012, 2011, and 2007.

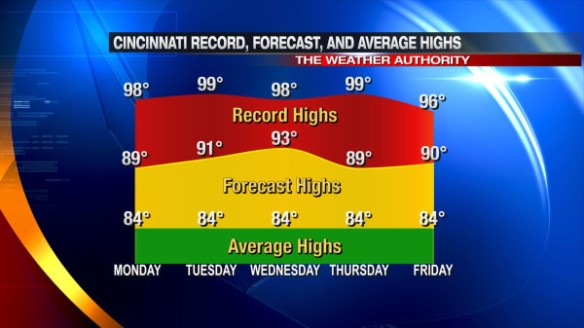
Here is how forecast high temperatures for the next 5 days in Cincinnati compare to average and record high temperatures:

aug25-forecastavgrecords

Notice that high temperatures will be several degrees above average but also short of record highs each day Monday through Friday.

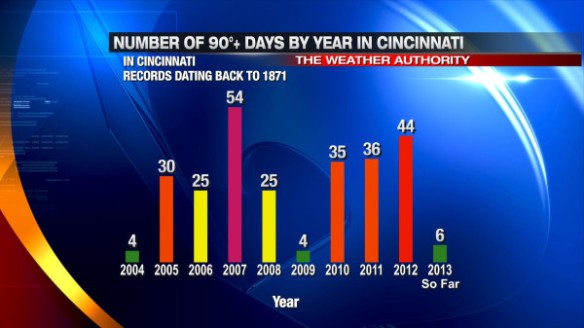
The high temperature has only hit 90° 6 days so far in 2013. With the heat from 2012 and 2011 fresh in our minds, this summer seems unusually cool. While this is true, we had even less 90°+ heat in 2004 and 2009:

aug25-90countbyyear

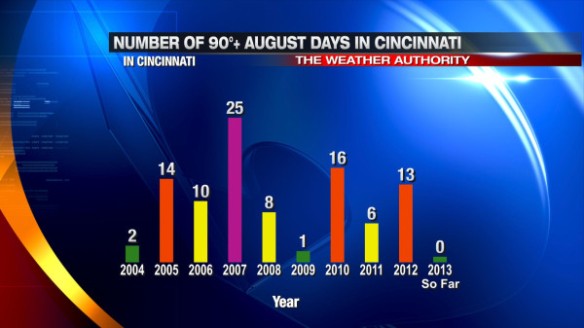
When you focus on just the month of August, the 90°+ day count is abnormally low so far (0 90°+ days so far this month):

aug25-90countaugust

We will hit 90°+ at least a few times in the next week, but we will come nowhere close to getting the 90°+ heat like we had in 2012, 2010, or 2007.

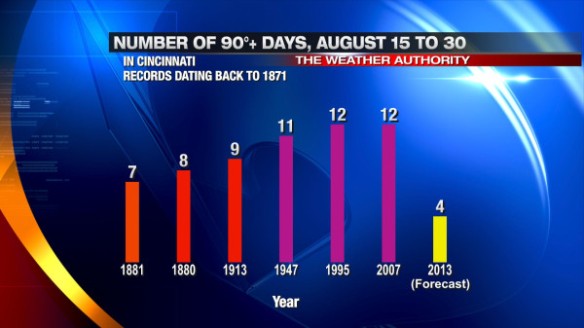
Is 90°+ heat unusual in late August? The simple answer is no. If you focus on just the last half of August (August 15th to 31st), our 90°+ count this year (forecast to be 4 days) will be will fall short of 2007, 1995, and several other years:

aug25-90countlateaugust

There is no doubt it will be hot and humid in the week ahead, but we’ve seen much worse in late August. Stay hydrated and cool in the week ahead!

Does A Colder Than Average Summer Mean A Colder Than Average Winter?

There have have been a lot of questions surfacing recently about whether the lack of heat this summer means the winter of 2013-2014 will be colder or snowier than average. I was at a speaking engagement last last week, and one of the few questions that came up was about what the fall and winter forecast.

Global patterns change frequently throughout the year. Many of the oscillations that occur in the atmosphere (that help to drive major weather systems) usually complete an oscillation on the scale of days, weeks, or months. As a result, it is very difficult to look at one season and use it to forecast another. Climatologists and meteorologists often make seasonal forecasts based on analogs, or years that have a similar setup to a certain pattern; however, there is rarely – if ever – a perfect match.

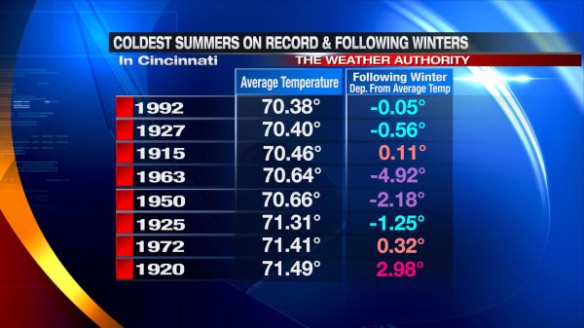
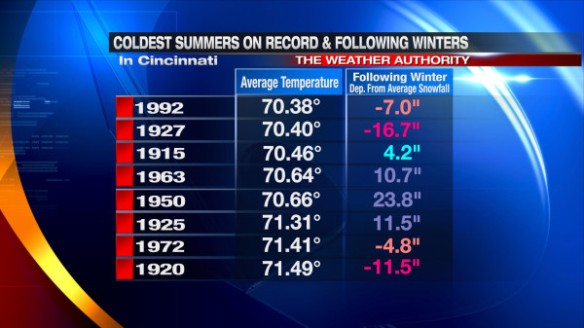
If summer 2013 had ended at midnight (on August 20th), summer 2013 (beginning June 1st) would only be the 35th coldest on record in Cincinnati. Weather records for Cincinnati go back to November 1, 1870, so it’s tough to have a “top 10” or “top 20” year for snow, rain, cold, or heat. When you compile a list of the coldest summers on record in Cincinnati and look at the temperature departure from average in the winter (December 1st to January 31) that followed, here’s what you’ll find:

aug20-coldestsummers

The numbers in blue highlight a slightly cooler than average winter, the purple numbers show a much cooler than average winter, the tan numbers spotlight a slightly warmer than average winter, and the pink numbers highlight a much warmer than average winter.

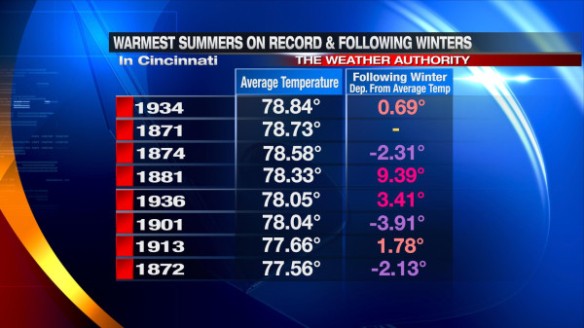
Many of the winters following the coldest summers on record were colder than average, but that wasn’t always the case. You’ll notice the same “sometimes but not always” thinking applies to the winters following the warmest summers on record in Cincinnati:

aug20-warmestsummers

Does a colder than average summer mean we’ll mean a snowier than average winter is coming? Not necessarily. Here all the coldest summers on average and the snowfall departure from average in the winter that followed:

aug20-coldestsummersnow

The numbers in blue show a slightly snowier than average winter, the purple numbers spotlight a much snowier than average winter, the tan numbers highlight less snow than average in the winter, and the pink numbers shows 10″+ of snow below average in the winter.

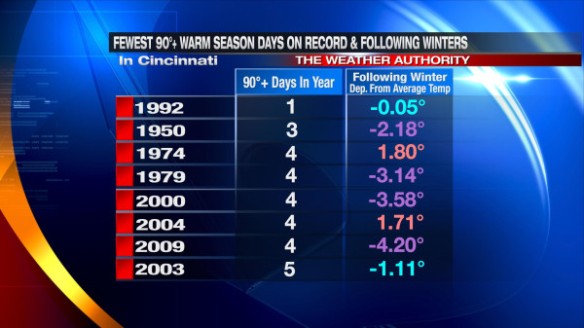
Does a lack of 90°+ days in the spring, summer, and fall mean the winter to come will be colder than average? Here’s the table of the fewest 90°+ days in the spring, summer, and fall plus the departure from average on the winter that followed:

aug20-fewest90

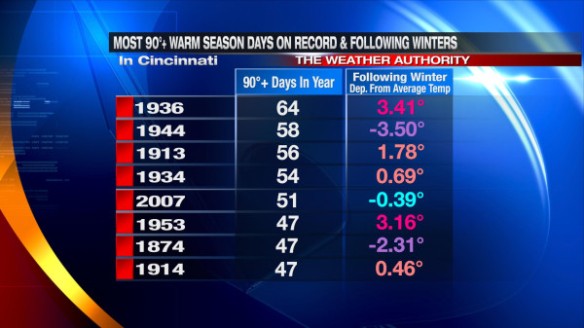
Sometimes the winter was warmer than average; sometimes it wasn’t. The same thinking applies to the list of the most 90°+ days in the spring, summer, and fall in Cincinnati:

aug20-most90

My Thoughts

It is way too early to be speculating about the upcoming winter forecast. We will begin to look at the winter forecast in September and fine tune our thinking in October and November. One or two weeks of abnormally cold or warm temperatures can affect the seasonal average. One or two big weather systems can affect the seasonal snowfall total in a big way. Even the exact orientation of lake-enhanced and lake-effect snow bands can affect temperatures and snowfall amounts. With high temperatures forecast to be in the 80s and 90s through next weekend, a winter forecast is not something I want to tackle yet.

I have found little to no correlation between summer heat and winter cold/precipitation. Summer 2012 was the 18th warmest summer on record in Cincinnati; the winter that followed was warmer but snowier than average. I remember saying last November that the winter of 2012-2013 would be near average for both temperatures and precipitation amounts, but my thinking was a lot different when when our first frost and freeze came earlier than usual in late September and early October.

When rumors of big snowstorm come each year, people are hoping for pinpoint totals several days out, when – in reality – it is best to issue a forecast when the confidence is higher and forecast models are more reliable. I will not speculate on the winter forecast until I have a good handle on what is going to happen. When a chill in the air returns, a discussion on the winter forecast will surface. Until then, enjoy what’s left of a rather calm, cool, and not too humid summer.

Wednesday Night’s Severe Threat: What It Is And What It Isn’t

If you’re concerned about the risk for severe storms Wednesday, Wednesday night, and very early Thursday, you should be. If you’re scared, you shouldn’t be. If you’re not prepared for the threat for severe storms, you should be.

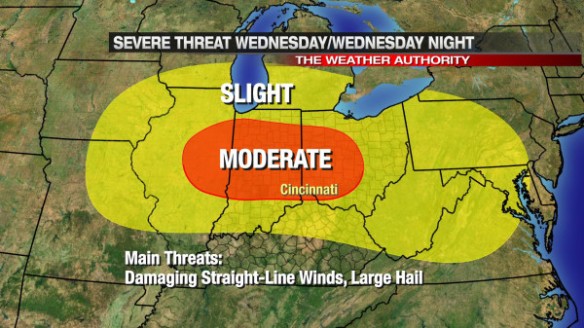
As I mentioned in my blog post early Tuesday evening, the Storm Prediction Center has issued MODERATE risk for severe storms in the Tri-State from 8am Wednesday to 8am Thursday; the biggest concern for severe storms will be Wednesday evening and overnight.

What exactly is a “Moderate Risk?” Here are the differences on the Slight, Moderate, and High Risk outlooks issued by SPC:
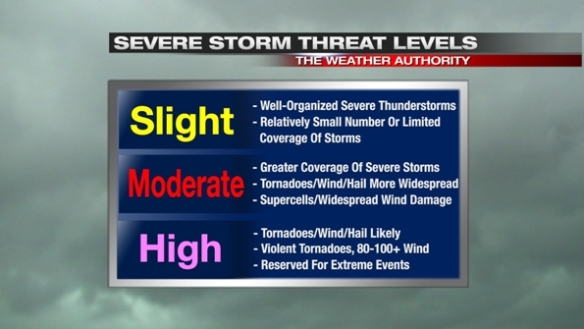
jun11-threatlevels

March 2, 2012 was a High Risk day, and it – unfortunately – verified with numerous violent tornadoes and more than a dozen killed in our area. We are not in an SPC High Risk Wednesday or Wednesday night, but we are in an SPC Moderate Risk, suggesting the threat for strong and severe storms is significant.

When you take data from this morning’s NAM forecast model for Wednesday night and compare it to similar weather event and setups in the past (using St. Louis University’s CIPS Analog Guidance), the top 15 closest matches suggest an elevated risk for severe storms. Here are all of the SPC storm reports from those top 15 closest matches:
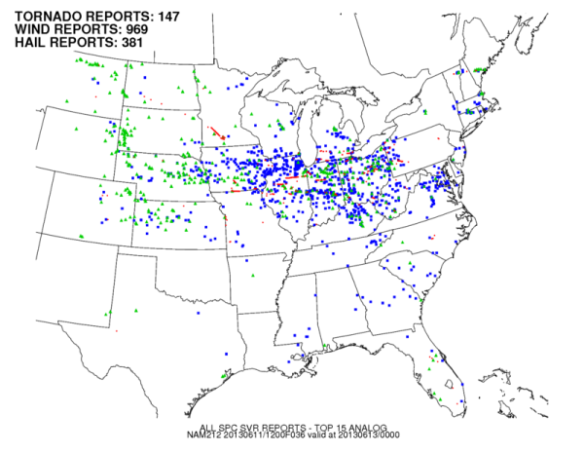
jun11-12znam36hrsvr

All of the blue dots are damaging wind reports. Blue dots far outweigh green dots (severe hail reports) and red dots (tornado reports), so history would suggest this pattern will give us more damaging wind reports over other forms of severe weather.

This is supported by this afternoon’s (18z) WRF model, which suggests winds 2,000-3,000 above Cincinnati at 2am Thursday morning will be in excess of 60mph:
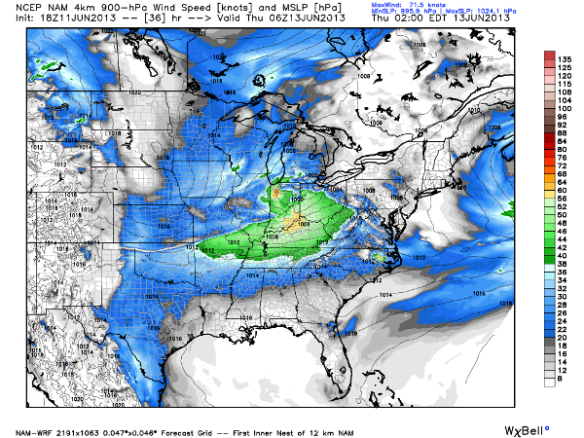
jun11-6zthur850wind

This same run of the WRF shows storm relative helicity (a measure of how likely storms are to spin) values are elevated tomorrow night, but not abnormally high:
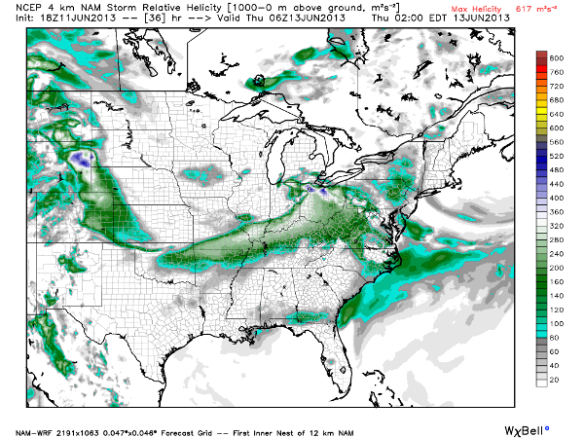
jun11-6zthurhelicity

These numbers support a marginal tornado threat Wednesday night and early Thursday. With the winds just above the ground very strong out of the west tomorrow night and a strong surface wind out of the southwest, there is little directional shear (needed for tornadoes) but strong speed shear (supporting a damaging straight-line wind threat).

What will the system look like on radar? There is still a fair amount of uncertainty regarding this, but most models suggest a bowing line of thunderstorms will be pushing through the Ohio Valley Wednesday evening and early Thursday. Our in-house WRF-ARW model shows a line of showers and thunderstorms moving into our area around 2am Thursday:
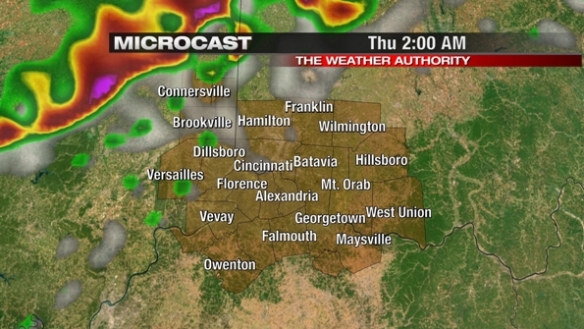
jun11-arw2amthur

…and moving into the heart of the Tri-State nearing 3am:
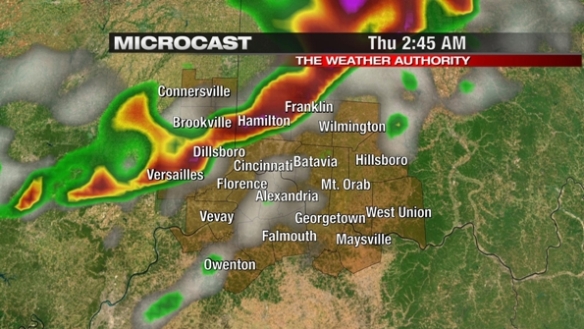
jun11-arw245amthur

…and pushing south by 8am Thursday morning:
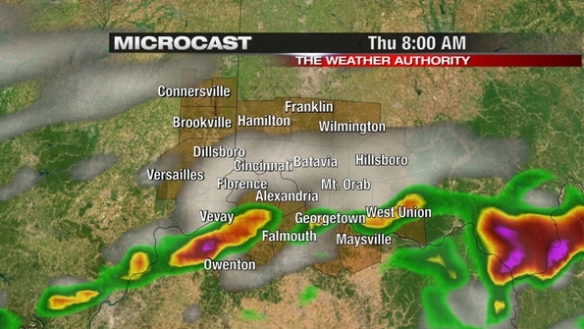
jun11-arw8amthur

This is just one model’s thoughts on what will happen tomorrow night. I suspect this model is off on timing given that most storms tomorrow night will generally be moving northwest to southeast at 40-50mph. This model, however, supports a bowing line of storms pushing through over a line or clusters of supercells.

The elevated severe storm risk is being driven by strong southwesterly flow tomorrow, pumping warm moist air into the Ohio Valley. While the raw numbers from this morning’s Microcast run are off (especially for temperatures and dewpoints late in the day Wednesday) , the model clearly shows Wednesday and Wednesday evening will be warm and humid:
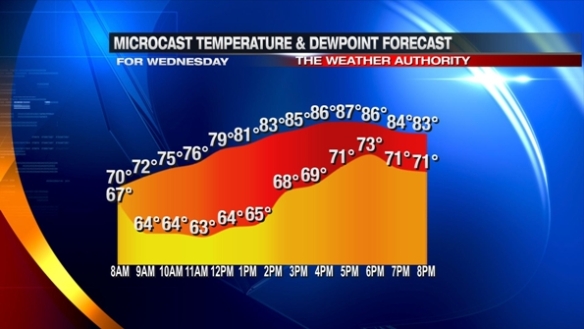
jun11-temptd

There is still a lot to be resolved about the severe weather threat in the next 48 hours. As with most severe weather events, the threat often changes hour-by-hour as the event draws closer. We don’t yet know exactly what shape these storms will take, and the timing of the peak severe weather threat hasn’t been pinned down yet. We do, however, know that damaging straight-line winds appear to be the main threat, and the secondary threats will be tornadoes, large hail, and flooding.

Are you prepared for the possibility of severe storms? Here are some things to consider:

– Is your NOAA Weather Radio working and programmed properly?
– Are there fresh batteries in your NOAA Weather Radio, and it is also plugged into a wall outlet?
– Do you have a flashlight with fresh batteries, hard-soled shoes, bottled water, and a first aid kit in your basement?
– Do you and your family know where to take cover if a warning is issued?
– If you’re going to be away from your home tomorrow night, do you know where to take cover if needed?
– Do you have more than two ways to get watch and warning information (NOAA Weather Radio, phone app, text messaging service, Twitter, Facebook)?

Please be prepared and weather aware for storms in the next 48 hours. Now is the time to plan; don’t wait until the storms hit!

Strong And Severe Storms Likely Tomorrow Night

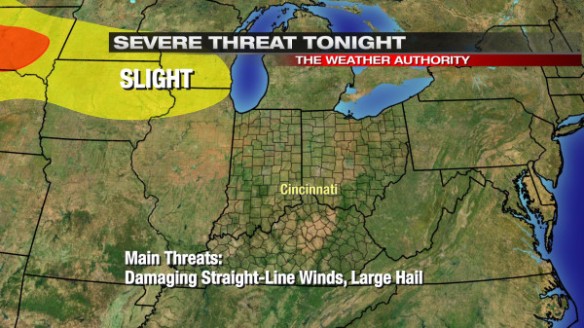
While there will be clusters of showers and thunderstorms in and around the Tri-State this evening and also late tonight/early tomorrow, the main threat for severe storms in the Tri-State will come tomorrow night. While tornadoes and large hail will be possible with the strongest storms tomorrow and tomorrow night, damaging straight-line winds will be the main concern.

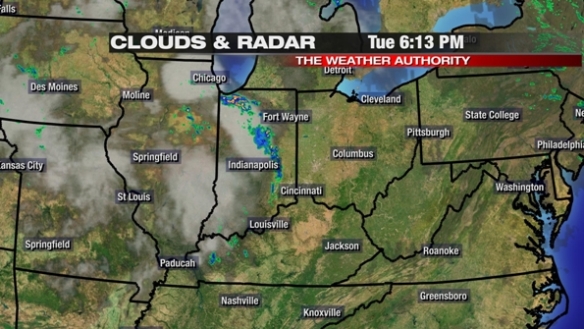
As a 6:13pm, satellite and radar data showed showers and thunderstorms taking aim on the Tri-State:

jun11-613pmradar

These clusters of showers and thunderstorms will be around through most of the evening.

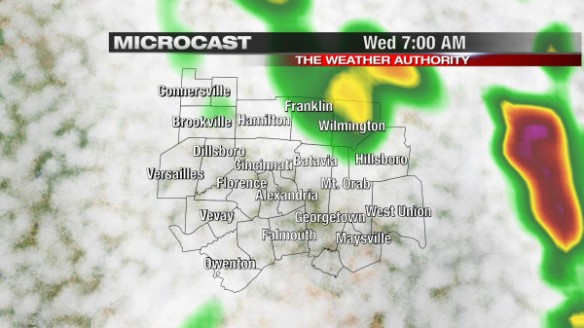
This morning’s Microcast model run has more showers and thunderstorms moving in late tonight and early tomorrow:

jun11-7ammc

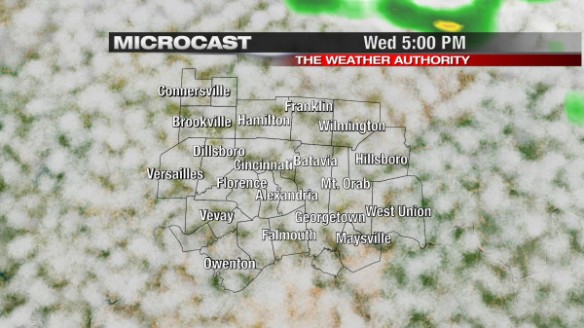
Stronger storms can’t be ruled out both this evening and late tonight, but a much higher threat for severe storms will develop late tomorrow afternoon and tomorrow evening. Microcast isn’t too excited about the coverage of showers and thunderstorms at 5pm Wednesday:

jun11-5pmmc

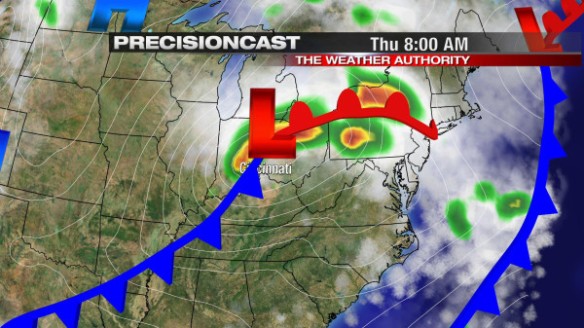
…but tomorrow night is a different story. Precisioncast has a strong area of low pressure coming through the Ohio Valley Wednesday night and early Thursday:

jun11-pc8amthur

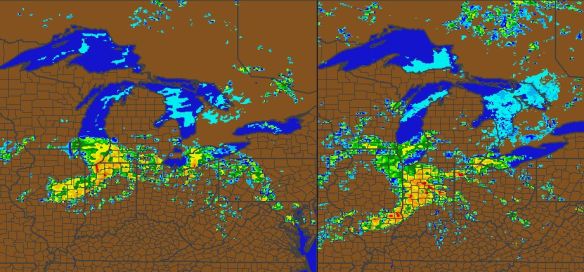
The window for severe storms tomorrow night is fairly large right now. If you buy Precisioncast, strong and severe storms may not arrive until after midnight. Do you like Precisioncast’s thinking, or do you like what the WRF model thinks the radar will look like at midnight Thursday?

screenshot

One version of the WRF model’s forecast radar for midnight Thursday is on the left; another version of the WRF is on the right. The difference in the strength and the timing of the showers and thunderstorms is significant, and we aren’t that far away from this event!
In summary, the Storm Prediction Center keeps the risk for severe storms well off to our northwest tonight:

jun11-svrmaptonight

Most of the Tri-State will be under a MODERATE risk for severe storms from 8am Wednesday to 8am Thursday (the main severe weather threat will be Wednesday night and very early Thursday):

jun11-svrmap

Remember: damaging straight-line winds will be the main severe weather threat Wednesday and Wednesday night. Large hail, tornadoes, and localized flooding will be secondary severe weather concerns.

Are you prepared? Stay tuned for updates!
Signals Suggest Elevated Severe Storm Threat The Next Few Weeks

June is usually our busiest month for severe storms in the Tri-State. Spring – so far – has been very calm; only 13 Severe Thunderstorm Warnings have been issued in the Tri-State so far in 2013. On average, 26 Severe Thunderstorm Warnings are issued in southeastern Indiana, northern Kentucky, and southwestern Ohio each June. Model data suggests the next few weeks could be rather stormy.

Before diving into the data, the idea from this blog post came from me noticing a Twitter conversation between Ryan Wichman at WTOL in Toledo and Seth Binau at NWS Wilmington…and Ronald posting about this potentially stormy pattern on my Facebook page. Some of the topics mentioned below came from them.

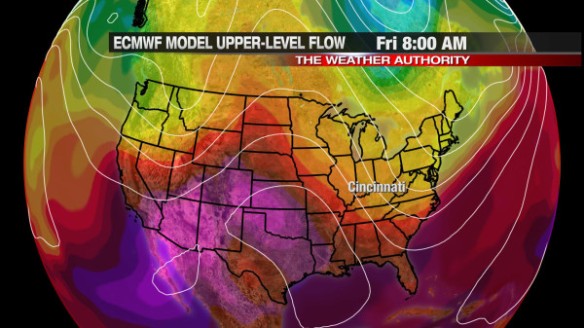
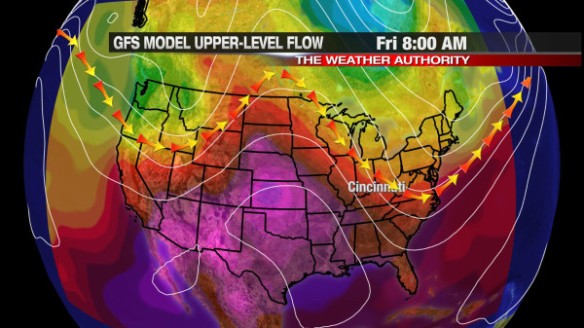
Why do the next few weeks look so stormy? The best argument for this can be seen in the upper-level pattern. Models suggest an area of high pressure will be setting up over the Plains this week (and likely in the weeks to follow), forcing disturbances to ride up and over this ridge of high pressure and dome of heat. Here’s what this morning’s GFS thinks the upper-level flow will look like Friday morning:

jun9-gfs

The “bubble” over the southern Plains is the area of high pressure. The warm (red and purple) colors show where the core of heat will be; in this case, red and purple colors support daytime highs in the 90s and 100s if little or no rain is forecast.

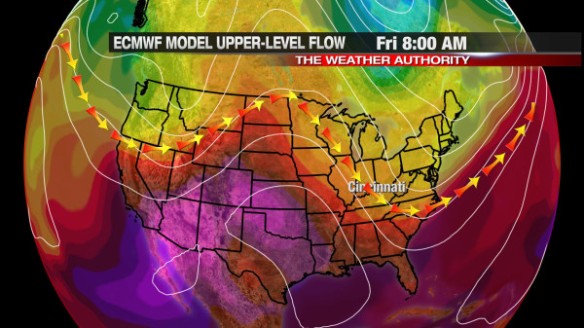
This morning’s ECMWF model has a similar upper-level pattern for Friday morning:

jun9-ec

It’s important to note that upper-level winds tend to flow parallel to the lines on the map. In essence, here is path upper-level disturbances will take later this week per the GFS and ECMWF model, respectively:

jun9-gfsflow

jun9-ecflow

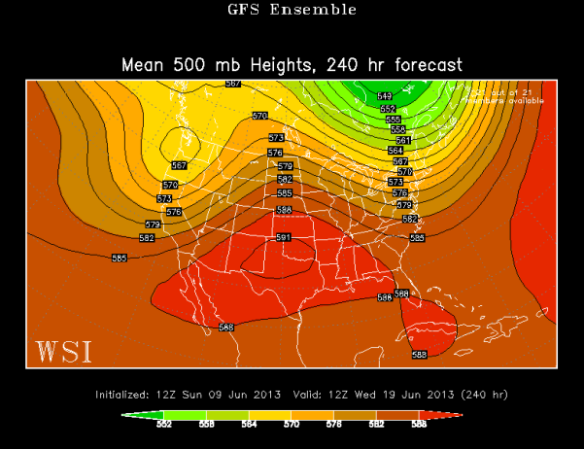
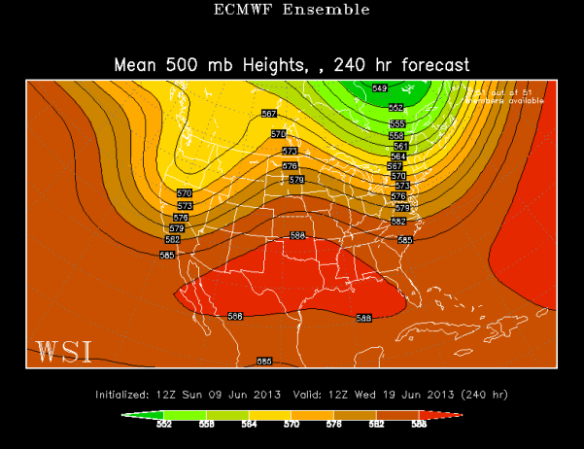
This pattern won’t change much into next week per this morning’s GFS Ensemble model:

jun6-gfse12zwed

…or this morning’s ECMWF Ensemble model:

jun6-ece12zwed

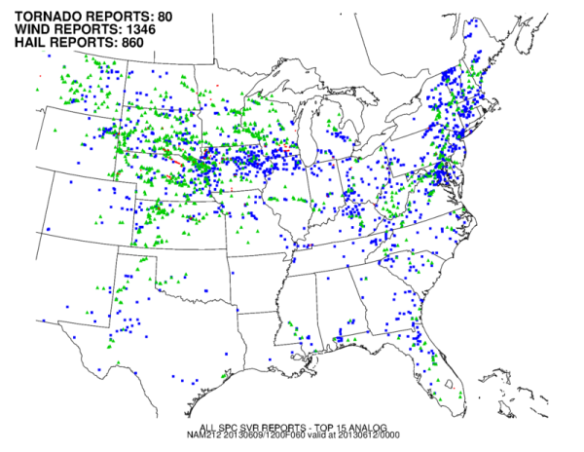
One way to assess the potential for severe weather is to compare the upper-level pattern to other days with a similar upper-level pattern in the past…and see what happened. This technique is called analog forecasting. What do the analogs suggest will happen? If you look at the GFS model’s output for Wednesday, the top 15 analogs (similar patterns) suggest a threat for severe storms. Here are all of the Storm Prediction Center storm reports for those top 15 analogs (wind reports are in blue, hail reports are in green):

jun6-svranalog

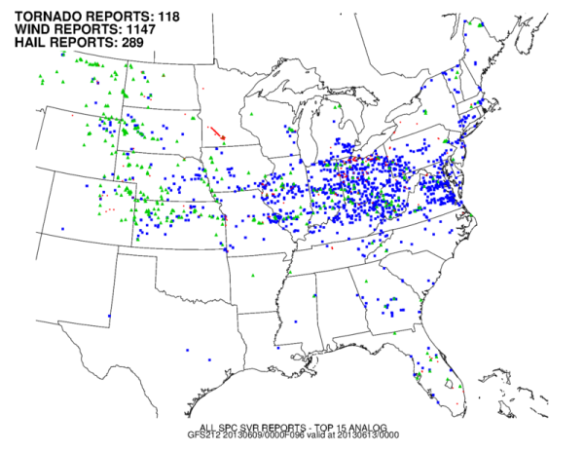
When last night’s GFS model data for Wednesday is fed into St. Louis University CIPS analog database, storm reports from those analogs suggest severe storms are a possibility Wednesday, especially damaging straight-line winds:

jun6-svranalog2

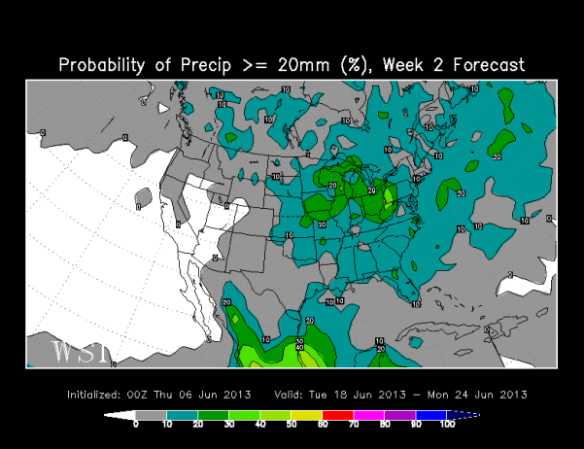
This storm pattern is likely not going to break down without a fight. The latest run of ECMWF Weekly model has the best chance for 3/4″+ of rain from June 18-24 in the Ohio Valley and Great Lakes:

jun6-ewwk2

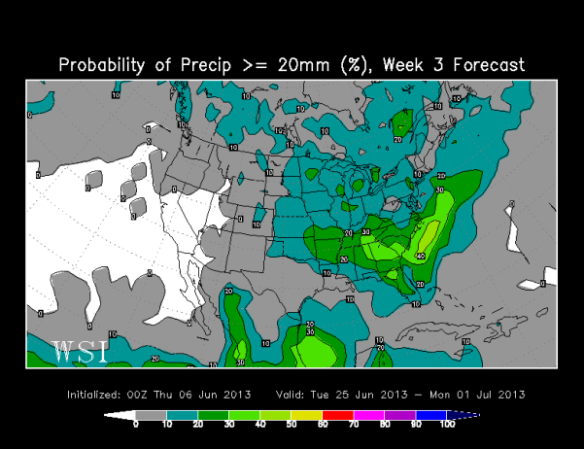
…and the best chance from June 25 to July 1st in the Ohio Valley and southeastern United States:

jun6-ewwk3

When you look at all of the data, there is fairly high confidence for a stormy pattern in the second half of June. The specifics on timing and strength of each disturbance will be tricky to pin down until we get close to each event. Our first chance for seeing strong and severe storms in this pattern comes Wednesday and into Thursday.

Are you prepared for some bouts of storms?

This Year’s Lack Of Severe Weather In Perspective

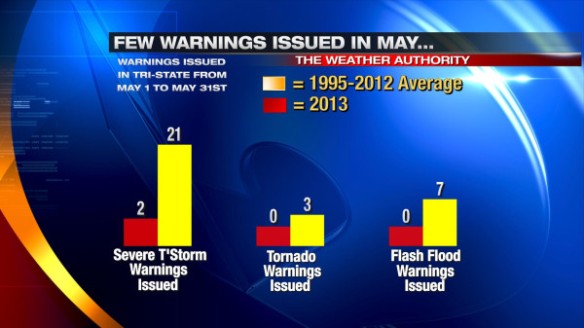
Historically, May is the second most common month for Severe Thunderstorm Warnings to be issued in The Tri-State. On average, more Tornado Warnings are issued in May than any other month, and May is the second most likely month for a Flash Flood Warning to be issued. This May, however, has been abnormally quiet for warnings. Only 2 Severe Thunderstorm Warnings were issued during the month of May in northern Kentucky, southwestern Ohio and southeastern Indiana; no Tornado or Flash Flood Warnings were issued. Here’s a summary of local warnings in May compared to average:

jun4-maywarnings

Only 13 Severe Thunderstorm Warnings have been issued so far this year; this is a record minimum count from January 1st through June 4th and since the National Weather Service in Wilmington began issuing warnings for the Tri-State. On average, 46 Severe Thunderstorm Warnings are issued in the first 154 days of the year.

No Tornado Warnings have been issued so far this year. For comparison, 22 Tornado Warnings had been issued through this point last year, and 32 were issued through this date in 2011. There have only three years since 1995 (2013, 2002, and 2000) where a Tornado Warning had not been issued in the Tri-State through June 4th.

Only one Flash Flood Warning has been issued so far this year in the Tri-State. 15 Flash Flood Warnings are issued through this date each year, on average.

Here’s a summary of year-to-date warning counts compared to average:

jun4-ytdwarnings

Why are warning counts so low this year? Is it the temperature? May 2013 was warmer than average (46th warmest in the last 143 years). Typically, above average temperatures in May correlate to an above average number of thunderstorm-related warnings. Spring 2013, overall, was cooler than average (51st coldest in last 143 years); cooler than average springs tend to have fewer warnings.

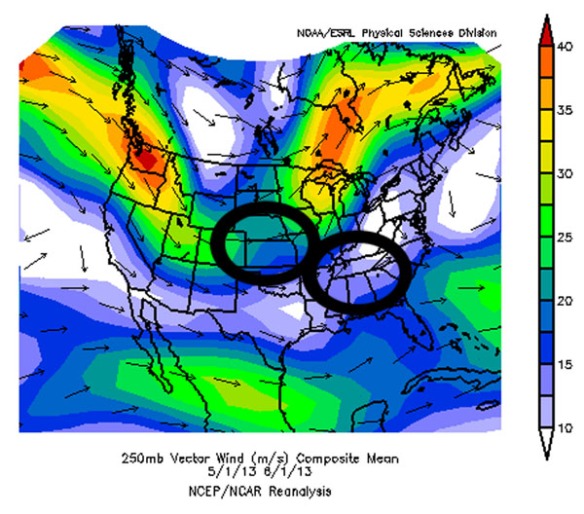
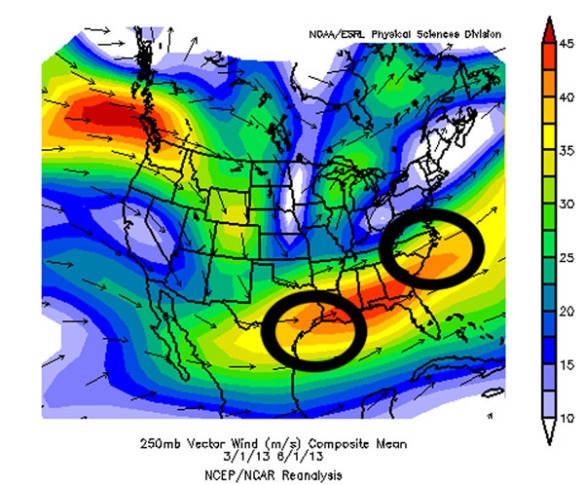
While temperatures play a part, I think the two main reasons we haven’t seen a lot of severe weather comes the lack of low-level moisture and – more importantly – from the positioning of the jet stream. From March 1st through May 31st (meteorological spring), the jet stream was mainly focused to our south:

springjet

Foci for severe weather based on the positioning of the jet stream are circled in black. Note these foci are outside of our area.

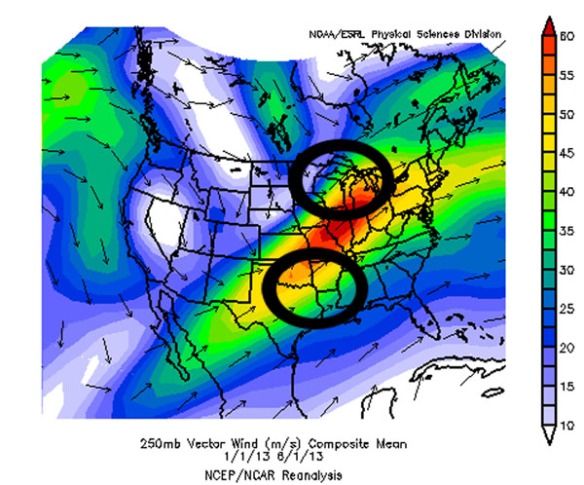
For the whole year thus far, the jet stream has been positioned more southwest-to-northeast:

yearjet

Foci for severe storms and rapid development of low pressure are circled in black. Note we are downstream of one of these foci. The jet stream was frequently dipping south into the Plains this winter; this is the main reason we are downstream of one of these foci and a reason why we had a lot of snow late in the winter. The jet stream’s positioning changed quite a bit from winter to spring. Note average position of the jet stream in just May:

mayjet

…and note the favored areas for severe storms (the Plains and Mid-South, where severe storms have been frequent). After all these areas have been through, we have a lot to be thankful for this year!

Reflections On Recent Tornadoes And Lessons Learned

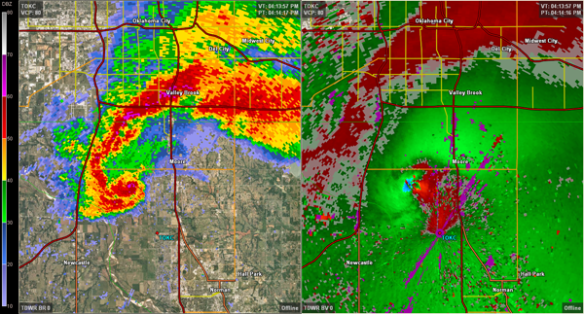
For the last two weeks, it seems there has been an endless stream of stories about storm damage and tornadoes in Oklahoma. First, tornadoes cut through central and northeastern Oklahoma on May 19th. Second, it was the EF5 tornado that hit Moore, Oklahoma on May 20th; a debris ball and intense rotation could be seen on radar long before the storm hit Moore:

okc

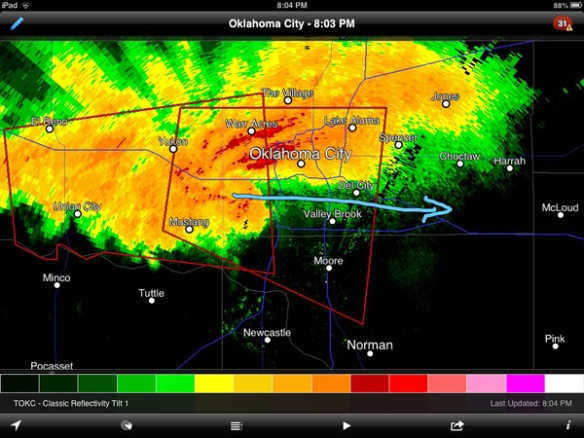
Third, there was a large tornadic, supercell thunderstorm approaching Oklahoma City on May 31st. Several tornadoes were confirmed from this cyclic thunderstorm, and 80+ mph rear-flank downdraft winds blasted southern Oklahoma City and northern Moore:

okc2

The May 20th tornado killed 24 people, and the death toll has not been solidified for the May 31st storms.

While it is horrible to hear of any tornado-related deaths, deaths in EF-5 tornadoes are common. Given span of the debris field, the timing of the day, the length and width of the tornado (17 miles, and a maximum of 1.3 miles, respectively), and the path of the tornado (through a medium to large-sized city), the death toll in and around Moore easily could have been much higher. Advanced warning from the media and the National Weather Service likely saved dozens of lives.

Preliminary assessments from the National Weather Service in Norman, Oklahoma suggest the tornadoes that hit Oklahoma City and surrounding areas on May 31st were weaker overall but were still deadly. Many of the deaths that day could have easily been prevented.

Tragically, legendary Tim Samaras, his son Paul Samaras, and longtime chase partner Carl Young were killed in the EF-3 tornado that hit El Reno, Oklahoma on Friday. More information on the death of these three storm chasers from 7NEWS in Denver is here: http://bit.ly/11xAcZ4

Mike Bettes, a meteorologist at The Weather Channel, and his crew were injured when their car was damaged by one of the tornadoes on May 31st. More information (including a photo of the damaged car) from the AP via WPTV-TV is here: http://bit.ly/ZmKWx1

Personally, I was more surprised to hear of these storm chaser/meteorologist injuries and deaths on May 31st more than the injuries and deaths in the Moore tornado on May 20th. When a major tornado hits a city with 55,000+ residents, there will almost certainly be injuries and deaths. Some who take shelter but not underground will get killed and/or injured when a tornado is that strong.

While it is important to tend to injuries and remember the lives of those who are killed in storms, there are few if any reasons why a storm chaser or meteorologist should be killed by a tornado. Storm chasers – especially those who are meteorologists – should know the level of danger in and especially around thunderstorms. If they don’t know the danger, they should keep more than enough distance or they shouldn’t be chasing at all. Those with limited or no training or experience should not go chasing potentially violent tornadoes, just as those with limited or no medical training should not be in charge of large-scale safety operations. The “Particularly Dangerous Situation” Tornado Watch in effect before tornadoes hit the Oklahoma City area on May 31st made it very clear that intense tornadoes were possible that afternoon and evening: http://1.usa.gov/11bxp7S. Reports of multi-vortex tornadoes in the area should have been a clear sign that tornadoes may dissipate and develop quickly, including overhead and away from where they were looking. Reports on Twitter Friday night suggested that at least one OKC meteorologist told people to drive away from the projected path of the tornadoes and that roads were clogged by these evacuees and storm chasers. People caught in traffic and not able to escape with a tornado approaching a recipe for disaster.

May 31st serves as a reminder that dangerous storms are dangerous. Experience and training may help someone get closer to a storm or know how to escape if needed, but there will always be cases where experience and training won’t help or save you. Unfortunately, storms can some and sometimes claim lives, including those who think they can outwit them.

This cat and mouse game has to stop. When meteorologists and storms chasers are getting injured and killed, we need to reconsider storm chasing policies and behavior. The risk of getting killed and watching our friends, loved ones, and colleagues get killed is not worth the risk of sampling the winds in or getting a picture of a tornado. Storms aren’t going to change the way they do what they do; it is up to us to make a change.

Latest On Tonight’s Severe Weather Threat

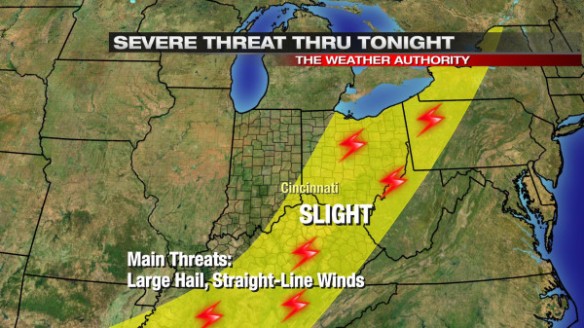
Strong storms are possible not just through early evening in the Ohio Valley, but also nearing midnight as a cold front nears. The latest severe weather outlook from the Storm Prediction Center has much of southwestern Ohio and northern Kentucky in an elevated risk for severe thunderstorms through tonight:

jun1-svrthreat

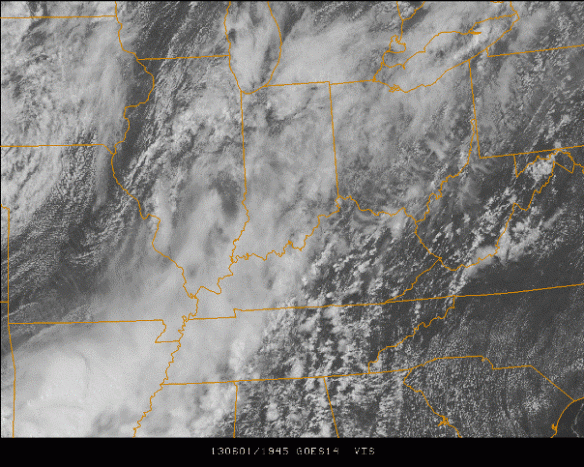
The latest round of model data is messy with the handling of showers and thunderstorms tonight and very early Sunday morning. Visible satellite shows why models are struggling:

jun1-345vis

As of 3:45pm, you can see breaks in the clouds over central Kentucky, eastern Kentucky, and southwestern Ohio. Meanwhile, much of central Indiana and western Kentucky was cloudy, and there was more clearing ahead of the cold front pushing through Illinois. The setting sun will mean decreasing instability, further complicating the forecast.

Instability has been limited all day thanks to showers moving through early this morning and clouds slow to thin out this afternoon. While there is some wind shear (winds changing direction and speed going away from the ground) and some support for spinning thunderstorms in our area, instability is relatively weak, so the coverage of storms is rather low. As a result, the threat for severe weather is muted.

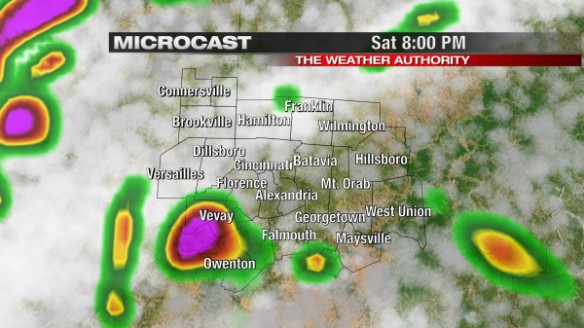
While there are some significant disagreements on the timing of showers and thunderstorms tonight, this morning’s Microcast model run matches my thinking fairly closely. Here’s what it thinks for shower and thunderstorm coverage at 8pm:

jun1-mc8pm

While the placement of showers and thunderstorms is likely off, the model suggests rain and thunderstorms will be scattered at that time. Some strong storms, especially south and east of Cincinnati, will likely linger through early evening.

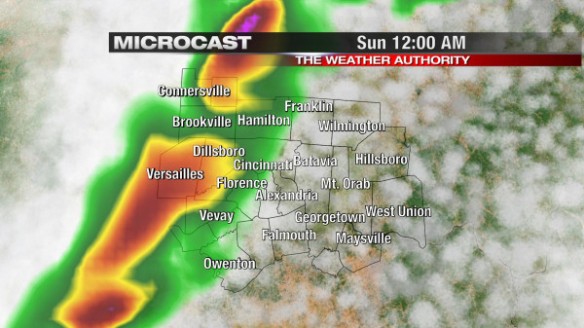
By midnight, Microcast has showers and thunderstorms along the cold front (now to our west) moving into the Tri-State:

jun1-mc12am

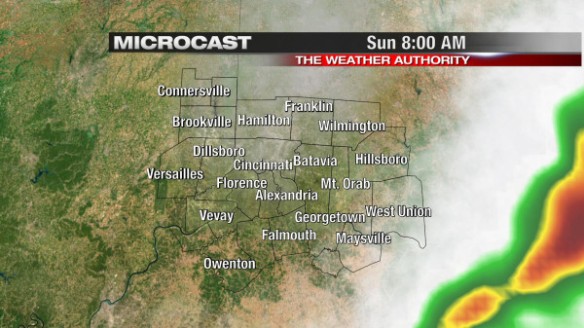
Brighter colors on Microcast here suggest some pockets of heavy rain, gusty winds, and lightning with the stronger cells in the line that forms. By 8am Sunday, showers and thunderstorms will be to our east, and we’ll enjoy a blend of sun and clouds:

jun1-mc8am

In summary, the chance for showers and thunderstorms will be ramping up through the evening as the cold front nears. Damaging straight-line winds, heavy rain, large hail, and lightning will be possible with any strong storms that are able to form. Despite this being a short-term forecast, there is still a considerable amount of uncertainty about the timing, placement, and intensity of thunderstorms through the evening and overnight. Please be alert to the threat for strong and severe storms through Sunday morning!

Perspective On An Unusually Quiet Severe Weather Season

May is the second busiest month of the year for severe weather warnings. After a record number of tornadoes last year, this year – especially this month – has been anything but stormy.

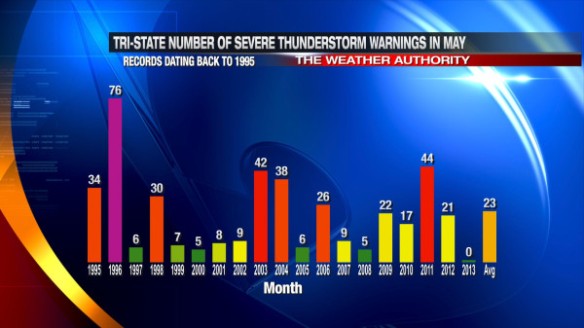
There have been no Severe Thunderstorm Warnings issued in the Tri-State so far this month. Compare that to the average of 23 warnings each May and the 76 warnings issued in the Tri-State in May 1996:

may24-svr

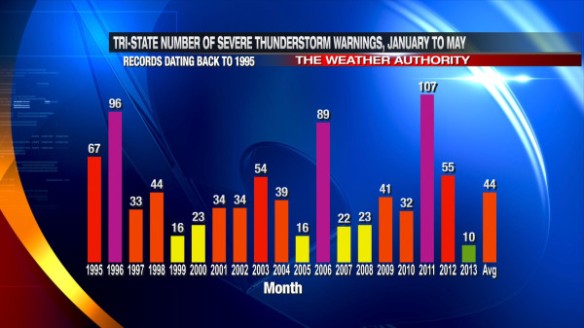
From January 1st to May 31st, an average of 44 Severe Thunderstorm Warnings are issued in southwestern Ohio, northern Kentucky, and southeastern Indiana. So far this year, only 10 Severe Thunderstorm Warnings have been issued in the Tri-State:

may24-svrjantomay

If no Severe Thunderstorm Warnings are issued for the rest of the month, the year-to-date number of Severe Thunderstorm Warnings will be at a record minimum (at least since the National Weather Service in Wilmington started issuing warnings for our area).

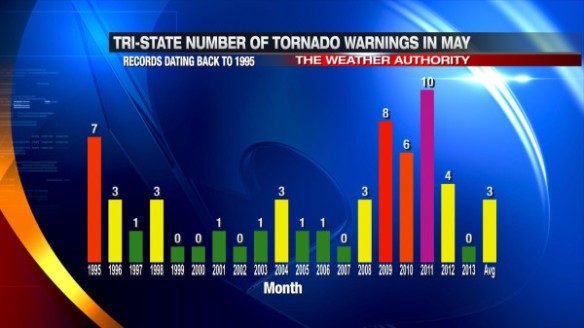
There have also been no Tornado Warnings issued in the Tri-State so far in May 2013; on average three Tornado Warnings are issued each May. Here’s the breakdown of how many Tornado Warnings have been issued each May since 1995:

may24-tor

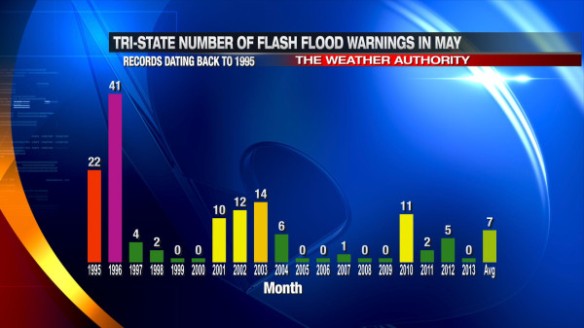
In addition to no Tornado and Severe Thunderstorm Warnings, no Flash Flood Warnings have been issued in the Tri-State. On average, 7 Flash Flood Warnings are issued in the Tri-State every May. Here’s how many year warnings have been issued each year during the month of May since 1995:

may24-ffw

Why have been there been so few Severe Thunderstorm, Tornado, and Flash Flood Warnings so far this year? You can’t place the blame on a single ingredient, but the lack of low-level moisture and cooler than average air for most of the spring are the biggest reasons.

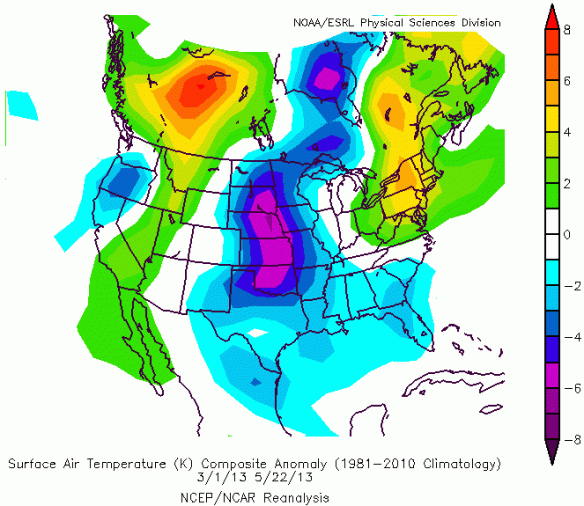
Data from NOAA’s ESRL shows colder than average temperatures (blue, purple) over most of the Midwest, Mississippi Valley, and Plains since March 1st:

may24-tanom

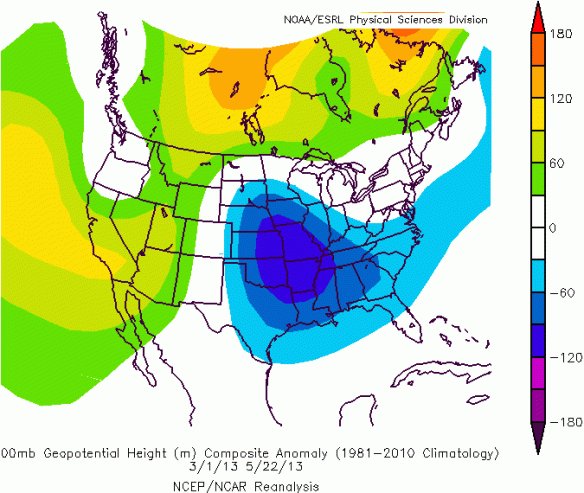
Warm air is a key ingredient for getting severe storms. While you need warm air near the ground to get strong storms, you also need cold air aloft. Data from NOAA’s ESRL shows that there has been plenty of that this season (in blue):

may24-500mbanom

However, most of this cold air has been associated with upper-level lows and dips in the jet stream. Severe weather is not common when you have cold air aloft and little support at the surface.

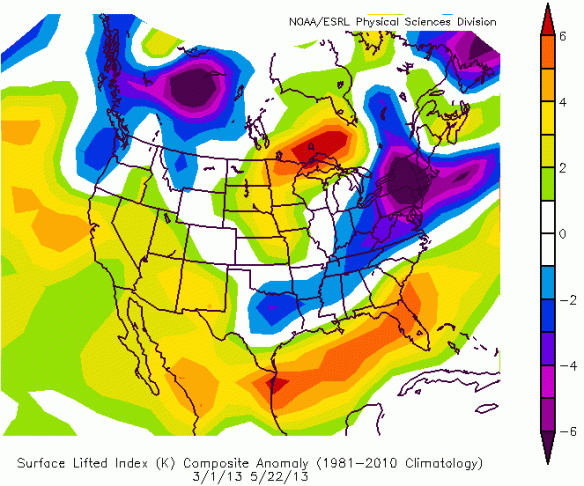
NOAA’s ESRL data suggests there has also been a lack of instability this spring. One way to measure instability is by looking at a plot of Lifted Index:

may24-lianom

Higher Lifted Index values mean less instability and lower Lifted Index values mean more instability. Notice relatively unstable air (blue, purple colors) over the Ohio and Tennessee Valley compared to our northwest. In the last couple of months, the best instability has been to our southwest, south, and east. As a result, the strongest storms in this country so far this spring have been focused there.

A quiet start to the peak severe weather season doesn’t necessarily mean that we’ll see a quiet end of severe weather season. Be prepared for what could be a busy summer of severe weather!

Detailed Look At Late Week And This Weekend

A cold front will push through the Tri-State over the next couple of hours, bringing showers and thunderstorms to some but not all. Overall, late week looks quiet and cool.

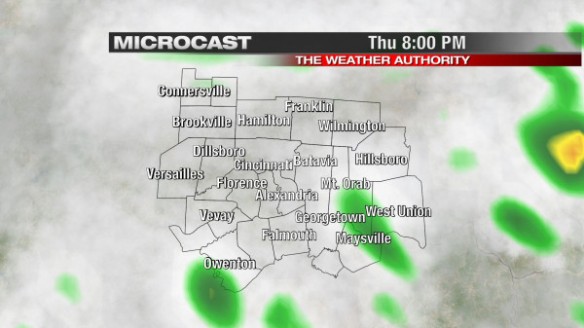
This morning’s run of Microcast does a nice job with cloud cover and rain chances through through tomorrow. Microcast keeps the the best chance for scattered showers and thunderstorms southeast of Cincinnati at 8pm tonight:

may23-mc8pm

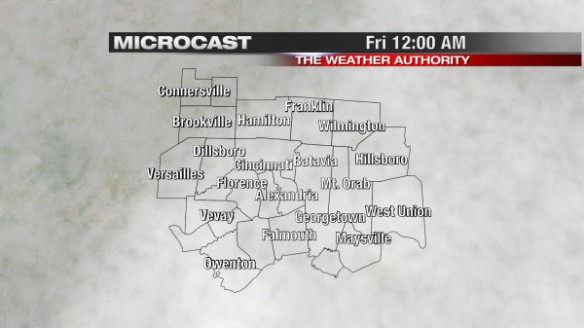
By midnight, we will likely still be mostly cloudy, but rain will be gone. Microcast has a good handle on this:

may23-mc12am

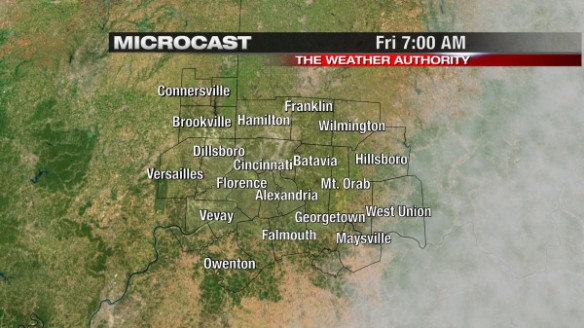
Clearing in earnest will begin just after midnight. By 7am, we’ll be clear, as Microcast shows:

may23-mc7am

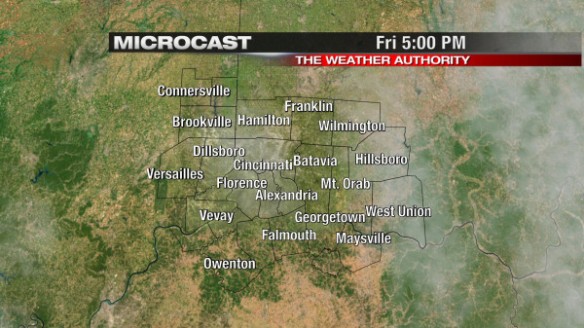
If you love sunshine without the heat, tomorrow will be a nice day. Microcast shows a sunny to mostly sunny sky overhead for tomorrow’s afternoon rush at 5pm:

may23-mc5pm

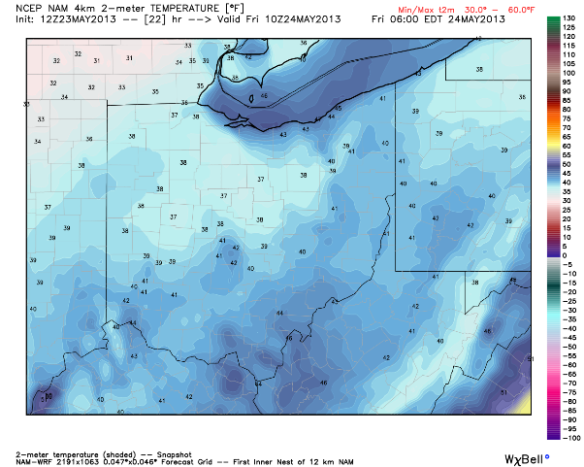
It will be cool tonight, tomorrow, and into the start of the weekend. This morning’s WRF model suggest we’ll bottom out in the upper 30s and lower 40s Friday morning:

may23-6amtemps

I don’t think we’ll be quite that cold by 6am Friday. Most will drop into the low to mid 40s tomorrow morning,  10-15° below average.

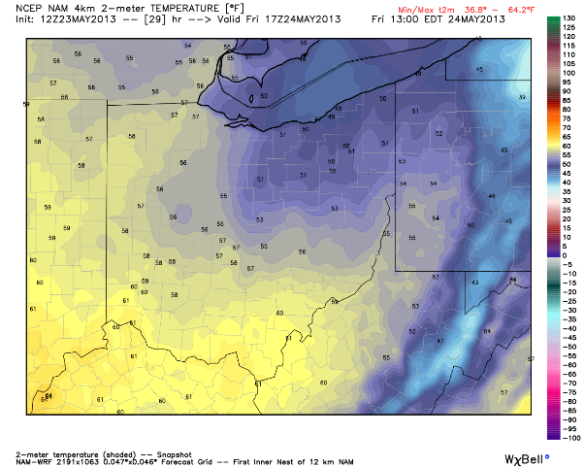
This morning’s WRF model suggests we’ll reach to near 60° by lunchtime Friday:

may23-noontemps

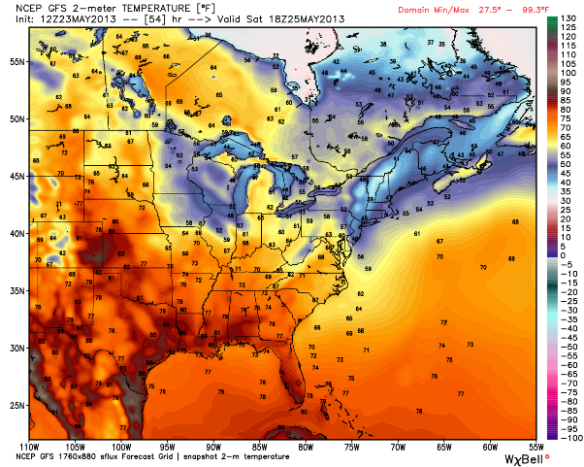
High temperatures tomorrow will be in the mid 60s. This morning’s GFS model suggests we’ll be in the upper 60s (orange colors) by late Saturday afternoon:

may23-sathighs

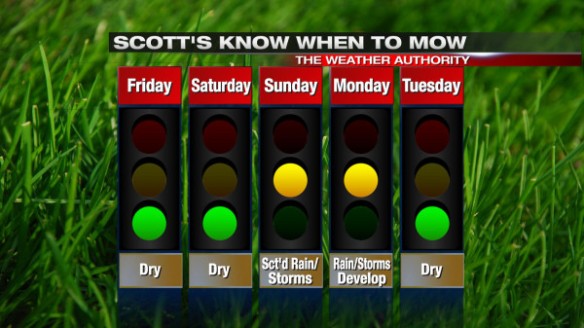
We’ll likely reach into the upper 60s and lower 70s Sunday, and into the 80s nearing the middle part of next week. If your yard isn’t soggy, you’ll be able to mow tomorrow, Saturday, and most of Sunday:

may23-knowtomow