Perspective On Fall Frost In Cincinnati

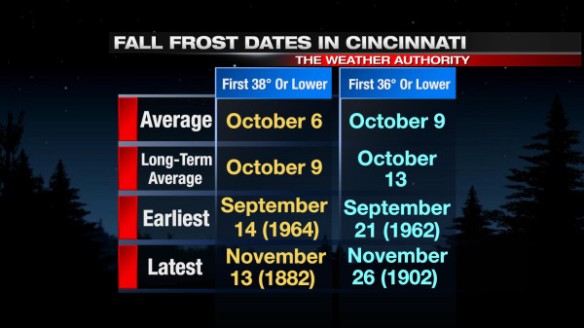
The possibility for frost in the Tri-State rises from mid-September through early October. Our first light frost (a low temperature around 38°) of the season usually occurs in early October but has occurred as early as mid-September.

Frost is more likely when the air temperature drops to or below 36°. The average date for the first fall morning in Cincinnati with a temperature of 36° or lower is in early to mid-September. A damaging frost, however, can happen as early as late September.

Here’s some perspective on fall frost dates in Cincinnati:

sep16-frost

The “average” above uses temperatures data from 1981 to 2010, and the “long-term average” uses temperature data from 1871 to 2012.

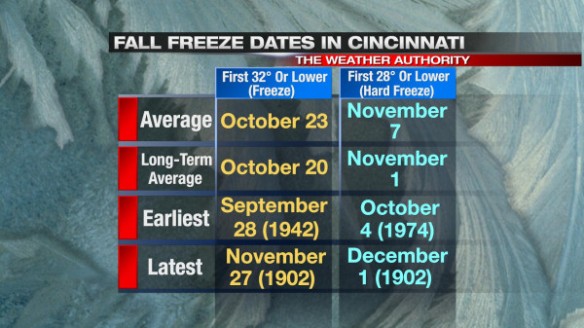
A morning with temperatures to or below 32°  – as known as a “freeze” – first occurs in late October, on average. A freeze often signals the end of the growing season for most plants. The first “hard freeze” (low temperature of 28° or below) of the fall in Cincinnati typically occurs in early November. With the exception of hardiest and herbaceous crops, any plants that are able to survive a freeze will likely be killed in a “hard freeze.”

Here’s some perspective on fall freeze dates in Cincinnati:

sep16-freeze

If left outside, your plants will likely have a couple of weeks left before getting their first taste of fall frost. The latest ECMWF Weekly model run suggests late September will be near or warmer than average. I suspect our first frosts of the year will come in early to mid-October this year…right on schedule.

The Tri-State’s “Secondary” Severe Weather Season Is Approaching

After a record number of tornadoes in 2012, there have been no tornadoes and no Tornado Warnings in the Tri-State so far this year. Since the National Weather Service in Wilmington began issuing warnings for the Tri-State in 1995, at least one Tornado Warning has been issued somewhere in the Tri-State in the first seven months of the year…until 2013.

Here’s how 2013’s warning count so far compares to yearly averages and records:

sep16-warnings

Severe storms, however, don’t just occur in the spring and summer; storms can – and often do – develop each fall and even winter. In fact, some of the strongest and deadliest storms in the Ohio Valley have occurred October and November.

In just the Tri-State alone, the average number of Severe Thunderstorm Warnings issued increases slightly from September to October and again from October to November:

sep15-svrs

May, June, and July are the most common months for seeing severe storms in the Tri-State.

Tornado Warnings are more rare than Severe Thunderstorm Warnings. On average, April and May are the most common months for Tornado Warnings to be issued, but there is a subtle spike in the average number of Tornado Warnings issued in October and November:

sep16-torwarn

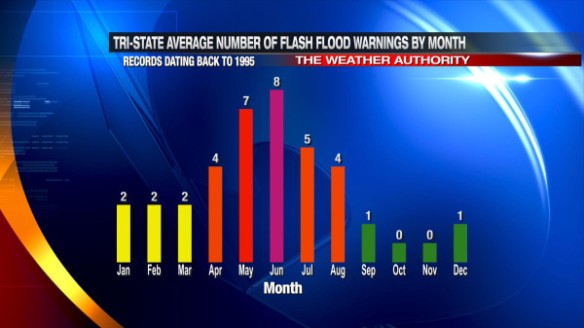
While the likelihood for Severe Thunderstorm and Tornado Warnings goes up some late in the year, few Flash Flood Warnings are issued after October 1st in the Tri-State:

sep16-ffws

In fact, only 5 Flash Flood Warnings have been issued in the Tri-State since 1995 during October, November, and December.

The threat for tornadoes seems to trump all other severe weather threats and tends to be the one that gets people most concerned. Statistically, April, May, and June are our biggest months for tornadoes. April’s number is partially inflated by the 12 confirmed tornadoes of April 3, 1974. While the monthly tornado count drops from August to September, it increases again through the fall:

sep16-tors

Why does the chance for severe storms and tornadoes gradually increase in the fall? The main reason is that the polar jet stream is pushing south and is almost always stronger in the fall than it is over Canada during the summer. Certain parts of the jet stream are focal points for rapidly rising air, and these focal points are usually where severe weather occurs in the fall (if other key conditions are present).

Don’t let the cooling trend fool you; autumn can be a nasty time of year, especially when warm, moist air surges north and the polar jet stream surges south.

Perspective On Mid-September Chill And The Long Range Forecast

After summer-like heat and humidity earlier this week, cooler, less humid air has returned to the Tri-State. The Weather Authority is forecasting low temperatures in Cincinnati early Saturday and Sunday morning to be in the mid to upper 40s. Communities north, northeast, and northwest of Cincinnati will likely drop into the lower 40s early Saturday and Sunday morning.

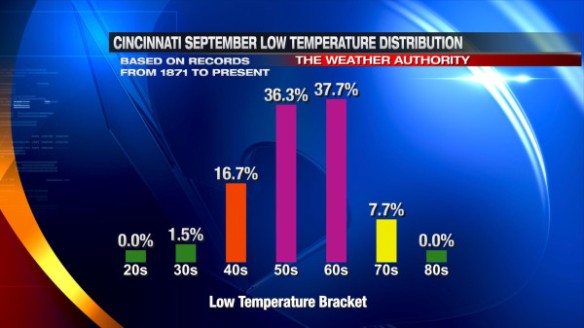
The record low temperature in Cincinnati for Saturday morning is 37°, set in 1964. The record low temperature in Cincinnati for Sunday morning is 41°, also set in 1964. How uncommon are lows in the 30s and 40s in September? Here’s a Cincinnati September low temperature distribution graph (for all September days since 1871):

sep13-septtempdistrib

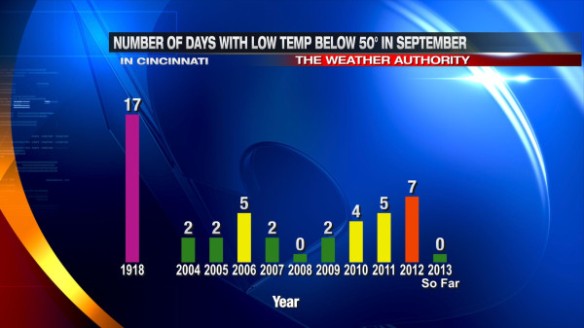
In the last roughly 4,200 September nights in Cincinnati, we’ve only dropped into the 30s 66 times and into the 40s 712 times. When you focus on just the last several years, we typically drop into the 30s or 40s a couple of times each September:

sep13-40sinsept

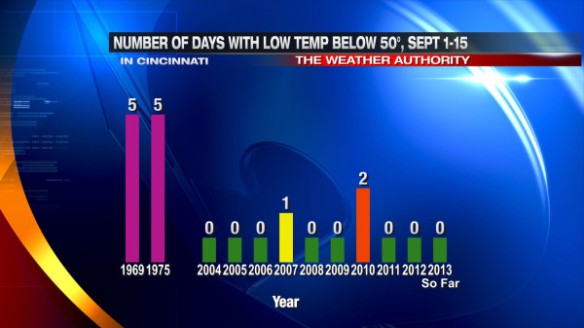
In September 1918, Cincinnati dropped into the 30s and 40s a record 17 times. Note that these are low temperatures for the entire month of September; September low temperatures in the 30s and 40s are usually saved for the second half of the month. When you look at just the records for the first half of September, dropping into the 30s or 40s more than twice in the same month is rare:

sep13-40sinearlysept

In 1969 and 1975, Cincinnati dropped into the 30s and 40s 5 times in the first 15 days of September; these are records for the most number of days with a low temperature below 50° in the first half of September.

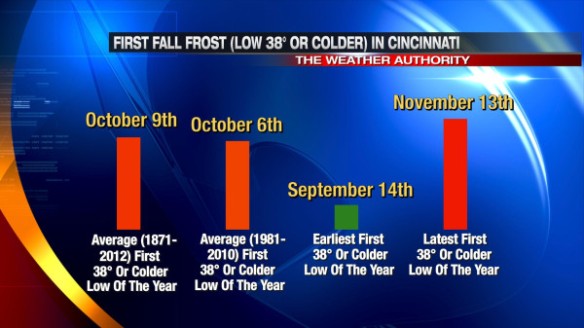
With the wind sustained near 5 mph overnight and temperatures in the 40s, frost is not a possibility this weekend. Here’s some perspective on when our first fall frost is (using a low temperature of 38°):

sep13-frost

Frost is rare in mid-September, but it has happened. The temperature dropped to 37° on September 14th, 1964 in Cincinnati. Our first fall frost is more likely in late September or early October.

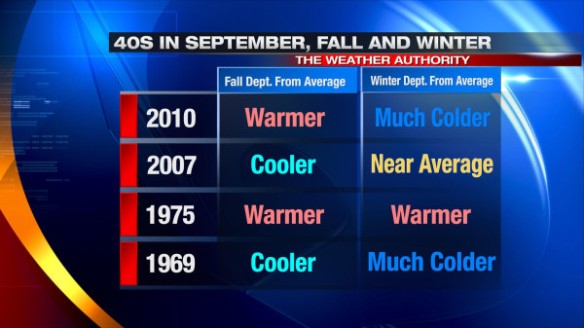
Does an overnight low in the 30s or 40s in early or mid-September tell us anything about fall or winter temperatures? Let’s look at the years mentioned above where we dropped into the 30s and 40s and see how the fall and winter that followed turned out:

sep13-fallwinter

Notice there is no correlation between fall or winter temperatures and temperatures in the 30s and 40s in the first half of September. In other words, the cold blast we’re getting this week or the cold blast we had earlier this month doesn’t say much about what the rest of the fall or winter will look like.

Stay warm this weekend! We’ll have highs in the 80s and lows in the 60s again by Thursday and Friday.

90°+ September Heat In Cincinnati Perspective

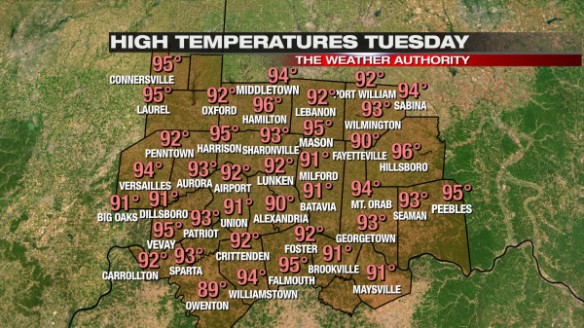
There is no doubt that the heat we have seen recently and will see again Wednesday afternoon is significant, especially in mid-September. High temperatures were in the 90s for nearly everyone in the Tri-State on Tuesday:

sep11-highstuesday

With temperatures in the 90s and dewpoints in the 70s, maximum heat indices from local, reliable weather stations were in the 100-105° range Tuesday afternoon.

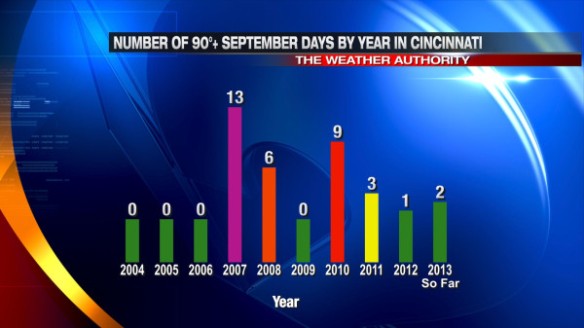
Is it rare to see 90°+ heat in September in Cincinnati? We average 2 90°+ days each September in Cincinnati, but it’s mainly feast or famine for 90°+ heat in September in the last several years:

sep11-90sinsept

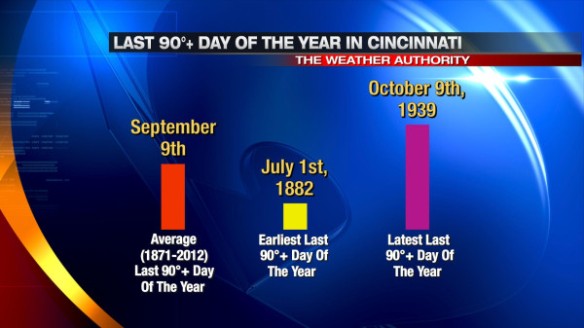
On average (1871-2012), our last 90°+ day of the year in Cincinnati is September 9th. The 30-year-average for the last 90°+ day of the year is August 29th. The window for the last day making it to 90° is quite large, however:

sep11-last90day

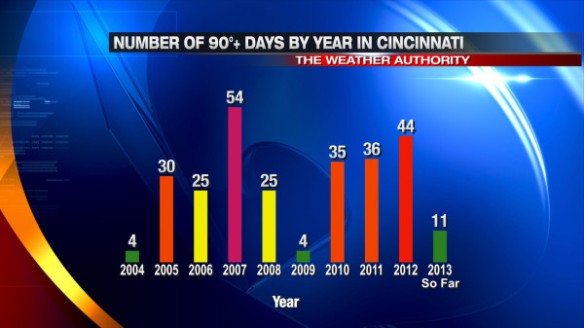
While September 1st is the first day of meteorological fall, astronomical fall begins on September 22nd, so high temperatures in the 80s and 90s are still common in September. We missed out on a lot of heat this summer (especially compared to summers like 2012, 2011, and 2007), but we are making some ground late in the season. We are likely going to fall short of our yearly average number of 90°+ days (21 days) in 2013:

sep11-90speryear

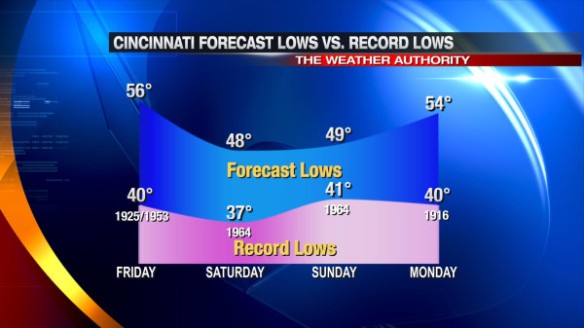
In the same week that we get summer heat, however, we’ll also get a true taste of fall. Low temperatures will likely be the 40s and 50s early Friday, Saturday, Sunday, Monday, and Tuesday morning. Here’s how forecast low temperatures match up against record low temperatures Friday through Sunday:

sep11-forecastrecords

High and low temperatures will gladly return to near or above average into early next week. At this time, I don’t see any large temperature swings coming for the mid or latter part of next week.

Abnormally Quiet Year For Severe Weather So Far

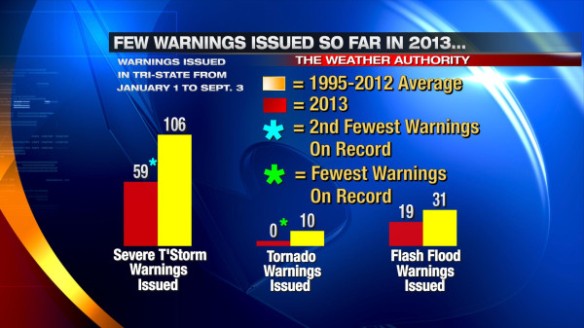
While the Tri-State has dealt with several rounds of nasty storms this year, numbers show that relatively few Flash Flood and Severe Thunderstorm Warnings have been issued in the Tri-State so far in 2013. No tornado warnings have been issued in the Tri-State since the year began. Prior to 2013, the latest first Tornado Warning of the year was on July 27th, 2002. Here’s how the number of warnings so far this year match up with averages through this date:

sep3-warningsummary

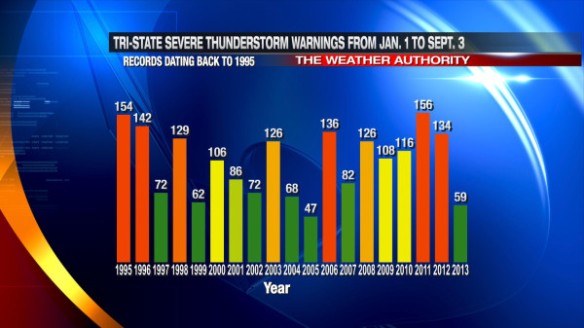
Through the end of May, the number of Tri-State Severe Thunderstorm Warnings was at a record year-to-date minimum. The year-to-date count of 59 warnings so far this year is the 2nd fewest number of warnings issued through this date (since the National Weather Service in Wilmington first started issuing warnings for our area in 1995); only 2002 had fewer warnings through September 3rd:

sep3-svrs

This also feels like an unusually quiet severe weather season compared to 2011 and 2012.

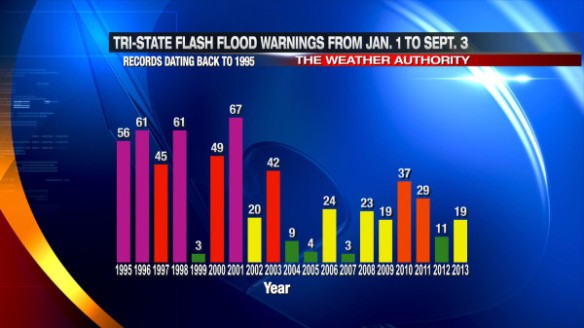
The number of Flash Flood Warnings issued so far this year has also been below average, but we saw fewer warning through this point in 1999, 2004, 2005, and 2007:

sep3-ffws

Lower radar resolution and poorer rainfall estimation algorithms are partially to blame for the higher warning count in the late 1990s and early 2000s.

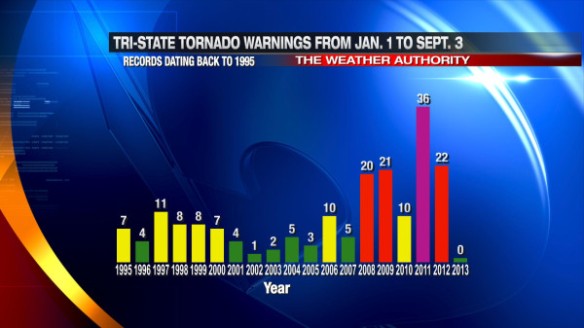
The story of the year – at least to me – seems to be the lack of tornadoes and number of Tornado Warnings. While there have been several years since 195o with no confirmed tornadoes in the Tri-State, we never made it to early September without a Tornado Warning being issued somewhere in the Tri-State from 1995 to 2012. We have, however, done just that in 2013:

sep3-tors

Only Tornado Warnings have been issued in September since 1995. Tornado Warnings are even more rare in October, November, and December. Severe weather is unlikely in the next 7 days, so the window for getting Tornado Warnings is quickly closing.

This Week’s Heat Wave: What It Is And What It Isn’t

A lot of time in my recent weathercasts has been dedicated to a heat wave coming this week. Given the lack of heat so far this summer, there is high confidence that this will be the longest and biggest heat wave of the year. This heat wave, however, will not be among the worst we have seen, including heat waves we had in 2012, 2011, and 2007.

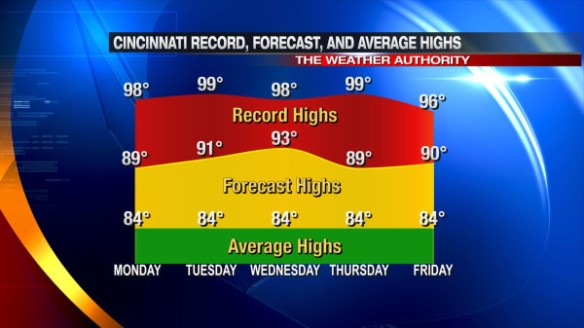
Here is how forecast high temperatures for the next 5 days in Cincinnati compare to average and record high temperatures:

aug25-forecastavgrecords

Notice that high temperatures will be several degrees above average but also short of record highs each day Monday through Friday.

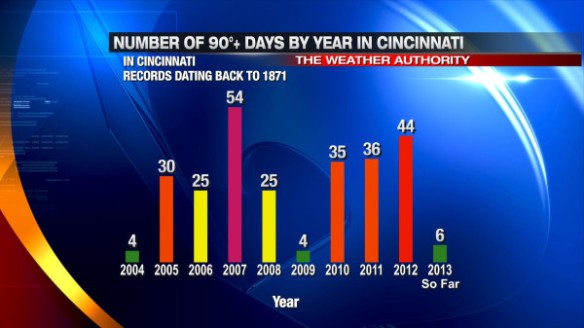
The high temperature has only hit 90° 6 days so far in 2013. With the heat from 2012 and 2011 fresh in our minds, this summer seems unusually cool. While this is true, we had even less 90°+ heat in 2004 and 2009:

aug25-90countbyyear

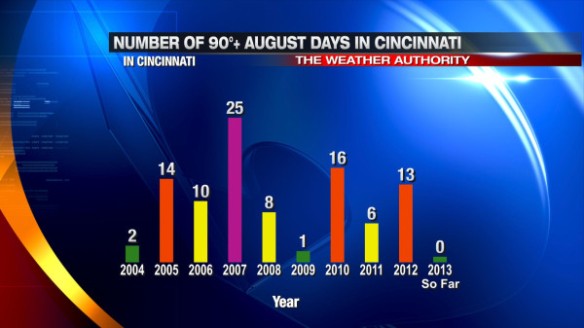
When you focus on just the month of August, the 90°+ day count is abnormally low so far (0 90°+ days so far this month):

aug25-90countaugust

We will hit 90°+ at least a few times in the next week, but we will come nowhere close to getting the 90°+ heat like we had in 2012, 2010, or 2007.

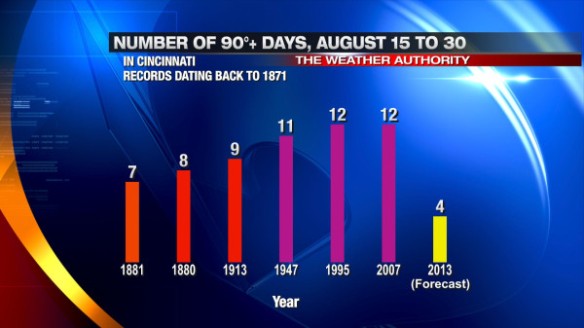
Is 90°+ heat unusual in late August? The simple answer is no. If you focus on just the last half of August (August 15th to 31st), our 90°+ count this year (forecast to be 4 days) will be will fall short of 2007, 1995, and several other years:

aug25-90countlateaugust

There is no doubt it will be hot and humid in the week ahead, but we’ve seen much worse in late August. Stay hydrated and cool in the week ahead!

Does A Colder Than Average Summer Mean A Colder Than Average Winter?

There have have been a lot of questions surfacing recently about whether the lack of heat this summer means the winter of 2013-2014 will be colder or snowier than average. I was at a speaking engagement last last week, and one of the few questions that came up was about what the fall and winter forecast.

Global patterns change frequently throughout the year. Many of the oscillations that occur in the atmosphere (that help to drive major weather systems) usually complete an oscillation on the scale of days, weeks, or months. As a result, it is very difficult to look at one season and use it to forecast another. Climatologists and meteorologists often make seasonal forecasts based on analogs, or years that have a similar setup to a certain pattern; however, there is rarely – if ever – a perfect match.

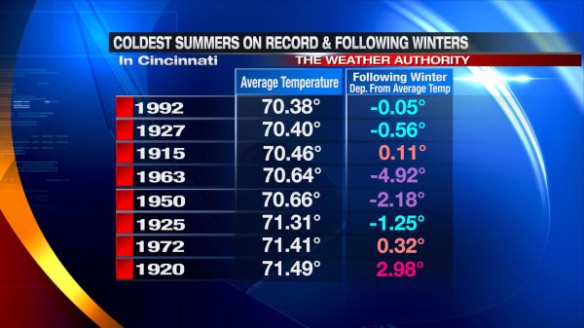
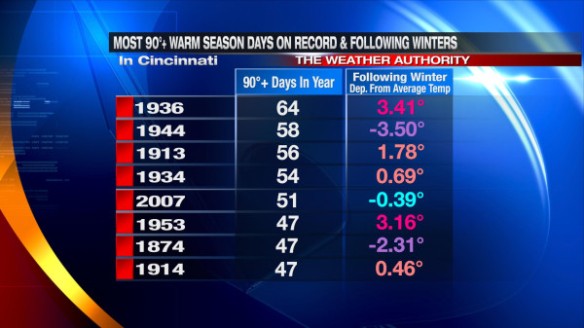
If summer 2013 had ended at midnight (on August 20th), summer 2013 (beginning June 1st) would only be the 35th coldest on record in Cincinnati. Weather records for Cincinnati go back to November 1, 1870, so it’s tough to have a “top 10” or “top 20” year for snow, rain, cold, or heat. When you compile a list of the coldest summers on record in Cincinnati and look at the temperature departure from average in the winter (December 1st to January 31) that followed, here’s what you’ll find:

aug20-coldestsummers

The numbers in blue highlight a slightly cooler than average winter, the purple numbers show a much cooler than average winter, the tan numbers spotlight a slightly warmer than average winter, and the pink numbers highlight a much warmer than average winter.

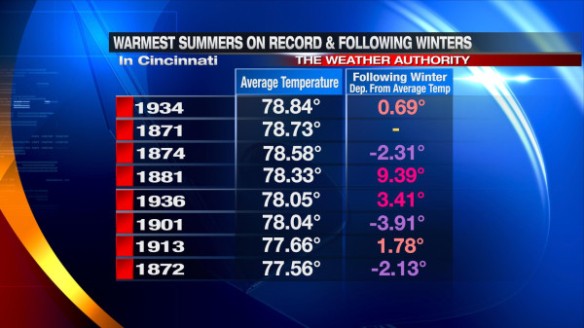
Many of the winters following the coldest summers on record were colder than average, but that wasn’t always the case. You’ll notice the same “sometimes but not always” thinking applies to the winters following the warmest summers on record in Cincinnati:

aug20-warmestsummers

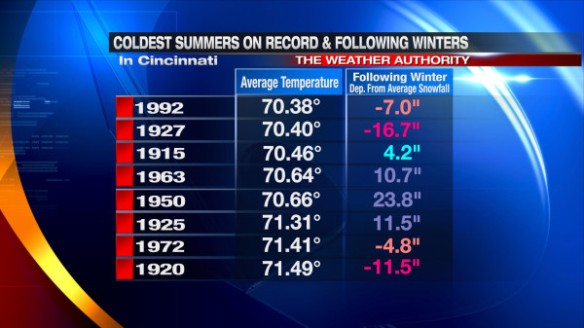
Does a colder than average summer mean we’ll mean a snowier than average winter is coming? Not necessarily. Here all the coldest summers on average and the snowfall departure from average in the winter that followed:

aug20-coldestsummersnow

The numbers in blue show a slightly snowier than average winter, the purple numbers spotlight a much snowier than average winter, the tan numbers highlight less snow than average in the winter, and the pink numbers shows 10″+ of snow below average in the winter.

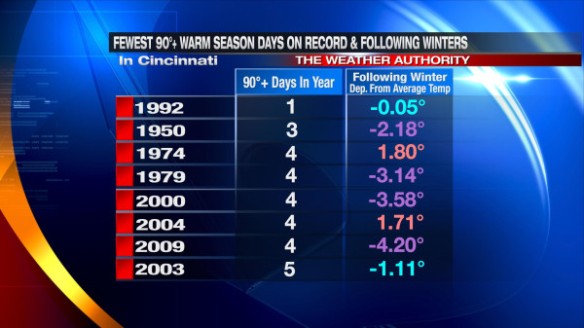
Does a lack of 90°+ days in the spring, summer, and fall mean the winter to come will be colder than average? Here’s the table of the fewest 90°+ days in the spring, summer, and fall plus the departure from average on the winter that followed:

aug20-fewest90

Sometimes the winter was warmer than average; sometimes it wasn’t. The same thinking applies to the list of the most 90°+ days in the spring, summer, and fall in Cincinnati:

aug20-most90

My Thoughts

It is way too early to be speculating about the upcoming winter forecast. We will begin to look at the winter forecast in September and fine tune our thinking in October and November. One or two weeks of abnormally cold or warm temperatures can affect the seasonal average. One or two big weather systems can affect the seasonal snowfall total in a big way. Even the exact orientation of lake-enhanced and lake-effect snow bands can affect temperatures and snowfall amounts. With high temperatures forecast to be in the 80s and 90s through next weekend, a winter forecast is not something I want to tackle yet.

I have found little to no correlation between summer heat and winter cold/precipitation. Summer 2012 was the 18th warmest summer on record in Cincinnati; the winter that followed was warmer but snowier than average. I remember saying last November that the winter of 2012-2013 would be near average for both temperatures and precipitation amounts, but my thinking was a lot different when when our first frost and freeze came earlier than usual in late September and early October.

When rumors of big snowstorm come each year, people are hoping for pinpoint totals several days out, when – in reality – it is best to issue a forecast when the confidence is higher and forecast models are more reliable. I will not speculate on the winter forecast until I have a good handle on what is going to happen. When a chill in the air returns, a discussion on the winter forecast will surface. Until then, enjoy what’s left of a rather calm, cool, and not too humid summer.

Wednesday Night’s Severe Threat: What It Is And What It Isn’t

If you’re concerned about the risk for severe storms Wednesday, Wednesday night, and very early Thursday, you should be. If you’re scared, you shouldn’t be. If you’re not prepared for the threat for severe storms, you should be.

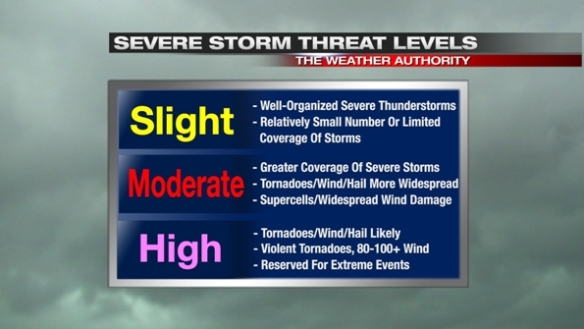
As I mentioned in my blog post early Tuesday evening, the Storm Prediction Center has issued MODERATE risk for severe storms in the Tri-State from 8am Wednesday to 8am Thursday; the biggest concern for severe storms will be Wednesday evening and overnight.

What exactly is a “Moderate Risk?” Here are the differences on the Slight, Moderate, and High Risk outlooks issued by SPC:
jun11-threatlevels

March 2, 2012 was a High Risk day, and it – unfortunately – verified with numerous violent tornadoes and more than a dozen killed in our area. We are not in an SPC High Risk Wednesday or Wednesday night, but we are in an SPC Moderate Risk, suggesting the threat for strong and severe storms is significant.

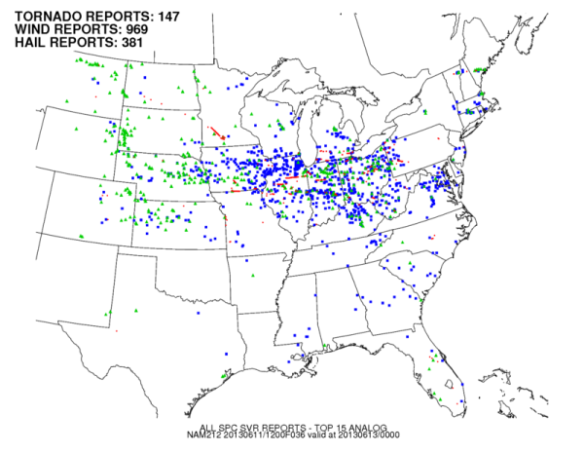
When you take data from this morning’s NAM forecast model for Wednesday night and compare it to similar weather event and setups in the past (using St. Louis University’s CIPS Analog Guidance), the top 15 closest matches suggest an elevated risk for severe storms. Here are all of the SPC storm reports from those top 15 closest matches:
jun11-12znam36hrsvr

All of the blue dots are damaging wind reports. Blue dots far outweigh green dots (severe hail reports) and red dots (tornado reports), so history would suggest this pattern will give us more damaging wind reports over other forms of severe weather.

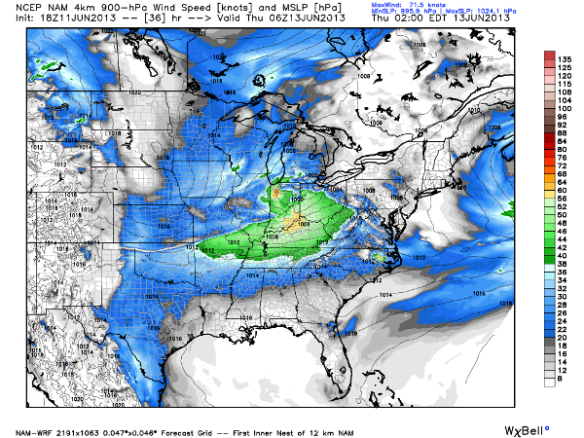
This is supported by this afternoon’s (18z) WRF model, which suggests winds 2,000-3,000 above Cincinnati at 2am Thursday morning will be in excess of 60mph:
jun11-6zthur850wind

This same run of the WRF shows storm relative helicity (a measure of how likely storms are to spin) values are elevated tomorrow night, but not abnormally high:
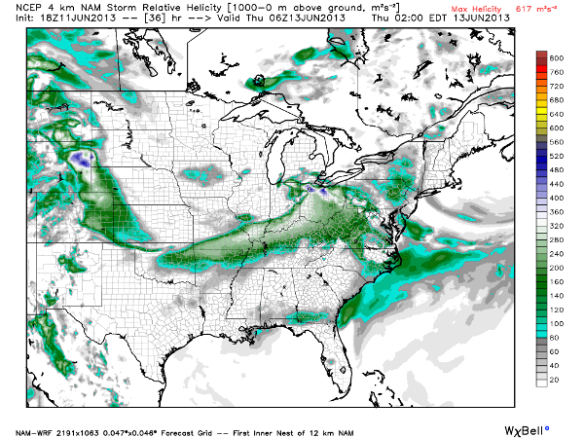
jun11-6zthurhelicity

These numbers support a marginal tornado threat Wednesday night and early Thursday. With the winds just above the ground very strong out of the west tomorrow night and a strong surface wind out of the southwest, there is little directional shear (needed for tornadoes) but strong speed shear (supporting a damaging straight-line wind threat).

What will the system look like on radar? There is still a fair amount of uncertainty regarding this, but most models suggest a bowing line of thunderstorms will be pushing through the Ohio Valley Wednesday evening and early Thursday. Our in-house WRF-ARW model shows a line of showers and thunderstorms moving into our area around 2am Thursday:
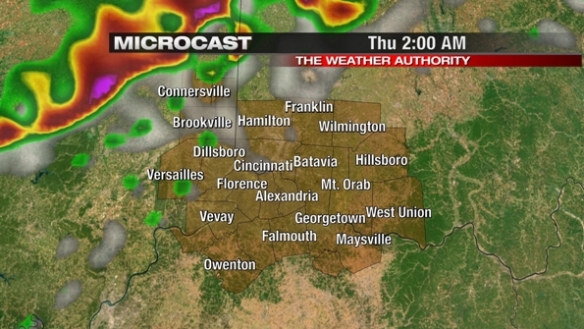
jun11-arw2amthur

…and moving into the heart of the Tri-State nearing 3am:
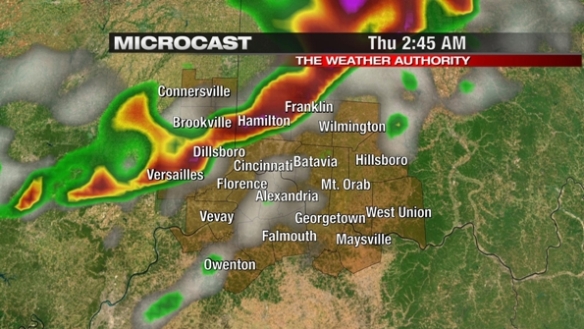
jun11-arw245amthur

…and pushing south by 8am Thursday morning:
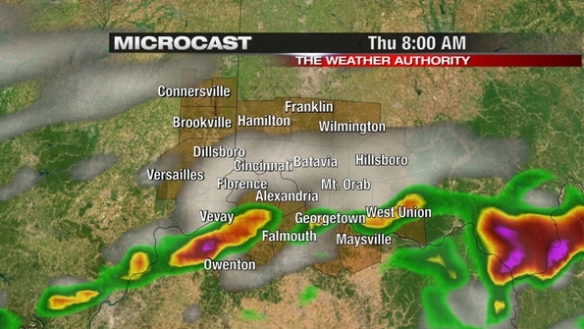
jun11-arw8amthur

This is just one model’s thoughts on what will happen tomorrow night. I suspect this model is off on timing given that most storms tomorrow night will generally be moving northwest to southeast at 40-50mph. This model, however, supports a bowing line of storms pushing through over a line or clusters of supercells.

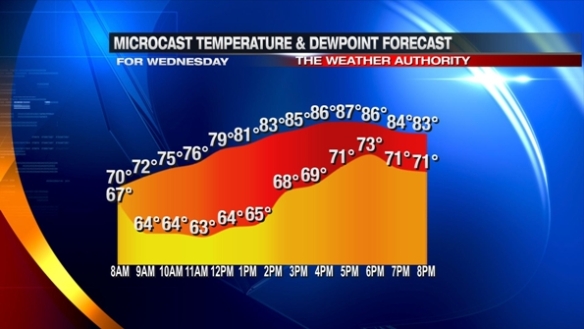
The elevated severe storm risk is being driven by strong southwesterly flow tomorrow, pumping warm moist air into the Ohio Valley. While the raw numbers from this morning’s Microcast run are off (especially for temperatures and dewpoints late in the day Wednesday) , the model clearly shows Wednesday and Wednesday evening will be warm and humid:
jun11-temptd

There is still a lot to be resolved about the severe weather threat in the next 48 hours. As with most severe weather events, the threat often changes hour-by-hour as the event draws closer. We don’t yet know exactly what shape these storms will take, and the timing of the peak severe weather threat hasn’t been pinned down yet. We do, however, know that damaging straight-line winds appear to be the main threat, and the secondary threats will be tornadoes, large hail, and flooding.

Are you prepared for the possibility of severe storms? Here are some things to consider:

– Is your NOAA Weather Radio working and programmed properly?
– Are there fresh batteries in your NOAA Weather Radio, and it is also plugged into a wall outlet?
– Do you have a flashlight with fresh batteries, hard-soled shoes, bottled water, and a first aid kit in your basement?
– Do you and your family know where to take cover if a warning is issued?
– If you’re going to be away from your home tomorrow night, do you know where to take cover if needed?
– Do you have more than two ways to get watch and warning information (NOAA Weather Radio, phone app, text messaging service, Twitter, Facebook)?

Please be prepared and weather aware for storms in the next 48 hours. Now is the time to plan; don’t wait until the storms hit!

Strong And Severe Storms Likely Tomorrow Night

While there will be clusters of showers and thunderstorms in and around the Tri-State this evening and also late tonight/early tomorrow, the main threat for severe storms in the Tri-State will come tomorrow night. While tornadoes and large hail will be possible with the strongest storms tomorrow and tomorrow night, damaging straight-line winds will be the main concern.

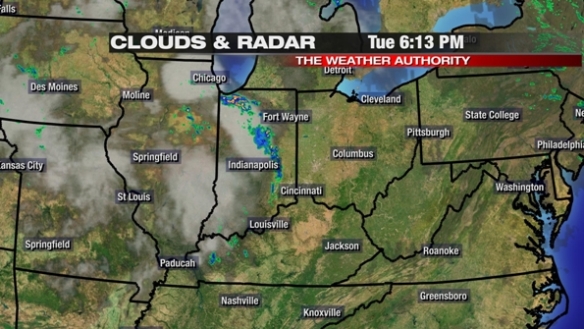
As a 6:13pm, satellite and radar data showed showers and thunderstorms taking aim on the Tri-State:

jun11-613pmradar

These clusters of showers and thunderstorms will be around through most of the evening.

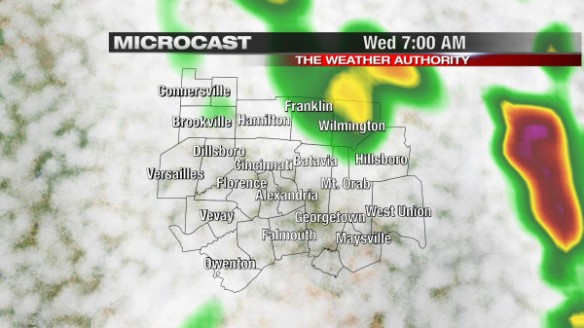
This morning’s Microcast model run has more showers and thunderstorms moving in late tonight and early tomorrow:

jun11-7ammc

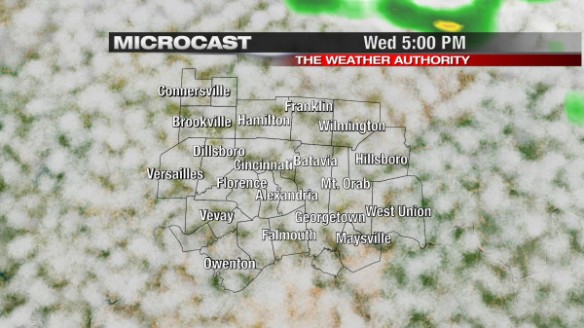
Stronger storms can’t be ruled out both this evening and late tonight, but a much higher threat for severe storms will develop late tomorrow afternoon and tomorrow evening. Microcast isn’t too excited about the coverage of showers and thunderstorms at 5pm Wednesday:

jun11-5pmmc

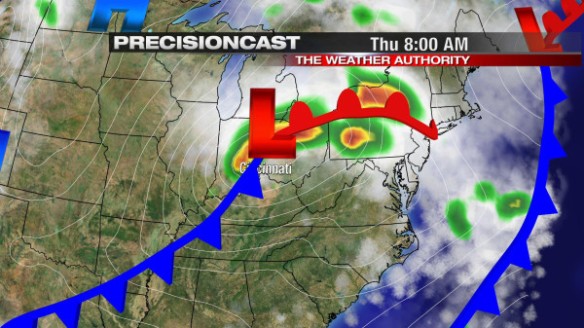
…but tomorrow night is a different story. Precisioncast has a strong area of low pressure coming through the Ohio Valley Wednesday night and early Thursday:

jun11-pc8amthur

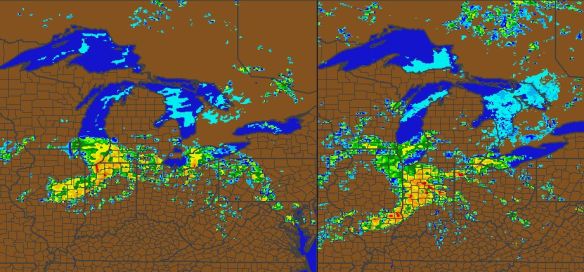
The window for severe storms tomorrow night is fairly large right now. If you buy Precisioncast, strong and severe storms may not arrive until after midnight. Do you like Precisioncast’s thinking, or do you like what the WRF model thinks the radar will look like at midnight Thursday?

screenshot

One version of the WRF model’s forecast radar for midnight Thursday is on the left; another version of the WRF is on the right. The difference in the strength and the timing of the showers and thunderstorms is significant, and we aren’t that far away from this event!

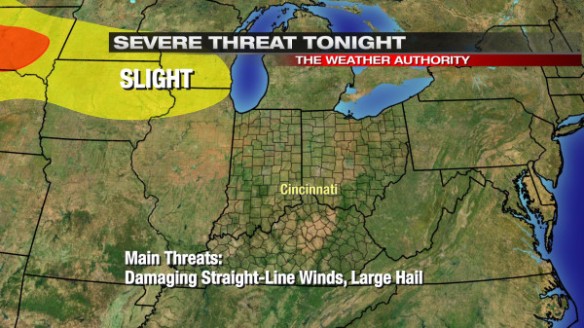
In summary, the Storm Prediction Center keeps the risk for severe storms well off to our northwest tonight:

jun11-svrmaptonight

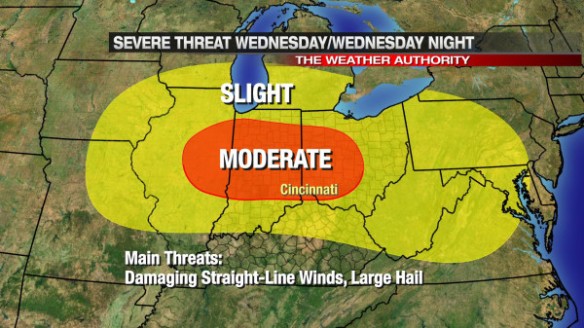
Most of the Tri-State will be under a MODERATE risk for severe storms from 8am Wednesday to 8am Thursday (the main severe weather threat will be Wednesday night and very early Thursday):

jun11-svrmap

Remember: damaging straight-line winds will be the main severe weather threat Wednesday and Wednesday night. Large hail, tornadoes, and localized flooding will be secondary severe weather concerns.

Are you prepared? Stay tuned for updates!

Signals Suggest Elevated Severe Storm Threat The Next Few Weeks

June is usually our busiest month for severe storms in the Tri-State. Spring – so far – has been very calm; only 13 Severe Thunderstorm Warnings have been issued in the Tri-State so far in 2013. On average, 26 Severe Thunderstorm Warnings are issued in southeastern Indiana, northern Kentucky, and southwestern Ohio each June. Model data suggests the next few weeks could be rather stormy.

Before diving into the data, the idea from this blog post came from me noticing a Twitter conversation between Ryan Wichman at WTOL in Toledo and Seth Binau at NWS Wilmington…and Ronald posting about this potentially stormy pattern on my Facebook page. Some of the topics mentioned below came from them.

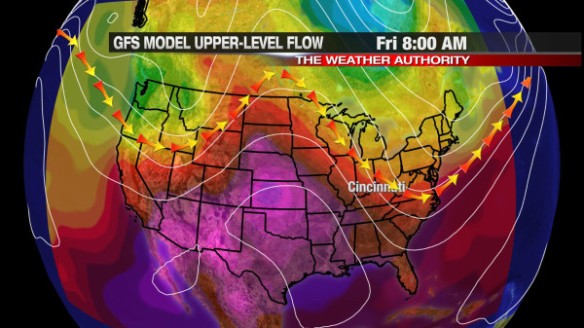
Why do the next few weeks look so stormy? The best argument for this can be seen in the upper-level pattern. Models suggest an area of high pressure will be setting up over the Plains this week (and likely in the weeks to follow), forcing disturbances to ride up and over this ridge of high pressure and dome of heat. Here’s what this morning’s GFS thinks the upper-level flow will look like Friday morning:

jun9-gfs

The “bubble” over the southern Plains is the area of high pressure. The warm (red and purple) colors show where the core of heat will be; in this case, red and purple colors support daytime highs in the 90s and 100s if little or no rain is forecast.

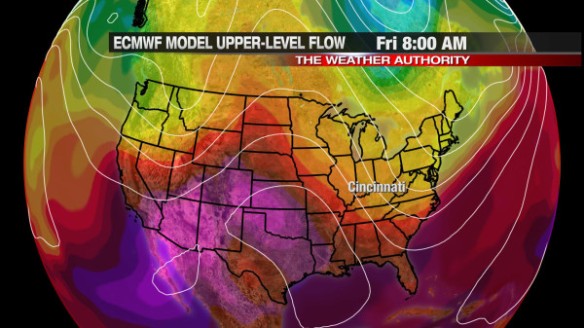
This morning’s ECMWF model has a similar upper-level pattern for Friday morning:

jun9-ec

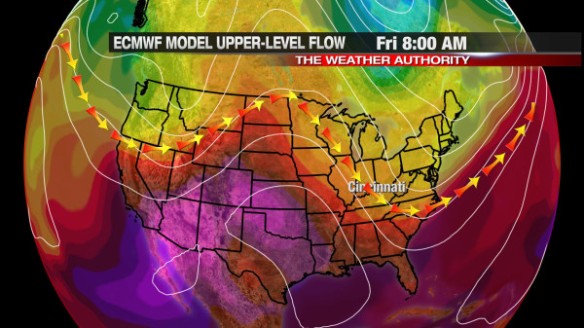
It’s important to note that upper-level winds tend to flow parallel to the lines on the map. In essence, here is path upper-level disturbances will take later this week per the GFS and ECMWF model, respectively:

jun9-gfsflow

jun9-ecflow

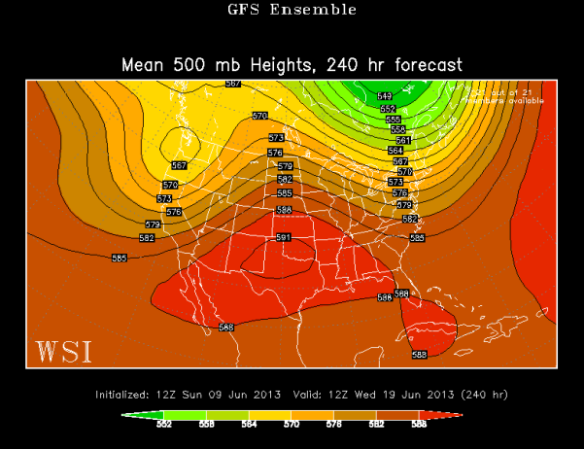
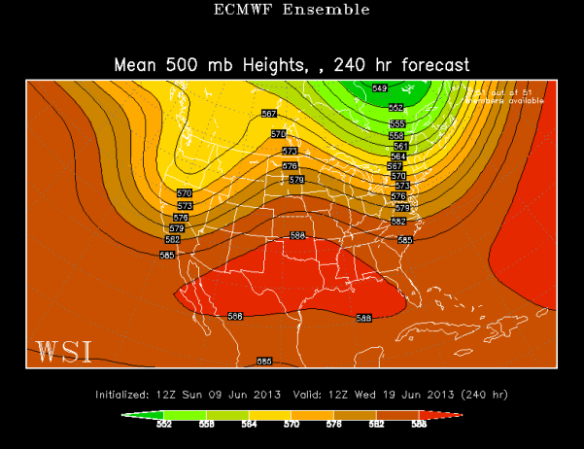
This pattern won’t change much into next week per this morning’s GFS Ensemble model:

jun6-gfse12zwed

…or this morning’s ECMWF Ensemble model:

jun6-ece12zwed

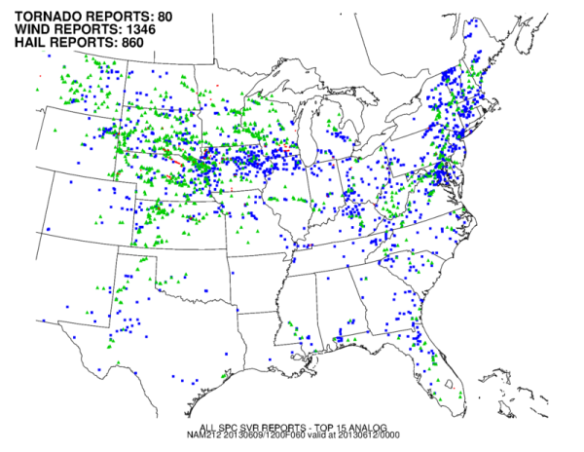
One way to assess the potential for severe weather is to compare the upper-level pattern to other days with a similar upper-level pattern in the past…and see what happened. This technique is called analog forecasting. What do the analogs suggest will happen? If you look at the GFS model’s output for Wednesday, the top 15 analogs (similar patterns) suggest a threat for severe storms. Here are all of the Storm Prediction Center storm reports for those top 15 analogs (wind reports are in blue, hail reports are in green):

jun6-svranalog

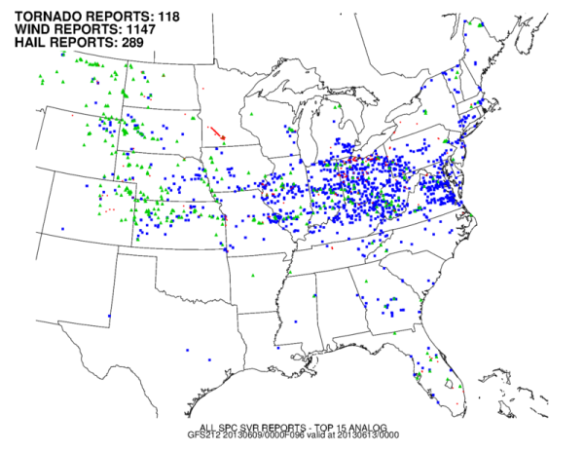
When last night’s GFS model data for Wednesday is fed into St. Louis University CIPS analog database, storm reports from those analogs suggest severe storms are a possibility Wednesday, especially damaging straight-line winds:

jun6-svranalog2

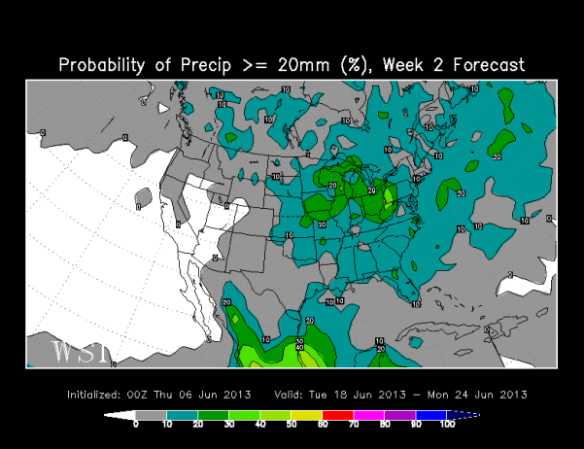
This storm pattern is likely not going to break down without a fight. The latest run of ECMWF Weekly model has the best chance for 3/4″+ of rain from June 18-24 in the Ohio Valley and Great Lakes:

jun6-ewwk2

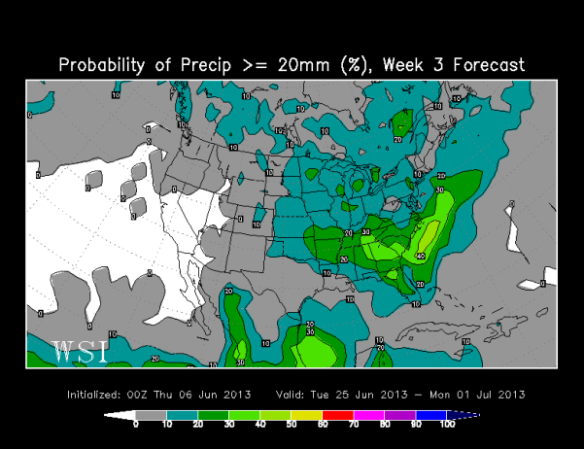
…and the best chance from June 25 to July 1st in the Ohio Valley and southeastern United States:

jun6-ewwk3

When you look at all of the data, there is fairly high confidence for a stormy pattern in the second half of June. The specifics on timing and strength of each disturbance will be tricky to pin down until we get close to each event. Our first chance for seeing strong and severe storms in this pattern comes Wednesday and into Thursday.

Are you prepared for some bouts of storms?